SlideShare uma empresa Scribd logo
1 de 46
Baixar para ler offline
Select supporting data for Lester R. Brown’s


 Full Planet, Empty Plates:
       The New Geopolitics of
           Food Scarcity
Chapter 1
Food: The Weak Link


                      Photo Credit: Yann Arthus-Bertrand
World Monthly Food Price Index,
                             January 1990 - August 2012
                  250


                  200


                                                                            Earth Policy Institute - www.earth-policy.org
2002-2004 = 100


                  150


                  100


                   50


                    0
                    1990   1995      2000          2005       2010   2015
                                         Source: FAO


                                                                     Photo Credit: USDA / Scott Bauer
World Corn, Wheat, and Rice Production, 1960-2011
      1,000

               900
                                                                         Corn


                                                                                      Earth Policy Institute - www.earth-policy.org
               800

               700
                                                                         Wheat
               600
Million Tons


               500
                                                                         Rice
               400

               300

               200

               100

                0
                 1960      1970      1980      1990        2000   2010            2020
                                            Source: USDA


                                                                                 Photo Credit: USDA / Scott Bauer
World Grain Stocks as Days of Consumption, 1960-2011
       140


       120


                                                                             Earth Policy Institute - www.earth-policy.org
       100
Days


        80


        60


        40


        20


         0
          1960        1970      1980      1990        2000   2010        2020
                                       Source: USDA


                                                                        Photo Credit: USDA / Scott Bauer
Chapter 2
The Ecology of Population Growth


                          Photo Credit: Yann Arthus-Bertrand
World Population, 1950-2010, with Projections to 2050
          12

          11

          10


                                                                                Earth Policy Institute - www.earth-policy.org
           9

           8
Billion


           7

           6

           5

           4

           3

           2
            1950        1970       1990          2010     2030       2050
                                          Source: UNPop


                                                                            Photo Credit: USDA / Scott Bauer
Humanity's Ecological Footprint, 1961-2007
                   2.0


                   1.8


                   1.6


                   1.4


                                                                                                                    Earth Policy Institute - www.earth-policy.org
                                    Point of Overshoot*
Number of Earths


                   1.2


                   1.0


                   0.8


                   0.6
                                                   * In 1976, for the first time, the total demands placed on
                                                   nature by the world economy reached the equivalent of
                   0.4
                                                   what the Earth can sustainably provide in a year. As of
                                                   2007, we are using the equivalent of 1.5 Earths—
                   0.2                             exceeding what nature can provide by half.


                   0.0
                      1960   1965      1970    1975       1980   1985     1990      1995     2000     2005      2010
                                               Source: Global Footprint Network


                                                                                                                Photo Credit: USDA / Scott Bauer
Female Secondary Education and Total Fertility Rates,
                                                 Latest Year
                       8


                       7


                                                                                                               Earth Policy Institute - www.earth-policy.org
                       6
Total Fertility Rate


                       5


                       4


                       3


                       2


                       1
                                                                                           R² = 0.6683


                       0
                           0         20           40               60              80          100
                                           Percent of Girls Enrolled in Secondary School

                                                       Source: EPI from UIS


                                                                                                         Photo Credit: USDA / Scott Bauer
Chapter 3
Moving Up the Food Chain


                     Photo Credit: USDA / Scott Bauer
World Meat Production by Type, 1950-2010
               120

                                                                    Pork


                                                                                              Earth Policy Institute - www.earth-policy.org
               100
                                                                              Poultry

               80
Million Tons


                                                                                  Beef
               60


               40


               20
                                                                              Mutton

                0
                 1950   1960    1970        1980       1990      2000      2010           2020

                                       Source: Worldwatch, FAO


                                                                                         Photo Credit: USDA / Scott Bauer
World Wild Fish Catch and Farmed Fish Production,
                                             1950-2010
               100

                90
                                                                       Wild Catch
                80


                                                                                               Earth Policy Institute - www.earth-policy.org
                70

                60
Million Tons


                50
                                                                  Farmed Fish
                40

                30

                20

                10

                 0
                  1950     1960     1970     1980          1990        2000         2010

                                             Source: FAO


                                                                                           Photo Credit: USDA / Scott Bauer
Meat Consumption in China and the United States,
                                          1960-2012
               80

                                                                  China
               70


                                                                                      Earth Policy Institute - www.earth-policy.org
               60


               50
Million Tons


               40
                                                                          United
                                                                          States
               30


               20


               10


                0
                 1960      1970      1980       1990       2000   2010             2020

                                            Source: USDA


                                                                               Photo Credit: USDA / Scott Bauer
Milk Production in India and the United States, 1961-2010
               140


               120
                                                                     India


                                                                                          Earth Policy Institute - www.earth-policy.org
               100
Million Tons


                80
                                                                      United States

                60


                40


                20


                 0
                  1960       1970       1980          1990    2000           2010

                                               Source: FAO


                                                                                      Photo Credit: USDA / Scott Bauer
Chapter 4
Food or Fuel?


                Photo Credit: iStockPhoto / Vasata Studio
World Fuel Ethanol Production, 1975-2012
                  25,000


                  20,000


                                                                                                       Earth Policy Institute - www.earth-policy.org
                  15,000
Million Gallons


                  10,000


                   5,000


                                                                    Note: 2012 is a projection.
                      0
                       1975   1980   1985   1990     1995       2000         2005       2010       2015

                                               Source: F.O. Licht


                                                                                                  Photo Credit: USDA / Scott Bauer
U.S. Corn Use for Feedgrain, Fuel Ethanol, and Exports,
                                              1980-2011
               180


               160
                                               Feedgrain


                                                                                                Earth Policy Institute - www.earth-policy.org
               140


               120
Million Tons


               100
                                                                  Fuel Ethanol
                80


                60


                40
                                                                                 Exports

                20


                 0
                  1980        1985    1990     1995        2000       2005       2010      2015
                                                 Source: USDA


                                                                                           Photo Credit: USDA / Scott Bauer
U.S. Motor Gasoline Consumption, 1950-2012
                  160


                  140


                  120


                                                                                                   Earth Policy Institute - www.earth-policy.org
                  100
Billion Gallons


                   80


                   60


                   40


                   20
                                                                Note: 2012 is a projection.
                    0
                     1950    1960     1970     1980          1990        2000          2010
                                               Source: DOE


                                                                                              Photo Credit: USDA / Scott Bauer
Chapter 5
Eroding Soils Darkening Our Future


                           Photo Credit: Yann Arthus-Bertrand
Dust Events in South Korea, 1970-2011
       140


                                                                   118
       120


                                                                                    Earth Policy Institute - www.earth-policy.org
       100


        80                                                 77
Days


        60


                                   39
        40

                23
        20


         0
             1970-1979          1980-1989            1990-1999   2000-2011
                                        Source: KMA; KME


                                                                             Photo Credit: USDA / Scott Bauer
Grazing Livestock in Nigeria, 1961-2010
               60

                                                                 Goats

               50


                                                                                       Earth Policy Institute - www.earth-policy.org
               40
                                                                      Sheep
Million Head


               30


               20
                                                                     Cattle


               10


                0
                 1960   1970       1980         1990      2000           2010
                                          Source: FAO


                                                                                Photo Credit: USDA / Scott Bauer
Livestock and Human Populations in Pakistan, 1961-2010
           200

           180
                                                                  Humans
           160


                                                                                          Earth Policy Institute - www.earth-policy.org
           140

                                                                       Livestock
           120
Millions


           100

            80

            60

            40

            20

             0
              1960          1970       1980         1990       2000        2010
                                          Source: FAO; UNPop


                                                                                   Photo Credit: USDA / Scott Bauer
Chapter 6
Peak Water and Food Scarcity


                       Photo Credit: Yann Arthus-Bertrand
Wheat Production and Consumption
                                in Saudi Arabia, 1960-2011
                4,500

                4,000
                                                               Consumption
                3,500


                                                                                    Earth Policy Institute - www.earth-policy.org
                3,000
Thousand Tons


                2,500

                2,000

                1,500

                1,000
                                                                  Production
                 500

                   0
                    1960   1970     1980       1990     2000           2010
                                       Source: USDA


                                                                               Photo Credit: USDA / Scott Bauer
Grain Production and Consumption in the
                           Arab Middle East and Israel, 1961-2011
               45
                                                             Consumption
               40

               35


                                                                                  Earth Policy Institute - www.earth-policy.org
               30
Million Tons


               25

               20

               15
                                                                     Production

               10

                5

                0
                 1960   1970       1980         1990      2000        2010
                                  Source: EPI from USDA


                                                                             Photo Credit: USDA / Scott Bauer
World Irrigated Area, 1961-2009
                   350


                   300


                                                                                   Earth Policy Institute - www.earth-policy.org
                   250
Million Hectares


                   200


                   150


                   100


                    50


                     0
                      1960   1970         1980         1990     2000   2010
                                                 Source: FAO


                                                                              Photo Credit: USDA / Scott Bauer
World Irrigated Area Per Thousand People, 1961-2009
           53


           51


           49


                                                                              Earth Policy Institute - www.earth-policy.org
           47
Hectares


           45


           43


           41


           39


           37


           35
             1960       1970       1980         1990       2000    2010
                                      Source: FAO; UNPop


                                                                          Photo Credit: USDA / Scott Bauer
Chapter 7
Grain Yields Starting to Plateau


                         Photo Credit: iStockPhoto / ollo
Wheat Yields in France, Germany, and the
                                 United Kingdom, 1961-2011
                   9


                   8


                                                                                        Earth Policy Institute - www.earth-policy.org
                   7


                   6
Tons Per Hectare


                   5


                   4                                              France
                                                                  Germany
                   3                                              United Kingdom

                   2


                   1


                   0
                    1960   1970      1980      1990        2000     2010            2020
                                       Source: FAO, USDA


                                                                                   Photo Credit: USDA / Scott Bauer
Rice Yields in China and Japan, 1960-2011
                   6


                                                                                    Earth Policy Institute - www.earth-policy.org
                   5
                                  Japan

                   4
Tons Per Hectare


                   3

                                          China

                   2


                   1


                   0
                    1960   1970           1980       1990        2000   2010    2020
                                                  Source: USDA


                                                                               Photo Credit: USDA / Scott Bauer
Fertilizer Consumption in Top Five Countries, 1961-2011
               60


                                                                       China
               50


                                                                                         Earth Policy Institute - www.earth-policy.org
               40
Million Tons


                                                                      India
               30


                                                                         United
               20                                                        States


                                                                         Brazil
               10

                                                                          Indonesia

                0
                 1961        1971      1981      1991        2001     2011            2021

                                               Source: IFA


                                                                                  Photo Credit: USDA / Scott Bauer
Chapter 8
Rising Temperatures, Rising Food Prices


                              Photo Credit: iStockPhoto / jansmarc
Atmospheric Carbon Dioxide Concentration, 1000-2011

                              390


                                                                                                                    Earth Policy Institute - www.earth-policy.org
                              370
Parts Per Million by Volume


                              350


                              330


                              310


                              290


                              270


                              250
                                 1000   1100   1200    1300    1400   1500   1600    1700      1800   1900   2000

                                                      Source: EPI from Worldwatch; NOAA/ESRL


                                                                                                               Photo Credit: USDA / Scott Bauer
Average Global Temperature, 1880-2011
                  14.7


                  14.5


                                                                                   Earth Policy Institute - www.earth-policy.org
                  14.3
Degrees Celsius


                  14.1


                  13.9


                  13.7


                  13.5


                  13.3
                      1880   1900   1920     1940      1960     1980    2000    2020
                                            Source: NASA GISS


                                                                               Photo Credit: USDA / Scott Bauer
Global Carbon Dioxide Emissions from Fossil Fuel
                                            Burning by Fuel Type, 1900-2011
                         4,500

                                                                                             Coal
                         4,000


                                                                                                    Earth Policy Institute - www.earthpolicy.org
                         3,500
Million Tons of Carbon


                         3,000
                                                                                             Oil
                         2,500

                         2,000

                         1,500

                         1,000                                                        Natural Gas


                          500

                            0
                             1900        1920       1940         1960          1980   2000
                                                  Source: EPI from CDIAC; BP


                                                                                              Photo Credit: USDA / Scott Bauer
Chapter 9
China and the Soybean Challenge


                         Photo Credit: Yann Arthus-Bertrand
World Soybean Production, 1950-2011
               300


               250


                                                                                Earth Policy Institute - www.earth-policy.org
               200
Million Tons


               150


               100


               50


                0
                 1950   1960    1970     1980       1990      2000   2010   2020
                                   Source: Worldwatch, USDA


                                                                            Photo Credit: USDA / Scott Bauer
Soybean Production, Consumption, and Imports in China,
                                         1964-2011
               80


                                                                                    Earth Policy Institute - www.earth-policy.org
               70

                                                                 Consumption
               60


               50
Million Tons


               40


               30
                                                                     Imports

               20


               10                                                 Production

                0
                 1964        1974         1984            1994     2004
                                           Source: USDA


                                                                               Photo Credit: USDA / Scott Bauer
Net Imports of Grain in China, 1960-2011
               20


               15


                                                                                                   Earth Policy Institute - www.earth-policy.org
               10


                5
Million Tons


                0


                -5


               -10


               -15


               -20
                     1960   1965    1970   1975   1980   1985   1990   1995   2000   2005   2010

                                              Source: EPI from USDA


                                                                                             Photo Credit: USDA / Scott Bauer
Area Harvested for Wheat, Corn, and Soybeans in the
                                     Western Hemisphere, 1960-2011
                   90

                                                                      Soybeans
                   80


                                                                                       Earth Policy Institute - www.earth-policy.org
                   70
                                                                        Corn
Million Hectares


                   60


                   50
                                                                       Wheat
                   40


                   30


                   20


                   10


                    0
                     1960      1970      1980       1990       2000    2010        2020
                                                Source: USDA


                                                                                  Photo Credit: USDA / Scott Bauer
Chapter 10
The Global Land Rush


                   Photo Credit: iStockPhoto / susoy
Large-scale Land Acquisition Area by
              Target Region, October 2008 – August 2009
                                                   Middle East and
           Latin America and                      North Africa, 1.9%
            the Caribbean,
                  5.7%


   Europe and
Central Asia, 7.6%


                     Southeast Asia,
                         14.7%

                                                 Sub-Saharan
                                                 Africa, 70.1%


                     Total Area: 56.6 million hectares in 203 projects
                 Source: GRAIN data compiled by Deininger and Byerlee (2011)


                                                                               Photo Credit: USDA / Scott Bauer
Large-scale Land Acquisitions by Project Type,
        October 2008 – August 2009


             Biofuel Crops
                  21%

                                        Food Crops
                                           37%

        Industrial, Cash
            Crops
             21%

                              Conservation
                            Reserves, Game
                           Farms, Livestock,
                           Plantation Forestry
                                   21%


                    Total Projects: 405
 Source: GRAIN data compiled by Deininger and Byerlee (2011)


                                                               Photo Credit: USDA / Scott Bauer
Chapter 11
Can We Prevent a Food Breakdown?


                          Photo Credit: Yann Arthus-Bertrand
Plan B Carbon Dioxide Emissions Reduction Goals for 2020
                                          (Million Tons of Carbon)


                                                                                                            Earth Policy Institute - www.earth-policy.org
                          Remaining net
                           emissions

                                                                             Replacing fossil
                                           1,680                                 fuels with
                                                                              renewables for
                Managing soils to                                           electricity and heat
                sequester carbon
                                                              3,210
                                           600

                  Planting trees to        860
                 sequester carbon                                               Restructuring the
                                                 1,500      1,400               transport system


                                Ending net
                                                      Reducing coal and
                               deforestation
                                                      oil use in industry
                                                              100


Baseline Emissions (2006) = 9,350 Million Tons of Carbon                                      Source: EPI


                                                                                                      Photo Credit: USDA / Scott Bauer
To learn more about the global food
            situation…
                    read Full Planet, Empty
                  Plates: The New Geopolitics
                       of Food Scarcity by
                   Lester R. Brown. The book
                     and supporting data sets
                           are available at
                      www.earth-policy.org

Mais conteúdo relacionado

Mais de Earth Policy Institute

Mais de Earth Policy Institute (12)

Athletics
AthleticsAthletics
Athletics
 
Publishers and Other Interesting People
Publishers and Other Interesting PeoplePublishers and Other Interesting People
Publishers and Other Interesting People
 
Earth Policy Institute
Earth Policy InstituteEarth Policy Institute
Earth Policy Institute
 
Worldwatch Institute
Worldwatch InstituteWorldwatch Institute
Worldwatch Institute
 
India,1956
India,1956India,1956
India,1956
 
Lester Brown at the USDA
Lester Brown at the USDALester Brown at the USDA
Lester Brown at the USDA
 
Lester Brown at the Overseas Development Council
Lester Brown at the Overseas Development CouncilLester Brown at the Overseas Development Council
Lester Brown at the Overseas Development Council
 
Lester Brown's Family Life
Lester Brown's Family LifeLester Brown's Family Life
Lester Brown's Family Life
 
Full Planet, Empty Plates Appetizer Slideshow
Full Planet, Empty Plates Appetizer SlideshowFull Planet, Empty Plates Appetizer Slideshow
Full Planet, Empty Plates Appetizer Slideshow
 
Full Planet, Empty Plates Slideshow Presentation
Full Planet, Empty Plates Slideshow PresentationFull Planet, Empty Plates Slideshow Presentation
Full Planet, Empty Plates Slideshow Presentation
 
So Much Accomplished...So Much To Do
So Much Accomplished...So Much To DoSo Much Accomplished...So Much To Do
So Much Accomplished...So Much To Do
 
Summary Presentation for World on the Edge: How to Prevent Environmental and ...
Summary Presentation for World on the Edge: How to Prevent Environmental and ...Summary Presentation for World on the Edge: How to Prevent Environmental and ...
Summary Presentation for World on the Edge: How to Prevent Environmental and ...
 

Último

Geoffrey Chaucer Works II UGC NET JRF TGT PGT MA PHD Entrance Exam II History...
Geoffrey Chaucer Works II UGC NET JRF TGT PGT MA PHD Entrance Exam II History...Geoffrey Chaucer Works II UGC NET JRF TGT PGT MA PHD Entrance Exam II History...
Geoffrey Chaucer Works II UGC NET JRF TGT PGT MA PHD Entrance Exam II History...DrVipulVKapoor
 
31 ĐỀ THI THỬ VÀO LỚP 10 - TIẾNG ANH - FORM MỚI 2025 - 40 CÂU HỎI - BÙI VĂN V...
31 ĐỀ THI THỬ VÀO LỚP 10 - TIẾNG ANH - FORM MỚI 2025 - 40 CÂU HỎI - BÙI VĂN V...31 ĐỀ THI THỬ VÀO LỚP 10 - TIẾNG ANH - FORM MỚI 2025 - 40 CÂU HỎI - BÙI VĂN V...
31 ĐỀ THI THỬ VÀO LỚP 10 - TIẾNG ANH - FORM MỚI 2025 - 40 CÂU HỎI - BÙI VĂN V...Nguyen Thanh Tu Collection
 
Decoding the Tweet _ Practical Criticism in the Age of Hashtag.pptx
Decoding the Tweet _ Practical Criticism in the Age of Hashtag.pptxDecoding the Tweet _ Practical Criticism in the Age of Hashtag.pptx
Decoding the Tweet _ Practical Criticism in the Age of Hashtag.pptxDhatriParmar
 
BIOCHEMISTRY-CARBOHYDRATE METABOLISM CHAPTER 2.pptx
BIOCHEMISTRY-CARBOHYDRATE METABOLISM CHAPTER 2.pptxBIOCHEMISTRY-CARBOHYDRATE METABOLISM CHAPTER 2.pptx
BIOCHEMISTRY-CARBOHYDRATE METABOLISM CHAPTER 2.pptxSayali Powar
 
The Emergence of Legislative Behavior in the Colombian Congress
The Emergence of Legislative Behavior in the Colombian CongressThe Emergence of Legislative Behavior in the Colombian Congress
The Emergence of Legislative Behavior in the Colombian CongressMaria Paula Aroca
 
ICS 2208 Lecture Slide Notes for Topic 6
ICS 2208 Lecture Slide Notes for Topic 6ICS 2208 Lecture Slide Notes for Topic 6
ICS 2208 Lecture Slide Notes for Topic 6Vanessa Camilleri
 
An Overview of the Calendar App in Odoo 17 ERP
An Overview of the Calendar App in Odoo 17 ERPAn Overview of the Calendar App in Odoo 17 ERP
An Overview of the Calendar App in Odoo 17 ERPCeline George
 
BÀI TẬP BỔ TRỢ TIẾNG ANH 11 THEO ĐƠN VỊ BÀI HỌC - CẢ NĂM - CÓ FILE NGHE (GLOB...
BÀI TẬP BỔ TRỢ TIẾNG ANH 11 THEO ĐƠN VỊ BÀI HỌC - CẢ NĂM - CÓ FILE NGHE (GLOB...BÀI TẬP BỔ TRỢ TIẾNG ANH 11 THEO ĐƠN VỊ BÀI HỌC - CẢ NĂM - CÓ FILE NGHE (GLOB...
BÀI TẬP BỔ TRỢ TIẾNG ANH 11 THEO ĐƠN VỊ BÀI HỌC - CẢ NĂM - CÓ FILE NGHE (GLOB...Nguyen Thanh Tu Collection
 
MS4 level being good citizen -imperative- (1) (1).pdf
MS4 level   being good citizen -imperative- (1) (1).pdfMS4 level   being good citizen -imperative- (1) (1).pdf
MS4 level being good citizen -imperative- (1) (1).pdfMr Bounab Samir
 
Healthy Minds, Flourishing Lives: A Philosophical Approach to Mental Health a...
Healthy Minds, Flourishing Lives: A Philosophical Approach to Mental Health a...Healthy Minds, Flourishing Lives: A Philosophical Approach to Mental Health a...
Healthy Minds, Flourishing Lives: A Philosophical Approach to Mental Health a...Osopher
 
Congestive Cardiac Failure..presentation
Congestive Cardiac Failure..presentationCongestive Cardiac Failure..presentation
Congestive Cardiac Failure..presentationdeepaannamalai16
 
DiskStorage_BasicFileStructuresandHashing.pdf
DiskStorage_BasicFileStructuresandHashing.pdfDiskStorage_BasicFileStructuresandHashing.pdf
DiskStorage_BasicFileStructuresandHashing.pdfChristalin Nelson
 
Narcotic and Non Narcotic Analgesic..pdf
Narcotic and Non Narcotic Analgesic..pdfNarcotic and Non Narcotic Analgesic..pdf
Narcotic and Non Narcotic Analgesic..pdfPrerana Jadhav
 
BÀI TẬP BỔ TRỢ TIẾNG ANH 8 - I-LEARN SMART WORLD - CẢ NĂM - CÓ FILE NGHE (BẢN...
BÀI TẬP BỔ TRỢ TIẾNG ANH 8 - I-LEARN SMART WORLD - CẢ NĂM - CÓ FILE NGHE (BẢN...BÀI TẬP BỔ TRỢ TIẾNG ANH 8 - I-LEARN SMART WORLD - CẢ NĂM - CÓ FILE NGHE (BẢN...
BÀI TẬP BỔ TRỢ TIẾNG ANH 8 - I-LEARN SMART WORLD - CẢ NĂM - CÓ FILE NGHE (BẢN...Nguyen Thanh Tu Collection
 
physiotherapy in Acne condition.....pptx
physiotherapy in Acne condition.....pptxphysiotherapy in Acne condition.....pptx
physiotherapy in Acne condition.....pptxAneriPatwari
 

Último (20)

Geoffrey Chaucer Works II UGC NET JRF TGT PGT MA PHD Entrance Exam II History...
Geoffrey Chaucer Works II UGC NET JRF TGT PGT MA PHD Entrance Exam II History...Geoffrey Chaucer Works II UGC NET JRF TGT PGT MA PHD Entrance Exam II History...
Geoffrey Chaucer Works II UGC NET JRF TGT PGT MA PHD Entrance Exam II History...
 
31 ĐỀ THI THỬ VÀO LỚP 10 - TIẾNG ANH - FORM MỚI 2025 - 40 CÂU HỎI - BÙI VĂN V...
31 ĐỀ THI THỬ VÀO LỚP 10 - TIẾNG ANH - FORM MỚI 2025 - 40 CÂU HỎI - BÙI VĂN V...31 ĐỀ THI THỬ VÀO LỚP 10 - TIẾNG ANH - FORM MỚI 2025 - 40 CÂU HỎI - BÙI VĂN V...
31 ĐỀ THI THỬ VÀO LỚP 10 - TIẾNG ANH - FORM MỚI 2025 - 40 CÂU HỎI - BÙI VĂN V...
 
Decoding the Tweet _ Practical Criticism in the Age of Hashtag.pptx
Decoding the Tweet _ Practical Criticism in the Age of Hashtag.pptxDecoding the Tweet _ Practical Criticism in the Age of Hashtag.pptx
Decoding the Tweet _ Practical Criticism in the Age of Hashtag.pptx
 
BIOCHEMISTRY-CARBOHYDRATE METABOLISM CHAPTER 2.pptx
BIOCHEMISTRY-CARBOHYDRATE METABOLISM CHAPTER 2.pptxBIOCHEMISTRY-CARBOHYDRATE METABOLISM CHAPTER 2.pptx
BIOCHEMISTRY-CARBOHYDRATE METABOLISM CHAPTER 2.pptx
 
Chi-Square Test Non Parametric Test Categorical Variable
Chi-Square Test Non Parametric Test Categorical VariableChi-Square Test Non Parametric Test Categorical Variable
Chi-Square Test Non Parametric Test Categorical Variable
 
The Emergence of Legislative Behavior in the Colombian Congress
The Emergence of Legislative Behavior in the Colombian CongressThe Emergence of Legislative Behavior in the Colombian Congress
The Emergence of Legislative Behavior in the Colombian Congress
 
Mattingly "AI & Prompt Design" - Introduction to Machine Learning"
Mattingly "AI & Prompt Design" - Introduction to Machine Learning"Mattingly "AI & Prompt Design" - Introduction to Machine Learning"
Mattingly "AI & Prompt Design" - Introduction to Machine Learning"
 
ICS 2208 Lecture Slide Notes for Topic 6
ICS 2208 Lecture Slide Notes for Topic 6ICS 2208 Lecture Slide Notes for Topic 6
ICS 2208 Lecture Slide Notes for Topic 6
 
Plagiarism,forms,understand about plagiarism,avoid plagiarism,key significanc...
Plagiarism,forms,understand about plagiarism,avoid plagiarism,key significanc...Plagiarism,forms,understand about plagiarism,avoid plagiarism,key significanc...
Plagiarism,forms,understand about plagiarism,avoid plagiarism,key significanc...
 
Spearman's correlation,Formula,Advantages,
Spearman's correlation,Formula,Advantages,Spearman's correlation,Formula,Advantages,
Spearman's correlation,Formula,Advantages,
 
An Overview of the Calendar App in Odoo 17 ERP
An Overview of the Calendar App in Odoo 17 ERPAn Overview of the Calendar App in Odoo 17 ERP
An Overview of the Calendar App in Odoo 17 ERP
 
BÀI TẬP BỔ TRỢ TIẾNG ANH 11 THEO ĐƠN VỊ BÀI HỌC - CẢ NĂM - CÓ FILE NGHE (GLOB...
BÀI TẬP BỔ TRỢ TIẾNG ANH 11 THEO ĐƠN VỊ BÀI HỌC - CẢ NĂM - CÓ FILE NGHE (GLOB...BÀI TẬP BỔ TRỢ TIẾNG ANH 11 THEO ĐƠN VỊ BÀI HỌC - CẢ NĂM - CÓ FILE NGHE (GLOB...
BÀI TẬP BỔ TRỢ TIẾNG ANH 11 THEO ĐƠN VỊ BÀI HỌC - CẢ NĂM - CÓ FILE NGHE (GLOB...
 
MS4 level being good citizen -imperative- (1) (1).pdf
MS4 level   being good citizen -imperative- (1) (1).pdfMS4 level   being good citizen -imperative- (1) (1).pdf
MS4 level being good citizen -imperative- (1) (1).pdf
 
Healthy Minds, Flourishing Lives: A Philosophical Approach to Mental Health a...
Healthy Minds, Flourishing Lives: A Philosophical Approach to Mental Health a...Healthy Minds, Flourishing Lives: A Philosophical Approach to Mental Health a...
Healthy Minds, Flourishing Lives: A Philosophical Approach to Mental Health a...
 
Congestive Cardiac Failure..presentation
Congestive Cardiac Failure..presentationCongestive Cardiac Failure..presentation
Congestive Cardiac Failure..presentation
 
DiskStorage_BasicFileStructuresandHashing.pdf
DiskStorage_BasicFileStructuresandHashing.pdfDiskStorage_BasicFileStructuresandHashing.pdf
DiskStorage_BasicFileStructuresandHashing.pdf
 
Narcotic and Non Narcotic Analgesic..pdf
Narcotic and Non Narcotic Analgesic..pdfNarcotic and Non Narcotic Analgesic..pdf
Narcotic and Non Narcotic Analgesic..pdf
 
BÀI TẬP BỔ TRỢ TIẾNG ANH 8 - I-LEARN SMART WORLD - CẢ NĂM - CÓ FILE NGHE (BẢN...
BÀI TẬP BỔ TRỢ TIẾNG ANH 8 - I-LEARN SMART WORLD - CẢ NĂM - CÓ FILE NGHE (BẢN...BÀI TẬP BỔ TRỢ TIẾNG ANH 8 - I-LEARN SMART WORLD - CẢ NĂM - CÓ FILE NGHE (BẢN...
BÀI TẬP BỔ TRỢ TIẾNG ANH 8 - I-LEARN SMART WORLD - CẢ NĂM - CÓ FILE NGHE (BẢN...
 
CARNAVAL COM MAGIA E EUFORIA _
CARNAVAL COM MAGIA E EUFORIA            _CARNAVAL COM MAGIA E EUFORIA            _
CARNAVAL COM MAGIA E EUFORIA _
 
physiotherapy in Acne condition.....pptx
physiotherapy in Acne condition.....pptxphysiotherapy in Acne condition.....pptx
physiotherapy in Acne condition.....pptx
 

Full Planet, Empty Plates Data Slideshow

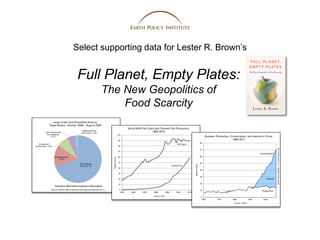
  • 1. Select supporting data for Lester R. Brown’s Full Planet, Empty Plates: The New Geopolitics of Food Scarcity
  • 2. Chapter 1 Food: The Weak Link Photo Credit: Yann Arthus-Bertrand
  • 3. World Monthly Food Price Index, January 1990 - August 2012 250 200 Earth Policy Institute - www.earth-policy.org 2002-2004 = 100 150 100 50 0 1990 1995 2000 2005 2010 2015 Source: FAO Photo Credit: USDA / Scott Bauer
  • 4. World Corn, Wheat, and Rice Production, 1960-2011 1,000 900 Corn Earth Policy Institute - www.earth-policy.org 800 700 Wheat 600 Million Tons 500 Rice 400 300 200 100 0 1960 1970 1980 1990 2000 2010 2020 Source: USDA Photo Credit: USDA / Scott Bauer
  • 5. World Grain Stocks as Days of Consumption, 1960-2011 140 120 Earth Policy Institute - www.earth-policy.org 100 Days 80 60 40 20 0 1960 1970 1980 1990 2000 2010 2020 Source: USDA Photo Credit: USDA / Scott Bauer
  • 6. Chapter 2 The Ecology of Population Growth Photo Credit: Yann Arthus-Bertrand
  • 7. World Population, 1950-2010, with Projections to 2050 12 11 10 Earth Policy Institute - www.earth-policy.org 9 8 Billion 7 6 5 4 3 2 1950 1970 1990 2010 2030 2050 Source: UNPop Photo Credit: USDA / Scott Bauer
  • 8. Humanity's Ecological Footprint, 1961-2007 2.0 1.8 1.6 1.4 Earth Policy Institute - www.earth-policy.org Point of Overshoot* Number of Earths 1.2 1.0 0.8 0.6 * In 1976, for the first time, the total demands placed on nature by the world economy reached the equivalent of 0.4 what the Earth can sustainably provide in a year. As of 2007, we are using the equivalent of 1.5 Earths— 0.2 exceeding what nature can provide by half. 0.0 1960 1965 1970 1975 1980 1985 1990 1995 2000 2005 2010 Source: Global Footprint Network Photo Credit: USDA / Scott Bauer
  • 9. Female Secondary Education and Total Fertility Rates, Latest Year 8 7 Earth Policy Institute - www.earth-policy.org 6 Total Fertility Rate 5 4 3 2 1 R² = 0.6683 0 0 20 40 60 80 100 Percent of Girls Enrolled in Secondary School Source: EPI from UIS Photo Credit: USDA / Scott Bauer
  • 10. Chapter 3 Moving Up the Food Chain Photo Credit: USDA / Scott Bauer
  • 11. World Meat Production by Type, 1950-2010 120 Pork Earth Policy Institute - www.earth-policy.org 100 Poultry 80 Million Tons Beef 60 40 20 Mutton 0 1950 1960 1970 1980 1990 2000 2010 2020 Source: Worldwatch, FAO Photo Credit: USDA / Scott Bauer
  • 12. World Wild Fish Catch and Farmed Fish Production, 1950-2010 100 90 Wild Catch 80 Earth Policy Institute - www.earth-policy.org 70 60 Million Tons 50 Farmed Fish 40 30 20 10 0 1950 1960 1970 1980 1990 2000 2010 Source: FAO Photo Credit: USDA / Scott Bauer
  • 13. Meat Consumption in China and the United States, 1960-2012 80 China 70 Earth Policy Institute - www.earth-policy.org 60 50 Million Tons 40 United States 30 20 10 0 1960 1970 1980 1990 2000 2010 2020 Source: USDA Photo Credit: USDA / Scott Bauer
  • 14. Milk Production in India and the United States, 1961-2010 140 120 India Earth Policy Institute - www.earth-policy.org 100 Million Tons 80 United States 60 40 20 0 1960 1970 1980 1990 2000 2010 Source: FAO Photo Credit: USDA / Scott Bauer
  • 15. Chapter 4 Food or Fuel? Photo Credit: iStockPhoto / Vasata Studio
  • 16. World Fuel Ethanol Production, 1975-2012 25,000 20,000 Earth Policy Institute - www.earth-policy.org 15,000 Million Gallons 10,000 5,000 Note: 2012 is a projection. 0 1975 1980 1985 1990 1995 2000 2005 2010 2015 Source: F.O. Licht Photo Credit: USDA / Scott Bauer
  • 17. U.S. Corn Use for Feedgrain, Fuel Ethanol, and Exports, 1980-2011 180 160 Feedgrain Earth Policy Institute - www.earth-policy.org 140 120 Million Tons 100 Fuel Ethanol 80 60 40 Exports 20 0 1980 1985 1990 1995 2000 2005 2010 2015 Source: USDA Photo Credit: USDA / Scott Bauer
  • 18. U.S. Motor Gasoline Consumption, 1950-2012 160 140 120 Earth Policy Institute - www.earth-policy.org 100 Billion Gallons 80 60 40 20 Note: 2012 is a projection. 0 1950 1960 1970 1980 1990 2000 2010 Source: DOE Photo Credit: USDA / Scott Bauer
  • 19. Chapter 5 Eroding Soils Darkening Our Future Photo Credit: Yann Arthus-Bertrand
  • 20. Dust Events in South Korea, 1970-2011 140 118 120 Earth Policy Institute - www.earth-policy.org 100 80 77 Days 60 39 40 23 20 0 1970-1979 1980-1989 1990-1999 2000-2011 Source: KMA; KME Photo Credit: USDA / Scott Bauer
  • 21. Grazing Livestock in Nigeria, 1961-2010 60 Goats 50 Earth Policy Institute - www.earth-policy.org 40 Sheep Million Head 30 20 Cattle 10 0 1960 1970 1980 1990 2000 2010 Source: FAO Photo Credit: USDA / Scott Bauer
  • 22. Livestock and Human Populations in Pakistan, 1961-2010 200 180 Humans 160 Earth Policy Institute - www.earth-policy.org 140 Livestock 120 Millions 100 80 60 40 20 0 1960 1970 1980 1990 2000 2010 Source: FAO; UNPop Photo Credit: USDA / Scott Bauer
  • 23. Chapter 6 Peak Water and Food Scarcity Photo Credit: Yann Arthus-Bertrand
  • 24. Wheat Production and Consumption in Saudi Arabia, 1960-2011 4,500 4,000 Consumption 3,500 Earth Policy Institute - www.earth-policy.org 3,000 Thousand Tons 2,500 2,000 1,500 1,000 Production 500 0 1960 1970 1980 1990 2000 2010 Source: USDA Photo Credit: USDA / Scott Bauer
  • 25. Grain Production and Consumption in the Arab Middle East and Israel, 1961-2011 45 Consumption 40 35 Earth Policy Institute - www.earth-policy.org 30 Million Tons 25 20 15 Production 10 5 0 1960 1970 1980 1990 2000 2010 Source: EPI from USDA Photo Credit: USDA / Scott Bauer
  • 26. World Irrigated Area, 1961-2009 350 300 Earth Policy Institute - www.earth-policy.org 250 Million Hectares 200 150 100 50 0 1960 1970 1980 1990 2000 2010 Source: FAO Photo Credit: USDA / Scott Bauer
  • 27. World Irrigated Area Per Thousand People, 1961-2009 53 51 49 Earth Policy Institute - www.earth-policy.org 47 Hectares 45 43 41 39 37 35 1960 1970 1980 1990 2000 2010 Source: FAO; UNPop Photo Credit: USDA / Scott Bauer
  • 28. Chapter 7 Grain Yields Starting to Plateau Photo Credit: iStockPhoto / ollo
  • 29. Wheat Yields in France, Germany, and the United Kingdom, 1961-2011 9 8 Earth Policy Institute - www.earth-policy.org 7 6 Tons Per Hectare 5 4 France Germany 3 United Kingdom 2 1 0 1960 1970 1980 1990 2000 2010 2020 Source: FAO, USDA Photo Credit: USDA / Scott Bauer
  • 30. Rice Yields in China and Japan, 1960-2011 6 Earth Policy Institute - www.earth-policy.org 5 Japan 4 Tons Per Hectare 3 China 2 1 0 1960 1970 1980 1990 2000 2010 2020 Source: USDA Photo Credit: USDA / Scott Bauer
  • 31. Fertilizer Consumption in Top Five Countries, 1961-2011 60 China 50 Earth Policy Institute - www.earth-policy.org 40 Million Tons India 30 United 20 States Brazil 10 Indonesia 0 1961 1971 1981 1991 2001 2011 2021 Source: IFA Photo Credit: USDA / Scott Bauer
  • 32. Chapter 8 Rising Temperatures, Rising Food Prices Photo Credit: iStockPhoto / jansmarc
  • 33. Atmospheric Carbon Dioxide Concentration, 1000-2011 390 Earth Policy Institute - www.earth-policy.org 370 Parts Per Million by Volume 350 330 310 290 270 250 1000 1100 1200 1300 1400 1500 1600 1700 1800 1900 2000 Source: EPI from Worldwatch; NOAA/ESRL Photo Credit: USDA / Scott Bauer
  • 34. Average Global Temperature, 1880-2011 14.7 14.5 Earth Policy Institute - www.earth-policy.org 14.3 Degrees Celsius 14.1 13.9 13.7 13.5 13.3 1880 1900 1920 1940 1960 1980 2000 2020 Source: NASA GISS Photo Credit: USDA / Scott Bauer
  • 35. Global Carbon Dioxide Emissions from Fossil Fuel Burning by Fuel Type, 1900-2011 4,500 Coal 4,000 Earth Policy Institute - www.earthpolicy.org 3,500 Million Tons of Carbon 3,000 Oil 2,500 2,000 1,500 1,000 Natural Gas 500 0 1900 1920 1940 1960 1980 2000 Source: EPI from CDIAC; BP Photo Credit: USDA / Scott Bauer
  • 36. Chapter 9 China and the Soybean Challenge Photo Credit: Yann Arthus-Bertrand
  • 37. World Soybean Production, 1950-2011 300 250 Earth Policy Institute - www.earth-policy.org 200 Million Tons 150 100 50 0 1950 1960 1970 1980 1990 2000 2010 2020 Source: Worldwatch, USDA Photo Credit: USDA / Scott Bauer
  • 38. Soybean Production, Consumption, and Imports in China, 1964-2011 80 Earth Policy Institute - www.earth-policy.org 70 Consumption 60 50 Million Tons 40 30 Imports 20 10 Production 0 1964 1974 1984 1994 2004 Source: USDA Photo Credit: USDA / Scott Bauer
  • 39. Net Imports of Grain in China, 1960-2011 20 15 Earth Policy Institute - www.earth-policy.org 10 5 Million Tons 0 -5 -10 -15 -20 1960 1965 1970 1975 1980 1985 1990 1995 2000 2005 2010 Source: EPI from USDA Photo Credit: USDA / Scott Bauer
  • 40. Area Harvested for Wheat, Corn, and Soybeans in the Western Hemisphere, 1960-2011 90 Soybeans 80 Earth Policy Institute - www.earth-policy.org 70 Corn Million Hectares 60 50 Wheat 40 30 20 10 0 1960 1970 1980 1990 2000 2010 2020 Source: USDA Photo Credit: USDA / Scott Bauer
  • 41. Chapter 10 The Global Land Rush Photo Credit: iStockPhoto / susoy
  • 42. Large-scale Land Acquisition Area by Target Region, October 2008 – August 2009 Middle East and Latin America and North Africa, 1.9% the Caribbean, 5.7% Europe and Central Asia, 7.6% Southeast Asia, 14.7% Sub-Saharan Africa, 70.1% Total Area: 56.6 million hectares in 203 projects Source: GRAIN data compiled by Deininger and Byerlee (2011) Photo Credit: USDA / Scott Bauer
  • 43. Large-scale Land Acquisitions by Project Type, October 2008 – August 2009 Biofuel Crops 21% Food Crops 37% Industrial, Cash Crops 21% Conservation Reserves, Game Farms, Livestock, Plantation Forestry 21% Total Projects: 405 Source: GRAIN data compiled by Deininger and Byerlee (2011) Photo Credit: USDA / Scott Bauer
  • 44. Chapter 11 Can We Prevent a Food Breakdown? Photo Credit: Yann Arthus-Bertrand
  • 45. Plan B Carbon Dioxide Emissions Reduction Goals for 2020 (Million Tons of Carbon) Earth Policy Institute - www.earth-policy.org Remaining net emissions Replacing fossil 1,680 fuels with renewables for Managing soils to electricity and heat sequester carbon 3,210 600 Planting trees to 860 sequester carbon Restructuring the 1,500 1,400 transport system Ending net Reducing coal and deforestation oil use in industry 100 Baseline Emissions (2006) = 9,350 Million Tons of Carbon Source: EPI Photo Credit: USDA / Scott Bauer
  • 46. To learn more about the global food situation… read Full Planet, Empty Plates: The New Geopolitics of Food Scarcity by Lester R. Brown. The book and supporting data sets are available at www.earth-policy.org