SlideShare uma empresa Scribd logo
1 de 21
Baixar para ler offline
Find out which are the
strongest submarkets!

2013 Puget sound Multifamily rent and Job growth report
sales volume
Sales Volume
$2,500,000,000
$2,000,000,000
$1,500,000,000
$1,000,000,000
$500,000,000
$-

King

2013

Pierce

Snohomish

Puget sound Multifamily rent
and Job growth study
What every apartment investor needs to know about regional rent and job growth

Colliers International Seattle

1
2013 Puget sound Multifamily rent and Job growth report

Nation-Leading Rent & Job Growth
Make Seattle the Darling Market
for Multifamily Investors
As the Puget Sound Region recovers from
the Great Recession, 2013 has proved a
banner year for multifamily investment.
As of the second quarter of 2013, rents
rose a nation-leading 6% year-over-year
compared to a relatively anemic national
average of 2.6%. Stellar rent growth
figures are easily attributable to historically
low vacancy rates, measuring 3.32%
in Seattle by mid-year—a 15-year low,
theoretically a result of pent-up demand.
Arguably, however, a stronger driver is
regional job growth.
In 2013, the Seattle-Bellevue-Everett MSA
continues to post solid job growth. After
having added over 46,500 jobs in 2012, the
region is poised to add nearly 50,000 jobs
in 2013 (as of Q3 2013 year-over-year job
growth figures measured 49,900). With
such a large number of jobs added to the
market, we have seen strong resilience to
supply added to the market (7,200 units
added in the last 12 months and over
14,700 units added to the market since
2011) and sustained rent growth.
A common theory explaining continued
rent growth is more demand for rental
housing. Additionally, higher wage jobs are

EVERETT

increasing price elasticity. From all reports
one may assume that owners of all product
types in all markets are equal benefactors
of this rent growth phenomenon. However,
we know such a general assertion never
proves true. Accordingly, we sought
answers to which markets performed best
and to what job growth factors we could
attribute such success.
The enclosed study analyzes rent growth
trends and job growth statistics in 11 of the
region’s major submarkets during the last
12 years. We provide summary market rent
growth analysis as well as a more granular
look at rent growth performance based
on building size and age. Additionally, we
summarize macro employment trends and
then take a closer look at market-level job
growth. The analysis we provide factors job
growth in absolute numbers, as well as by
industry sector, both of which are helpful in
gaining insight into market behavior.
The following analysis is a starting point to
assist multifamily investors in developing
investment strategies in the Puget Sound
region.
Contact us to further refine your investment
strategies.

LYNNWOOD

BOTHELL

SEATTLE
520

90

KIRKLAND
WEST BELLEVUE
EAST BELLEVUE
ISSAQUAH
RENTON

KENT

FEDERAL WAY

Colliers International Seattle

2
2013 Puget sound Multifamily rent and Job growth report

Year-to-Date Performance
As of Q3 2013, market fundamentals in Puget Sound remain robust and sales activity reflects a strong desire for
placing capital in Puget Sound. A caveat to this statement is the strong focus on core-located, institutional grade
multifamily assets, and as a result just over 59 transactions year-to-date.
In competition for select assets, investors have both driven up pricing and maintained downward pressure on
capitalization rates, somewhat regardless of interest rate increases experienced in July. The result is high priced
sales with even more impressive price-per-unit metrics, yet a smaller impact on total number of transactions.
We anticipate investor activity to even in the coming year as rent growth propagates across more markets and
investors chase yield beyond the core—a phenomenon we have already seen demonstrated in the last quarter.

Number of sales
Number of Sales
200

Sales sales volume
Volume
$2,500,000,000
$2,000,000,000

150

$1,500,000,000

100

$1,000,000,000

50

$500,000,000
$-

0

King

Pierce

Snohomish

King

Pierce

Snohomish
+50 units, Tri-County
Source: Dupre + Scott

Colliers International Seattle

3
2013 Puget sound Multifamily rent and Job growth report

Investment Metrics

Year-to-Date Performance
>  ear-to-date sales are $1.47B, on
Y
track to trail 2012 sales volume
by 20%
 Tri-county unit prices are 14.4%

11
10

Key Indicators
RENTAL RATES
 Regional rental rates increased 6.6% so far this year, 5% when excluding new
developments

2011 and a whopping 53.5% higher
than 2010
 Core Seattle price per square
foot averaged $336/SF, nearly
300% higher than 2009
 Capitalization rates are 5.2% in
King County (-.01% y-o-y), 5.8% in
Snohomish County (-0.3% y-o-y)
and 7.1% in Pierce County (+0.2%
y-o-y)
 Core Seattle capitalization rates
have lifted to 4.6% from 4.4% in

9

 Year-over-year rental rates increased in King County by 7.5%, Snohomish
County by 5.7% and Pierce County by 3.1%

8

higher than 2012, 39.1% higher than

2012

12

 The average apartment unit in downtown Seattle is $1,741, a 5.5% increase over
last year

7
6
5

VACANCY RATES
 Tri-county vacancy rates remain at historical lows, 3.8%, 4.2% and 4.3% in
King, Snohomish and Pierce County, respectively

4

  ing county vacancy rate rose by 0.5% in the last 6 months, yet is 3.0% lower
K
than a market peak vacancy of 6.8% in March 2009

3

 Seattle’s CBD still has one of the lowest vacancy rates in the region at 3.1%

2

DEVELOPMENT PIPELINE
 Over 42,000 units are in the tri-county development pipeline for 2013-2017

1
Source: Dupre + Scott

  9% of all new development is planned for King County
8
  urrently 22,000 units are under construction
C
  ,200 units were delivered in the last 12 months; 7,500 are forecasted for
7
2013—the highest level of deliveries since 1991

Colliers International Seattle

4
2013 Puget sound Multifamily rent and Job growth report

Job Growth and Employment
Seattle Continues to Lead the Nation
The Seattle-Bellevue-Everett MSA continues its trend with
historically high job growth. As of Q3 2013, this MSA added
49,900 jobs year-over-year, demonstrating even greater job
growth than 2012. Lead by job growth in the technology, manufacturing and construction sectors, the story of job growth in
Seattle is the envy of the nation. Seattle has added manufacturing jobs at a rate of 4-times that of the rest of the nation.

Unemployment
10.00%

Notes:

9.00%
8.00%

7.0%

7.00%

6.4%
5.6%

6.00%

year-over-year since
Q3 2012
  onway Pederson
C

5.00%

predicts nearly

4.00%

40,000 new jobs
US

3.00%

added year-over-year

Washington

Seattle/Bellevue/Everett MSA

between 2014-2017

2.00%

Percentage Change in Number of Jobs Since July 2011

 Added 49,900 jobs

2010

2011

2012

2013

Source: U.S. Bureau of Labor Statistics

Construction

Retail trade

Leisure and hospitality

Manufacturing

Seattle

	9.7%
	4.2%
	8.5%
	3.3%
	8.5%
	5.9%
	7.7%
	2.0%

Unemployment
Unemployment numbers in the Seattle region remain a standout in the nation.
Although unemployment ticked up slightly from an anomalously low rate this
summer, an unemployment rate of 5.6% signals a strong economy. As compared to the nation, employment has risen 3.1% year-over-year, nearly doubling
the national average of 1.7%. One of the strongest measures of local employment strength is the return of all 121,900 jobs lost during the Great Recession—
a metric few markets can boast.

U.S.

Source: Labor Department
Colliers International Seattle

5
2013 Puget sound Multifamily rent and Job growth report

Rent Growth in the Region’s Eleven Major Submarkets
SEATTLE

WEST BELLEVUE

27.8%

41.8%

cumulative
rent growth trend

ISSAQUAH	

EAST BELLEVUE

KIRKLAND

26.4%

BOTHELL

28.0%

cumulative
rent growth trend

FEDERAL WAY

cumulative
rent growth trend

cumulative
rent growth trend

RENTON

26.1%

cumulative
rent growth trend

26.1%

31.1%

cumulative
rent growth trend

EVERETT

KENT

cumulative
rent growth trend

31.6%

cumulative
rent growth trend

LYNNWOOD

27.9%

cumulative
rent growth trend

18.6%

cumulative
rent growth trend

29.2%

cumulative
rent growth trend

This summary data indicates cumulative
rent growth in each of the region’s eleven
major submarkets measured over a 12
year period. Data is based on apartments
50 units and greater, built after 1983.
Source: Dupre + Scott

Colliers International Seattle

6
2013 Puget sound Multifamily rent and Job growth report

Employment Growth by Sector in the Region’s Major Submarkets
In an effort to understand market behavior vis-à-vis job growth by industry (and by proxy, income) we provide the following graphs setting
forth job growth in our eleven subject submarkets, highlighting four industry employment sectors: Professional/STEM (scientific, technical,
engineering and mathematics), retail, construction and manufacturing and FIRE (financial services, insurance and real estate). Although
the data sets used do not capture the entire market, they are a representative sample of relative employment trends in each submarket and
illustrate relative trends by industry.
Note:  ll submarket employment statistics drawn from seasonally adjusted Quarterly Census of Employment and Wages (QCEW), the Boeing Company, and the Office
A
of Washington Superintendent of Public Instruction (OSPI), and were compiled by the Puget Sound Regional Council (PSRC). Figures represent number of jobs,
not working persons, and are broken down by major sector per NAICS codes. Data trends marked with a dotted line represents normalizing of data that was
unreported because there were either less than three reporting firms in a sector, or where a single employer represents more than 80 percent of jobs in an
employment code.

SEATTLE

BELLEVUE
Professional/STEM

FIRE

Retail

Construction and Manufacturing

Professional/STEM

100,000

Retail

Construction and Manufacturing

40,000

80,000

35,000

*

70,000
60,000

Total Number of Jobs

Total Job Numbers

FIRE

45,000

90,000

50,000
40,000
30,000
20,000

30,000
25,000
20,000
15,000
10,000

10,000

5,000

0

0

Year

  rofessional/STEM jobs lead the market
P
 On a gross basis, added more technology jobs than any other region measured
 Surprisingly, FIRE jobs sill have not recovered from the Great Recession
 Retail has recovered well, but accounts for lower wage employment

*

This large spike in construction and manufacturing jobs is an accurate depiction of Seattle’s market during this period.

The city built Seahawk stadium, added $190M worth of construction expansion on their Convention Center, built a 520,000
square foot federal courthouse, and constructed the 450-room Elliott Hotel along with additional structures during Seattle’s
36 month construction boom that started in 2000.

Year

 Professional/STEM jobs have had strong growth and were very resilient to the Great

Recession
 All other sectors have trended down over the last decade

Source: Puget Sound Regional Council
Colliers International Seattle

7
2013 Puget sound Multifamily rent and Job growth report

KIRKLAND

ISSAQUAH
Professional/STEM

FIRE

Retail

Construction and Manufacturing

Professional/STEM

FIRE

Retail

Construction and Manufacturing

7,000

3,000

‡

2,500
2,000

†

*

1,500
1,000

Total Number of Jobs

8,000

3,500
Total Number of Jobs

4,000

6,000
5,000
4,000
3,000
2,000
1,000

500

0

0

Year

Year

 This market is very cyclical and remains highly exposed to single-family homebuilding
 Very little growth in FIRE jobs
  rofessional/STEM and Retail job growth are the bright spots with the highest percentage
P
gains

*

 Professional/STEM employment growth leads the market, a healthy Google presence reflected

 Healthy jobs recovery post-Great Recession in all sectors
 FIRE jobs have a consistent 10-year positive trend, marking an increase by 61.5%

D
 ata normalized due to NAICS codes 48  49 not recording in the year 2000.

‡ n 2009-2010 Costco ramped up its online presence and brought hundreds of tech jobs to the Issaquah region. Also, while Microsoft
I

abandoned its plans for an Issaquah campus in late 2006, they still leased space and brought jobs to the city in 2009 and 2010.
† Data estimated due to no available data for NAICS code #51 which was the largest city’s largest Professional/STEM job figure in


preceding years.

LYNNWOOD

BOTHELL
Professional/STEM

FIRE

Retail

Professional/STEM

Construction and Manufacturing

FIRE

Retail

Construction and Manufacturing

9,000

8,000

8,000

7,000

7,000
Total Number of Jobs

Total Number of Jobs

9,000

6,000
5,000
4,000

*

3,000
2,000

6,000
5,000
4,000

*

3,000
2,000

1,000

1,000

0

0

Year
Year

 Retail is king in Lynnwood with one of the largest malls in the region
 Strong upward Professional/STEM job growth trend
 Steady decline in FIRE jobs

 Professional/STEM jobs post fantastic 10-year trend

 Added more construction jobs than any other market measured
 Submarket with the largest overall job growth on a percentage basis

*

*

N
 AICS code #23 did not record in 2001 and 2002, and when it did reappear in 2003 the numbers showed a decline in
Construction and Manufacting employment. The data was normalized in this section to show a gradual decline and not the
steep drop that eliminating NAICS #23 for two straight years would indicate as this had typically been a strong sector for
Lynnwood.

Data normalized due to incomplete recording of NAICS code #32 in the year 2000.


Source: Puget Sound Regional Council
Colliers International Seattle

8
2013 Puget sound Multifamily rent and Job growth report

EVERETT

RENTON
Professional/STEM

FIRE

Retail

Construction and Manufacturing

Professional/STEM

40000
35000

*

30000

Retail

Construction and Manufacturing

25000
20000
15000
10000

25,000
Total Number of Jobs

Total Number of Jobs

FIRE

30,000

45000

5000

20,000

*

15,000
10,000
5,000

0
0

Year
Year

 Aerospace is far-and-away the market driver
 Other employment sectors have little influence on job growth

*

  n a trend basis, Professional/STEM replaced construction and manufacturing jobs
O
  n a percentage basis, highest technical job growth of all markets measured, 116.5%
O
  etail jobs on the decline for nearly a decade
R
  erospace remains a strong, but decreasingly influential market driver
A

Data normalized due to incomplete recording of NAICS code #33 in 2012.

*

FEDERAL WAY

KENT
Professional/STEM

FIRE

Retail

Construction and Manufacturing

Professional/STEM

25,000

FIRE

Retail

Construction and Manufacturing

7,000
6,000
Total Number of Jobs

30,000
Total Number of Jobs

Data estimation due to NAICS code #23 not being recorded in 2012. NAICS #23 made comprised over 14,000 jobs in 2011.


20,000
15,000
10,000
5,000

5,000

*

4,000

‡

3,000
2,000
1,000

0

0

Year

  onstruction and manufacturing, predominantly aerospace related, continue to drive this market
C
 All other jobs sections remain relatively flat

Year

  ob sector cyclicality predominates in this market
J
  etail has suffered over a 10-year trend with the greatest job losses
R

*

Data estimated due to incomplete recording of NAICS code #55 from 2000 – 2008.

‡ 2009 saw significant losses for the Professional/STEM sector as Weyerhaeuser cut 1,000 jobs at their corporate headquarters


and World Vision laid off 1,200 employees across its workforce.

Source: Puget Sound Regional Council
Colliers International Seattle

9
2013 Puget sound Multifamily rent and Job growth report
SEATTLE

12-

WHAT DO THE STATISTICS TELL US?

Seattle
Rent Growth

Seattle experiences strong performance in up-cycles yet is not immune to market downturns.
Interestingly, apartment communities larger than 150 units demonstrated more resilience when
the market turns. Overall, in the measured period, investments in properties built before 2000
exhibited the greatest amount of rent growth, likely due to value-add strategies by investors.

50-150 Units, Built 1983-1999

YEAR

150+ Units, Built 1983-1999
$1,450

$1,500

PROFessional/STEM

$1,350
$1,400

$1,250

$1,300

7.0%

$1,150

$1,200

$1,050

$1,100

$950

Fall '13

Fall '12

Spring '13

Fall '11

Spring '12

Fall '10

Spring '11

Fall '09

Spring '10

Fall '08

Spring '09

Fall '07

Spring '08

Fall '06

Spring '07

Fall '05

Spring '06

Fall '04

Spring 0'5

Fall '03

Spring '04

Fall '02

Spring '03

Fall '01

Spring '02

Fall '13

Fall '12

Spring '13

Fall '11

Spring '12

Fall '10

Spring '11

Fall '09

Spring '10

Fall '08

Spring '09

Fall '07

Spring '08

Fall '06

Spring '07

Fall '05

Spring '06

Fall '04

Spring '05

Fall '03

Spring '04

Fall '02

Spring '03

$750

Fall '01

$850

$900
Spring '02

$1,000

Year-overyear:

Cumulative
rent growth:

3-year
cumulative

10-year
cumulative

Year-overyear:

Cumulative
rent growth:

3-year
cumulative

24%

18%

33%

2.34%

28%

16%

25.6%

10-year
cumulative

6.00%

FIRE

35%

50-150 Units, Built 2000-2013

150+ Units, Built 2000-2013

$1,800
$1,700

$2,300

$1,600

RETAIL

$2,500

$2,100

$1,500

-1.2%

$1,900

$1,400

$1,700

$1,300

$1,500

$1,200

$1,300

Mfg  Construction
Fall '13

Spring '13

Fall '12

Spring '12

Fall '11

Spring '11

Fall '10

Spring '10

Fall '09

Spring '09

Fall '08

Spring '08

Fall '07

Spring '07

Fall '06

Fall '05

Spring '06

Fall '04

Spring '05

Fall '03

Spring '04

Fall '02

Spring '03

Fall '01

Fall '13

Fall '12

Spring '13

Fall '11

Spring '12

Spring '11

Fall '10

Spring '10

Fall '09

Spring '09

Fall '08

Fall '07

Spring '08

Fall '06

Spring '07

Fall '05

Spring '06

Fall '04

Spring '05

Fall '03

Spring '04

Fall '02

Spring '03

Fall '01

Spring '02

Spring '02

$1,100

$1,000

Year-overyear:

Cumulative
rent growth:

3-year
cumulative

10-year
cumulative

Year-overyear:

Cumulative
rent growth:

3-year
cumulative

10-year
cumulative

1.35%

16%

14%

49%

1.55%

19%

14%

-7.5%

19%

Source:
Puget Sound
Regional Council

$1,100

Source: Dupre + Scott
Colliers International Seattle

10
2013 Puget sound Multifamily rent and Job growth report
WHAT DO THE STATISTICS TELL US?

West Bellevue

12-

West Bellevue posted the highest performance in the measured years, with cumulative rent
growth of 41.8%. Newer generation buildings, those built after 2000, of institutional size
(+150u) show the strongest rent growth performance: 83% growth measured by a 10-year
cumulative growth. This measurement is skewed by the addition of new buildings to a relatively
older stock, yet the strength of this performance tops all submarkets measured.

West Bellevue
Rent Growth
50-150 Units, Built 1983-1999

YEAR

150+ Units, Built 1983-1999
$1,700

$1,450

PROFessional/STEM

$1,600

$1,400
$1,350

$1,500

$1,300

9.7%

$1,400

$1,250
$1,200

$1,300

$1,150

$1,200

$1,100
$1,050

$1,100

$1,000

Fall '13

Fall '12

Spring '13

Fall '11

Spring '12

Fall '10

Spring '11

Fall '09

Spring '10

Fall '08

Spring '09

Fall '07

Spring '08

Fall '06

Spring '07

Fall '05

Spring '06

Fall '04

Spring '05

Fall '03

Spring '04

Fall '02

Spring '03

Fall '01

Fall '13

Fall '12

Spring '13

Fall '11

Spring '12

Fall '10

Spring '11

Fall '09

Spring '10

Fall '08

Spring '09

Fall '07

Spring '08

Fall '06

Spring '07

Fall '05

Spring '06

Fall '04

Spring '05

Spring '04

Fall '02

Spring '03

Fall '01

Spring '02

Spring '02

$1,000

$950

Year-overyear:

Cumulative
rent growth:

3-year
cumulative

10-year
cumulative

Year-overyear:

Cumulative
rent growth:

3-year
cumulative

14%

14%

18%

2.28%

27%

20%

-10.0%

10-year
cumulative

1.19%

FIRE

33%

50-150 Units, Built 2000-2013

150+ Units, Built 2000-2013

$2,100

RETAIL

$2,050

$1,900

-14.6%

$1,850

$1,700

$1,650

Year-overyear:

Cumulative
rent growth:

3-year
cumulative

10-year
cumulative

Year-overyear:

Cumulative
rent growth:

3-year
cumulative

10-year
cumulative

2.97%

36%

39%

85%

4.43%

53%

25%

-23.6%

83%

Source:
Puget Sound
Regional Council

Fall '13

Spring '13

Fall '12

Spring '12

Fall '11

Spring '11

Fall '10

Spring '10

Fall '09

Fall '08

Spring '09

Spring '08

Fall '07

Spring '07

Fall '06

Fall '05

Spring '06

Fall '04

Spring '05

Fall '03

Spring '04

Fall '02

Spring '03

Fall '01

Mfg  Construction
Spring '02

Fall '13

Spring '13

Fall '12

Spring '12

Fall '11

Spring '11

Fall '10

Spring '10

Fall '09

Spring '09

Fall '08

Spring '08

Fall '07

Spring '07

Fall '06

Spring '06

Fall '05

Spring '05

Fall '04

$850

Fall '03

$900
Spring '04

$1,050

Fall '02

$1,100

Spring '03

$1,250

Fall '01

$1,450

$1,300

Spring '02

$1,500

Source: Dupre + Scott
Colliers International Seattle

11
2013 Puget sound Multifamily rent and Job growth report
east Bellevue

12-

WHAT DO THE STATISTICS TELL US?

East Bellevue
Rent Growth

Rent growth in East Bellevue fits within the mean of all submarkets measured. Buildings
between 50-150 units suffered to a greater degree during downturns, yet larger, institutional
buildings have performed well during up-markets with a 10-year cumulative rent growth of
48%.

50-150 Units, Built 1983-1999

YEAR

150+ Units, Built 1983-1999
$1,450

$1,500
$1,400

PROFessional/STEM

$1,350

$1,300

$1,250

$1,200

9.7%

$1,150

$1,100

$1,050

Fall '13

Fall '12

Spring '13

Fall '11

Spring '12

Fall '10

Spring '11

Fall '09

Spring '10

Fall '08

Spring '09

Fall '07

Spring '08

Fall '06

Spring '07

Fall '05

Spring '06

Fall '04

Spring 0'5

Fall '03

Spring '04

Fall '02

Spring '03

Fall '01

Spring '02

Fall '13

Fall '12

Spring '13

Fall '11

Spring '12

Fall '10

Spring '11

Fall '09

Spring '10

Fall '08

Spring '09

Fall '07

Spring '08

Fall '06

Spring '07

Fall '05

Spring '06

Fall '04

Spring '05

Fall '03

Spring '04

$750
Fall '02

$800
Spring '03

$850

Fall '01

$950

$900

Spring '02

$1,000

Year-overyear:

Cumulative
rent growth:

3-year
cumulative

10-year
cumulative

Year-overyear:

Cumulative
rent growth:

3-year
cumulative

2%

3%

24%

2.86%

34%

25%

-10.0%

10-year
cumulative

0.14%

FIRE

48%

50-150 Units, Built 2000-2013

150+ Units, Built 2000-2013
RETAIL

-14.6%
NO DATA

Mfg  Construction

23.6%

Source:
Puget Sound
Regional Council

NO DATA

Source: Dupre + Scott
Colliers International Seattle

12
2013 Puget sound Multifamily rent and Job growth report
issaquah

12-

WHAT DO THE STATISTICS TELL US?

Issaquah
Rent Growth

Issaquah’s cumulative rent growth is near the bottom of the pack at 26.4%, yet since 2010
buildings of all sizes and ages continue to post strong rent growth numbers. No particular
building size or age seems to outperform the market in Issaquah as all building types appear to
perform relatively equally during market cycles.

50-150 Units, Built 1983-1999

YEAR

150+ Units, Built 1983-1999
PROFessional/STEM

Fall '13

Fall '12

Spring '13

Fall '11

Spring '12

Fall '10

Spring '11

Fall '09

Spring '10

Fall '08

Spring '09

Fall '07

Spring '08

Fall '06

Spring '07

Fall '05

Spring '06

Fall '04

Spring '05

Fall '03

Spring '04

Fall '02

Spring '03

Fall '01

-59.9%
Spring '02

Fall '13

Fall '12

Spring '13

Fall '11

Spring '12

Fall '10

Spring '11

Fall '09

Spring '10

Fall '08

Spring '09

Fall '07

$900
Spring '08

$800
Fall '06

$1,000

Spring '07

$900

Fall '05

$1,100

Spring '06

$1,000

Fall '04

$1,200

Spring '05

$1,100

Fall '03

$1,300

Spring '04

$1,200

Fall '02

$1,400

Spring '03

$1,300

Fall '01

$1,500

Spring '02

$1,400

Year-overyear:

Cumulative
rent growth:

3-year
cumulative

10-year
cumulative

Year-overyear:

Cumulative
rent growth:

3-year
cumulative

22%

25%

33%

2.00%

24%

18%

44.4%

10-year
cumulative

1.85%

FIRE

32%

50-150 Units, Built 2000-2013

150+ Units, Built 2000-2013
RETAIL

$1,700

$1,600
$1,550

34.3%

$1,600

$1,500
$1,450

$1,500

$1,400
$1,350

$1,400

$1,300

$1,300

$1,250
$1,200

$1,200

Mfg  Construction
Fall '13

Fall '12

Spring '13

Fall '11

Spring '12

Fall '10

Spring '11

Fall '09

Spring '10

Fall '08

Spring '09

Fall 0'7

Spring '08

Fall '06

Spring '07

Fall '05

Spring '06

Fall '04

Spring '05

Fall '03

Spring '04

Fall '02

Spring '03

Fall '01

Spring '02

Fall '13

Spring '13

Fall '12

Spring '12

Fall '11

Spring '11

Fall '10

Spring '10

Fall '09

Spring '09

Fall '08

Spring '08

Fall '06

Spring '07

Fall '05

Spring '06

Spring '05

Fall '04

Spring '04

Fall '03

Spring '03

Fall '01

Fall '02

$1,100

Year-overyear:

Cumulative
rent growth:

3-year
cumulative

10-year
cumulative

Year-overyear:

Cumulative
rent growth:

3-year
cumulative

10-year
cumulative

1.94%

23%

17%

17%

1.44%

17%

14%

108.4%

34%

Source:
Puget Sound
Regional Council

$1,150
$1,100

Source: Dupre + Scott
Colliers International Seattle

13
2013 Puget sound Multifamily rent and Job growth report
kirkland

12-

WHAT DO THE STATISTICS TELL US?

Kirkland
Rent Growth

Kirkland displayed the second highest cumulative rent growth during the sample period, posting
cumulative rent growth of 31.6%. As a relatively new market for new development, we don’t
have a complete data set to analyze; however, the data shows very strong performance of
buildings from 50 – 150 units, which represent the majority of buildings in this tight submarket.

50-150 Units, Built 1983-1999

YEAR

150+ Units, Built 1983-1999

$2,050

$1,600

$1,850

PROFessional/STEM

$1,500

$1,650

26.2%

$1,400

Fall '13

Fall '12

Spring '13

Fall '11

Spring '12

Fall '10

Spring '11

Fall '09

Spring '10

Fall '08

Spring '09

Fall '07

Spring '08

Fall '06

Spring '07

Fall '05

Spring '06

Fall '04

Spring '05

Fall '03

Spring '04

Fall '02

Spring '03

Fall '01

Spring '02

Fall '13

Fall '12

Spring '13

Fall '11

Spring '12

Fall '10

Spring '11

Fall '09

Spring '10

Fall '08

Spring '09

Fall '07

Spring '08

Fall '06

Spring '07

Fall '05

Fall '04

$1,000

Spring '05

$850
Fall '03

$1,100

Spring '04

$1,050

Fall '02

$1,200

Spring '03

$1,250

Fall '01

$1,300

Spring '02

$1,450

Year-overyear:

Cumulative
rent growth:

3-year
cumulative

10-year
cumulative

Year-overyear:

Cumulative
rent growth:

3-year
cumulative

73%

16%

66%

0.54%

6%

28%

61.5%

10-year
cumulative

6.05%

FIRE

16%

50-150 Units, Built 2000-2013

150+ Units, Built 2000-2013
RETAIL

$2,000
$1,900

-19.0%

$1,800
$1,700
$1,600

NO DATA
Fall 2013

Spring 2013

Fall 2012

Spring 2012

Fall 2011

Spring 2011

Fall 2010

Spring 2010

Fall 2009

Spring 2009

Fall 2008

Spring 2008

$1,300

Year-overyear:

Cumulative
rent growth:

3-year
cumulative

10-year
cumulative

0.75%

4%

20%

Mfg  Construction

-35.0%

No Data

Source:
Puget Sound
Regional Council

$1,500
$1,400

* calculated from Spring 2008

Source: Dupre + Scott
Colliers International Seattle

14
2013 Puget sound Multifamily rent and Job growth report
bothell

12-

WHAT DO THE STATISTICS TELL US?

Bothell
Rent Growth

Bothell sits as the 3rd highest rent growth market in the region. Cumulative rent growth for
all building ages and sizes outperforms the market and there is no clear strongest performing
category. Without having data for more modern buildings of institutional size, no comparison
can be drawn to this subset. Overall, Bothell is a high performing submarket.

50-150 Units, Built 1983-1999

YEAR

150+ Units, Built 1983-1999

$1,050

$1,400

$1,000

$1,300

$950

PROFessional/STEM

$1,200

$900

53.9%

$1,100

$850

$1,000

$800

Fall '13

Fall '12

Spring '13

Fall '11

Spring '12

Fall '10

Spring '11

Fall '09

Spring '10

Fall '08

Spring '09

Fall '07

Spring '08

Fall '06

Spring '07

Fall '05

Spring '06

Fall '04

Spring '05

Fall '03

Spring '04

Fall '02

Spring '03

Fall '01

Spring '02

Fall '13

Fall '12

Spring '13

Fall '11

Spring '12

Fall '10

Spring '11

Fall '09

Spring '10

Fall '08

Spring '09

Fall '07

Spring '08

Fall '06

Spring '07

Fall '05

Spring '06

Fall '04

Spring '05

Fall '03

Spring '04

Fall '02

$800

Spring '03

$700

Year-overyear:

Cumulative
rent growth:

3-year
cumulative

10-year
cumulative

Year-overyear:

Cumulative
rent growth:

3-year
cumulative

26%

10%

38%

2.34%

28%

23%

-45.0%

10-year
cumulative

2.15%

FIRE

44%

50-150 Units, Built 2000-2013

150+ Units, Built 2000-2013
RETAIL

$1,450
$1,400

-33.9%

$1,350
$1,300
$1,250

NO DATA

$1,200

Spring '13

Fall '12

Spring '12

Fall '11

Spring '11

Fall '10

Spring '10

Fall '09

Spring '09

$1,150

Year-overyear:

Cumulative
rent growth:

3-year
cumulative

10-year
cumulative

2.10%

8%

14%

Mfg  Construction

242.8%

No Data

Source:
Puget Sound
Regional Council

Fall '01

$900

Spring '02

$750

* calculated from Spring 2009

Source: Dupre + Scott
Colliers International Seattle

15
2013 Puget sound Multifamily rent and Job growth report
lynnwood

Lynnwood
Rent Growth

12-

WHAT DO THE STATISTICS TELL US?

The performance of the Lynnwood market places it within the region’s average for rent growth.
Older buildings have performed well during market up-cycles, yet we have incomplete data to
evaluate the performance of the newer stock of buildings.

50-150 Units, Built 1983-1999

YEAR

150+ Units, Built 1983-1999

$1,050

$1,100
$1,050

$1,000

PROFessional/STEM

$1,000

$950

$950

$900
$850

80.0%

$900
$850
$800

$800

$750

$750

$700

$700

Fall '13

Fall '12

Spring '13

Fall '11

Spring '12

Fall '10

Spring '11

Fall '09

Spring '10

Fall '08

Spring '09

Fall '07

Spring '08

Fall '06

Spring '07

Fall '05

Spring '06

Fall '04

Spring '05

Fall '03

Spring '04

Fall '02

Spring '03

Fall '01

Spring '02

Fall '13

Fall '12

Spring '13

Fall '11

Spring '12

Fall '10

Spring '11

Fall '09

Spring '10

Fall '08

Spring '09

Fall '07

Spring '08

Fall '06

Spring '07

Fall '05

Spring '06

Fall '04

Spring '05

Fall '03

Spring '04

Fall '02

Spring '03

Fall '01

Spring '02

$650

Year-overyear:

Cumulative
rent growth:

3-year
cumulative

10-year
cumulative

Year-overyear:

Cumulative
rent growth:

3-year
cumulative

30%

17%

23%

2.33%

28%

19%

-80.0%

10-year
cumulative

2.51%

FIRE

33%

50-150 Units, Built 2000-2013

150+ Units, Built 2000-2013
RETAIL

$1,370

14.3%

$1,350
$1,330
$1,310

$1,270

Year-overyear:

Cumulative
rent growth:

3.30%

7%

3-year
cumulative

Fall '13

Spring '13

Fall '12

Spring '12

$1,250

10-year
cumulative

Mfg  Construction

-79.9%

No Data No Data

Source:
Puget Sound
Regional Council

NO DATA

$1,290

* calculated from Spring 2012

Source: Dupre + Scott
Colliers International Seattle

16
2013 Puget sound Multifamily rent and Job growth report
everett

12-

WHAT DO THE STATISTICS TELL US?

Everett
Rent Growth

Everett’s cumulative rent growth is 2nd from last in the overall market, tied with Kent.
Historically the market has shown volatility throughout market cycles, yet rent growth in
up-cycles is comparable to market averages. With incomplete data for newer buildings of
institutional size, we are unable to draw comparisons for all building sizes.

50-150 Units, Built 1983-1999

YEAR

150+ Units, Built 1983-1999

$900

$1,050

$850

PROFessional/STEM

$1,000
$950

$800

-10.3%

$900

$750

$850

$700

$800

Fall '13

Fall '12

Spring '13

Fall '11

Spring '12

Fall '10

Spring '11

Fall '09

Spring '10

Fall '08

Spring '09

Fall '07

Spring '08

Fall '06

Spring '07

Fall '05

Spring '06

Fall '04

Spring '05

Fall '03

Spring '04

Fall '02

Spring '03

Fall '01

Spring '02

Fall '13

Fall '12

Spring '13

Fall '11

Spring '12

Fall '10

Spring '11

Fall '09

Spring '10

Fall '08

Spring '09

Fall '07

Spring '08

Fall '06

Spring '07

Fall '05

Spring '06

Fall '04

Spring '05

Fall '03

Spring '04

Fall '02

Spring '03

$700

Fall '01

$750

$600
Spring '02

$650

Year-overyear:

Cumulative
rent growth:

3-year
cumulative

10-year
cumulative

Year-overyear:

Cumulative
rent growth:

3-year
cumulative

30%

10%

38%

2.33%

28%

15%

16.3%

10-year
cumulative

2.51%

FIRE

31%

50-150 Units, Built 2000-2013

150+ Units, Built 2000-2013

$1,075

RETAIL

$1,260
$1,240

$1,025

0.1%

$1,220

$975

$1,200

$925

$1,180
$1,160

$875

$1,140
$1,120

Year-overyear:

Cumulative
rent growth:

3-year
cumulative

10-year
cumulative

3.30%

7%

11%

26%

Source: Dupre + Scott

Mfg  Construction

Year-overyear:

Cumulative
rent growth:

1.03%

12%

3-year
cumulative

Fall '13

Spring '13

$1,100
Spring '12

Fall '13

Fall '12

Spring '13

Fall '11

Spring '12

Spring '11

Fall '10

Spring '10

Fall '09

Spring '09

Fall '07

Spring '08

Fall '06

Spring '07

Fall '05

Spring '06

Fall '04

Spring '05

Spring '04

Fall '03

Fall '02

Fall '01

Spring '02

$775

10-year
cumulative

-85.6%

No Data No Data

Source:
Puget Sound
Regional Council

$825

* calculated from Spring 2012

Colliers International Seattle

17
2013 Puget sound Multifamily rent and Job growth report
renton

12-

WHAT DO THE STATISTICS TELL US?

Renton
Rent Growth

In the analysis of cumulative rent growth, Renton sits near the dead-center of the pack, posting
the 6th highest growth rate. Similar to Everett, the market shows significant volatility throughout
market cycles. Consistent rent growth of newer buildings is hard to predict due to volatility and
older buildings display steadier rent growth trends during up-cycles.

50-150 Units, Built 1983-1999

YEAR

150+ Units, Built 1983-1999

$1,050

$1,150
$1,100

$1,000

PROFessional/STEM

$1,050
$950

$1,000

116.5%

$950

$900

$900

$850

$850
$800

$800
$750

$750

Fall '13

Fall '12

Spring '13

Fall '11

Spring '12

Fall '10

Spring '11

Fall '09

Spring '10

Fall '08

Spring '09

Fall '07

Spring '08

Fall '06

Spring '07

Fall '05

Spring '06

Fall '04

Spring '05

Fall '03

Spring '04

Fall '02

Spring '03

Fall '01

Fall '13

Fall '12

Spring '13

Fall '11

Spring '12

Fall '10

Spring '11

Fall '09

Spring '10

Fall '08

Spring '09

Fall '07

Spring '08

Fall '06

Spring '07

Fall '05

Spring '06

Fall '04

Spring '05

Fall '03

Spring '04

Fall '02

Spring '03

Fall '01

Spring '02

$700

Spring '02

$700

Year-overyear:

Cumulative
rent growth:

3-year
cumulative

10-year
cumulative

Year-overyear:

Cumulative
rent growth:

3-year
cumulative

18%

12%

25%

1.93%

23%

14%

-2.8%

10-year
cumulative

1.52%

FIRE

27%

50-150 Units, Built 2000-2013

150+ Units, Built 2000-2013
RETAIL

$1,550

$1,300

$1,500

$1,250

-32.6%

$1,450

$1,200

$1,400
$1,350

$1,150

$1,300

$1,100

$1,250
$1,200
$1,150
Fall '13

Fall '12

Spring '13

Fall '11

Spring '12

Fall '10

Spring '11

Fall '09

Spring '10

Fall '08

Spring '09

Fall '07

Spring '08

Fall '06

Spring '07

Fall '05

Spring '06

Fall '04

Spring '05

Fall '03

Spring '04

Fall '02

Spring '03

Fall '01

Spring '02

Fall 2013

Fall 2012

Spring 2013

Fall 2011

Spring 2012

Fall 2010

Spring 2011

Spring 2010

Fall 2009

Fall 2008

Spring 2009

Spring 2008

Fall 2007

Spring 2007

Fall 2006

Spring 2006

Fall 2005

Spring 2005

Fall 2004

Spring 2004

Fall 2003

Spring 2003

Fall 2002

Spring 2002

Mfg  Construction

$1,100

Year-overyear:

Cumulative
rent growth:

3-year
cumulative

10-year
cumulative

Year-overyear:

Cumulative
rent growth:

3-year
cumulative

10-year
cumulative

1.18%

14%

1%

18%

0.44%

5%

9%

-85.1%

18%

Source:
Puget Sound
Regional Council

$1,050
$1,000

* calculated from Spring 2002

Source: Dupre + Scott

Colliers International Seattle

18
2013 Puget sound Multifamily rent and Job growth report
Kent

12-

WHAT DO THE STATISTICS TELL US?

Kent
Rent Growth

Interestingly, Kent’s cumulative rent growth sits 2nd from last, tied with Everett. Kent has
experienced relatively steady rent growth over the measured period, yet the amount of actual
dollars added to rent is quite small. Very little in Kent rents for over $1,000/unit, so despite any
rent growth trends, actual rent appreciation remains minimal.

50-150 Units, Built 1983-1999

YEAR

150+ Units, Built 1983-1999

$1,100

$1,000

$1,050

PROFessional/STEM

$950

$1,000

-23.8%

$900

$950
$900

$850

$850

$800

$800
$750

$750

$700

Fall '13

Fall '12

Spring '13

Fall '11

Spring '12

Fall '10

Spring '11

Fall '09

Spring '10

Fall '08

Spring '09

Fall '07

Spring '08

Fall '06

Spring '07

Fall '05

Spring '06

Fall '04

Spring '05

Fall '03

Spring '04

Fall '02

Spring '03

Fall '01

Fall '13

Fall '12

Spring '13

Fall '11

Spring '12

Fall '10

Spring '11

Fall '09

Spring '10

Fall '08

Spring '09

Fall '07

Spring '08

Fall '06

Spring '07

Fall '05

Spring '06

Fall '04

Spring '05

Fall '03

Spring '04

Fall '02

Spring '03

Fall '01

Spring '02

Spring '02

$700

$650

Year-overyear:

Cumulative
rent growth:

3-year
cumulative

10-year
cumulative

Year-overyear:

Cumulative
rent growth:

3-year
cumulative

22%

8%

27%

2.05%

25%

13%

36.7%

10-year
cumulative

1.84%

FIRE

32%

50-150 Units, Built 2000-2013

150+ Units, Built 2000-2013

$1,100

RETAIL

$1,250

1.3%

$1,200

$1,050

$1,150

$1,000

$1,100
$1,050

$950

$1,000

$900

$950

Year-overyear:

Cumulative
rent growth:

3-year
cumulative

10-year
cumulative

1.18%

14%

1%

18%

* calculated from Spring 2002

Fall '13

Spring '13

Fall '12

Spring '12

Fall '11

Fall '10

Spring '11

Fall '09

Spring '10

Spring '09

Fall '08

Spring '08

Fall '07

Fall '06

Spring '07

Spring '06

Fall '05

Spring '05

Fall '04

Spring '04

Fall '13

Fall '12

Spring '13

Spring '12

Fall '11

Spring '11

Spring '10

Fall '09

Spring '09

Spring '08

Fall '07

Spring '07

Fall '06

Spring '05

Fall '03

Spring '04

Spring '03

Fall '02

Spring '02

$850

Year-overyear:

Cumulative
rent growth:

3-year
cumulative

10-year
cumulative

2.38%

21%

18%

1.8%

No Data

Source:
Puget Sound
Regional Council

Mfg  Construction

$900

* calculated from Spring 2004

Source: Dupre + Scott
Colliers International Seattle

19
2013 Puget sound Multifamily rent and Job growth report
WHAT DO THE STATISTICS TELL US?

federal way

12-

Federal Way’s cumulative rent growth can best be described as anemic. It sits dead last in
the market – by a strong margin—and its cumulative rent growth is less than half that of the
top performing market. With little data on new buildings in the market, we cannot draw any
comparisons to older buildings, yet it is safe to say that the overall performance of the market is
very low compared to the region.

Federal Way
Rent Growth
50-150 Units, Built 1983-1999

YEAR

150+ Units, Built 1983-1999
$1,000

PROFessional/STEM

$950

$950
$900

$900

$850

12.3%

$850

$800
$750

$800

$700

$750

Fall 2013

Fall 2012

Spring 2013

Fall 2011

Spring 2012

Fall 2010

Spring 2011

Fall 2009

Spring 2010

Fall 2008

Spring 2009

Fall 2007

Spring 2008

Fall 2006

Spring 2007

Fall 2005

Spring 2006

Fall 2004

Spring 2005

Fall 2003

Spring 2004

Fall 2002

Spring 2003

$700
Fall 2001

Fall '13

Fall '12

Spring '13

Fall '11

Spring '12

Fall '10

Spring '11

Fall '09

Spring '10

Fall '08

Spring 2'9

Fall '07

Spring '08

Fall '06

Spring '07

Fall '05

Spring '06

Fall '04

Spring '05

Fall '03

Spring '04

Fall '02

Spring '03

Fall '01

Spring '02

$600

Spring 2002

$650

Year-overyear:

Cumulative
rent growth:

3-year
cumulative

10-year
cumulative

Year-overyear:

Cumulative
rent growth:

3-year
cumulative

19%

8%

16%

1.54%

18%

7%

21.4%

10-year
cumulative

1.58%

FIRE

21%

50-150 Units, Built 2000-2013

150+ Units, Built 2000-2013
RETAIL

-15.9%
NO DATA

Mfg  Construction

28.1%

Source:
Puget Sound
Regional Council

NO DATA

Source: Dupre + Scott
Colliers International Seattle

20
2013 Puget sound Multifamily rent and Job growth report

About the Author
Dylan Simon

Dylan P. Simon
direct	 206 624 7413
mobile	 206 414 8575
dylan.simon@colliers.com

Dylan Simon specializes in the marketing and sales of urban apartment complexes and developable land.
Having lived in diverse urban centers, Dylan offers clients unique insight into urban development and
high growth opportunities. Additionally, Dylan’s study of regional submarkets and trends positions him to
provide clients the best possible guidance on apartment investment and disposition strategies throughout
the Puget Sound region.

Dave Schumacher
Senior Vice President
direct	 206 382 8555
mobile	 425 985 8528
dave.schumacher@colliers.
com

 Expertise in urban apartment sales  development
 Savvy marketer with deep experience in financial analysis and deal negotiation
 10 years legal experience, J.D. UCLA School of Law

David Mortensen
Senior Associate
direct	 206 382 8554
mobile	 206 604 6118
david.mortensen@colliers.com

 Background in construction management, B.S. Mechanical Engineering
 Active member of ULI, NAIOP  Downtown Seattle Association

Colliers International
601 Union Street, Suite 5300
Seattle, Washington 98101
206 223 0866
www.colliers.com

Colliers Multi-family Team
As experts in the marketing and sale of apartment complexes in Seattle and the Puget Sound region, we take a sharp focus on understanding the
dynamics of our market—especially the trends that impact our clients the most. Our study of rent and job growth provides an essential background in
providing our clients expert guidance to help them shape their investment decisions.
Our team represents over 50 years of combined market experience in the Puget Sound region, brokering apartment transactions totaling over $2 billion
dollars in value. With expertise in market analysis, marketing, sales and negotiation we provide a single source solution to your apartment investment
needs in Puget Sound. Please contact us directly to discuss your investment objectives and we look forward to working with you.

Dave Schumacher

David W. Mortensen

Kate Lee

» 35 years of multifamily sales experience

» 11 years experience in multifamily sales

» Over $2 billion in multifamily
transactions

» Expert in financial and market analysis

» Provides project management support
for all of the team’s marketing and sales
efforts

» Represents buyers/sellers in marketrate apartments, student housing
multifamily land and condominium
conversions.

» Started in multifamily industry with
Holland Residential and was a part
of the Investment Management Team
working on acquisitions and dispositions

» CoStar Power Broker in 2011

» Responsible for providing and tracking
due diligence items

Senior Vice President

» Widely recognized as one of Seattle’s
top apartment brokers
» Strong client relationships with the
leading pension fund advisors, REITs,
and large syndicators as well as high
net worth individuals and families
» Rookie of the Year in his first year
» Remained the top apartment broker
in the Seattle office for most of his 14
year tenure
» 1990 Top CB investment broker in the
country

Senior Associate

» Top 5 Broker in the Colliers Northwest
region
» Technical expertise in apartment value
analysis and tireless marketing efforts
have proven invaluable to his clients

Project Marketing Manager

» This includes obtaining materials for the
brokers, title companies, lenders, and
equity partners
» Creates investment summaries on
potential deals and sales collateral

This document has been prepared by
Colliers International for advertising
and general information only. Colliers
International makes no guarantees,
representations or warranties of any
kind, expressed or implied, regarding
the information including, but not
limited to, warranties of content,
accuracy and reliability. Any interested
party should undertake their own
inquiries as to the accuracy of the
information. Colliers International
excludes unequivocally all inferred
or implied terms, conditions and
warranties arising out of this document
and excludes all liability for loss
and damages arising there from.
This publication is the copyrighted
property of Colliers International and /
or its licensor(s). © 2013. All rights
reserved.

Colliers International Seattle

21

Mais conteúdo relacionado

Último

LCAR Unit 20 - Appraising Real Estate - 14th Edition Revised
LCAR Unit 20 - Appraising Real Estate - 14th Edition RevisedLCAR Unit 20 - Appraising Real Estate - 14th Edition Revised
LCAR Unit 20 - Appraising Real Estate - 14th Edition RevisedTom Blefko
 
Goyal Orchid Life East Bangalore.pdf.pdf
Goyal Orchid Life East Bangalore.pdf.pdfGoyal Orchid Life East Bangalore.pdf.pdf
Goyal Orchid Life East Bangalore.pdf.pdfkratirudram
 
Purva BlueBelle Magadi Road Bangalore.pdf.pdf
Purva BlueBelle Magadi Road Bangalore.pdf.pdfPurva BlueBelle Magadi Road Bangalore.pdf.pdf
Purva BlueBelle Magadi Road Bangalore.pdf.pdfkratirudram
 
Experion Elements Phase 1 Noida E-Brochure
Experion Elements Phase 1 Noida E-BrochureExperion Elements Phase 1 Noida E-Brochure
Experion Elements Phase 1 Noida E-BrochureRealEstate Info
 
Provident Botanico Whitefield E- Brochure.pdf
Provident Botanico Whitefield E- Brochure.pdfProvident Botanico Whitefield E- Brochure.pdf
Provident Botanico Whitefield E- Brochure.pdffaheemali990101
 
Shriram Hebbal One Kempapura Bangalore E- Brochure.pdf
Shriram Hebbal One Kempapura Bangalore E- Brochure.pdfShriram Hebbal One Kempapura Bangalore E- Brochure.pdf
Shriram Hebbal One Kempapura Bangalore E- Brochure.pdffaheemali990101
 
Volition Meetup 2024 03 Mortgages & Interest Rates – Is The Worst Behind Us_ ...
Volition Meetup 2024 03 Mortgages & Interest Rates – Is The Worst Behind Us_ ...Volition Meetup 2024 03 Mortgages & Interest Rates – Is The Worst Behind Us_ ...
Volition Meetup 2024 03 Mortgages & Interest Rates – Is The Worst Behind Us_ ...Volition Properties
 
Honer Richmont Hyderabad E brochure - A Life With A View
Honer Richmont Hyderabad E brochure - A Life With A ViewHoner Richmont Hyderabad E brochure - A Life With A View
Honer Richmont Hyderabad E brochure - A Life With A ViewAhanundefined
 
Listing Turkey - Resim Modern Catalog Istanbul
Listing Turkey - Resim Modern Catalog IstanbulListing Turkey - Resim Modern Catalog Istanbul
Listing Turkey - Resim Modern Catalog IstanbulListing Turkey
 
Seller Seminar Presentation With A Realtor
Seller Seminar  Presentation With A RealtorSeller Seminar  Presentation With A Realtor
Seller Seminar Presentation With A Realtorcarlsbadheather
 
Prestige Sanctuary Nandi Hills Bangalore.pdf
Prestige Sanctuary Nandi Hills Bangalore.pdfPrestige Sanctuary Nandi Hills Bangalore.pdf
Prestige Sanctuary Nandi Hills Bangalore.pdfashiyadav24
 
Listing Turkey Green life Istanbul Eyup Catalog
Listing Turkey Green life Istanbul Eyup CatalogListing Turkey Green life Istanbul Eyup Catalog
Listing Turkey Green life Istanbul Eyup CatalogListing Turkey
 
Prestige Orchards Plots in Shamshabad, Mamidipalli, Hyderabad pdf.pdf
Prestige Orchards Plots in Shamshabad, Mamidipalli, Hyderabad pdf.pdfPrestige Orchards Plots in Shamshabad, Mamidipalli, Hyderabad pdf.pdf
Prestige Orchards Plots in Shamshabad, Mamidipalli, Hyderabad pdf.pdfAhanundefined
 
Mana Dale Kodathi, Sarjapur Road, Bangalore E-Brochure.pdf
Mana Dale Kodathi, Sarjapur Road, Bangalore E-Brochure.pdfMana Dale Kodathi, Sarjapur Road, Bangalore E-Brochure.pdf
Mana Dale Kodathi, Sarjapur Road, Bangalore E-Brochure.pdffaheemali990101
 
Raymond Ten X Era Viviana Mall Thane Brochure.pdf
Raymond Ten X Era Viviana Mall Thane Brochure.pdfRaymond Ten X Era Viviana Mall Thane Brochure.pdf
Raymond Ten X Era Viviana Mall Thane Brochure.pdfPrachiRudram
 
Pride Wonderland Dhanori Pune Brochure.pdf
Pride Wonderland Dhanori Pune Brochure.pdfPride Wonderland Dhanori Pune Brochure.pdf
Pride Wonderland Dhanori Pune Brochure.pdfabbu831446
 
Saheel ITREND Futura At Baner Annexe Pune - PDF.pdf
Saheel ITREND Futura At Baner Annexe Pune - PDF.pdfSaheel ITREND Futura At Baner Annexe Pune - PDF.pdf
Saheel ITREND Futura At Baner Annexe Pune - PDF.pdfmonikasharma630
 
LCAR Unit 19 - Financing the Real Estate Transaction - 14th Edition Revised
LCAR Unit 19 - Financing the Real Estate Transaction - 14th Edition RevisedLCAR Unit 19 - Financing the Real Estate Transaction - 14th Edition Revised
LCAR Unit 19 - Financing the Real Estate Transaction - 14th Edition RevisedTom Blefko
 
Experion Elements Sector 45 Noida E-Brochure
Experion Elements Sector 45 Noida E-BrochureExperion Elements Sector 45 Noida E-Brochure
Experion Elements Sector 45 Noida E-BrochureRealEstate Info
 
Sankla East World Hadapsar Pune Brochure.pdf
Sankla East World Hadapsar Pune Brochure.pdfSankla East World Hadapsar Pune Brochure.pdf
Sankla East World Hadapsar Pune Brochure.pdfabbu831446
 

Último (20)

LCAR Unit 20 - Appraising Real Estate - 14th Edition Revised
LCAR Unit 20 - Appraising Real Estate - 14th Edition RevisedLCAR Unit 20 - Appraising Real Estate - 14th Edition Revised
LCAR Unit 20 - Appraising Real Estate - 14th Edition Revised
 
Goyal Orchid Life East Bangalore.pdf.pdf
Goyal Orchid Life East Bangalore.pdf.pdfGoyal Orchid Life East Bangalore.pdf.pdf
Goyal Orchid Life East Bangalore.pdf.pdf
 
Purva BlueBelle Magadi Road Bangalore.pdf.pdf
Purva BlueBelle Magadi Road Bangalore.pdf.pdfPurva BlueBelle Magadi Road Bangalore.pdf.pdf
Purva BlueBelle Magadi Road Bangalore.pdf.pdf
 
Experion Elements Phase 1 Noida E-Brochure
Experion Elements Phase 1 Noida E-BrochureExperion Elements Phase 1 Noida E-Brochure
Experion Elements Phase 1 Noida E-Brochure
 
Provident Botanico Whitefield E- Brochure.pdf
Provident Botanico Whitefield E- Brochure.pdfProvident Botanico Whitefield E- Brochure.pdf
Provident Botanico Whitefield E- Brochure.pdf
 
Shriram Hebbal One Kempapura Bangalore E- Brochure.pdf
Shriram Hebbal One Kempapura Bangalore E- Brochure.pdfShriram Hebbal One Kempapura Bangalore E- Brochure.pdf
Shriram Hebbal One Kempapura Bangalore E- Brochure.pdf
 
Volition Meetup 2024 03 Mortgages & Interest Rates – Is The Worst Behind Us_ ...
Volition Meetup 2024 03 Mortgages & Interest Rates – Is The Worst Behind Us_ ...Volition Meetup 2024 03 Mortgages & Interest Rates – Is The Worst Behind Us_ ...
Volition Meetup 2024 03 Mortgages & Interest Rates – Is The Worst Behind Us_ ...
 
Honer Richmont Hyderabad E brochure - A Life With A View
Honer Richmont Hyderabad E brochure - A Life With A ViewHoner Richmont Hyderabad E brochure - A Life With A View
Honer Richmont Hyderabad E brochure - A Life With A View
 
Listing Turkey - Resim Modern Catalog Istanbul
Listing Turkey - Resim Modern Catalog IstanbulListing Turkey - Resim Modern Catalog Istanbul
Listing Turkey - Resim Modern Catalog Istanbul
 
Seller Seminar Presentation With A Realtor
Seller Seminar  Presentation With A RealtorSeller Seminar  Presentation With A Realtor
Seller Seminar Presentation With A Realtor
 
Prestige Sanctuary Nandi Hills Bangalore.pdf
Prestige Sanctuary Nandi Hills Bangalore.pdfPrestige Sanctuary Nandi Hills Bangalore.pdf
Prestige Sanctuary Nandi Hills Bangalore.pdf
 
Listing Turkey Green life Istanbul Eyup Catalog
Listing Turkey Green life Istanbul Eyup CatalogListing Turkey Green life Istanbul Eyup Catalog
Listing Turkey Green life Istanbul Eyup Catalog
 
Prestige Orchards Plots in Shamshabad, Mamidipalli, Hyderabad pdf.pdf
Prestige Orchards Plots in Shamshabad, Mamidipalli, Hyderabad pdf.pdfPrestige Orchards Plots in Shamshabad, Mamidipalli, Hyderabad pdf.pdf
Prestige Orchards Plots in Shamshabad, Mamidipalli, Hyderabad pdf.pdf
 
Mana Dale Kodathi, Sarjapur Road, Bangalore E-Brochure.pdf
Mana Dale Kodathi, Sarjapur Road, Bangalore E-Brochure.pdfMana Dale Kodathi, Sarjapur Road, Bangalore E-Brochure.pdf
Mana Dale Kodathi, Sarjapur Road, Bangalore E-Brochure.pdf
 
Raymond Ten X Era Viviana Mall Thane Brochure.pdf
Raymond Ten X Era Viviana Mall Thane Brochure.pdfRaymond Ten X Era Viviana Mall Thane Brochure.pdf
Raymond Ten X Era Viviana Mall Thane Brochure.pdf
 
Pride Wonderland Dhanori Pune Brochure.pdf
Pride Wonderland Dhanori Pune Brochure.pdfPride Wonderland Dhanori Pune Brochure.pdf
Pride Wonderland Dhanori Pune Brochure.pdf
 
Saheel ITREND Futura At Baner Annexe Pune - PDF.pdf
Saheel ITREND Futura At Baner Annexe Pune - PDF.pdfSaheel ITREND Futura At Baner Annexe Pune - PDF.pdf
Saheel ITREND Futura At Baner Annexe Pune - PDF.pdf
 
LCAR Unit 19 - Financing the Real Estate Transaction - 14th Edition Revised
LCAR Unit 19 - Financing the Real Estate Transaction - 14th Edition RevisedLCAR Unit 19 - Financing the Real Estate Transaction - 14th Edition Revised
LCAR Unit 19 - Financing the Real Estate Transaction - 14th Edition Revised
 
Experion Elements Sector 45 Noida E-Brochure
Experion Elements Sector 45 Noida E-BrochureExperion Elements Sector 45 Noida E-Brochure
Experion Elements Sector 45 Noida E-Brochure
 
Sankla East World Hadapsar Pune Brochure.pdf
Sankla East World Hadapsar Pune Brochure.pdfSankla East World Hadapsar Pune Brochure.pdf
Sankla East World Hadapsar Pune Brochure.pdf
 

Destaque

2024 State of Marketing Report – by Hubspot
2024 State of Marketing Report – by Hubspot2024 State of Marketing Report – by Hubspot
2024 State of Marketing Report – by HubspotMarius Sescu
 
Everything You Need To Know About ChatGPT
Everything You Need To Know About ChatGPTEverything You Need To Know About ChatGPT
Everything You Need To Know About ChatGPTExpeed Software
 
Product Design Trends in 2024 | Teenage Engineerings
Product Design Trends in 2024 | Teenage EngineeringsProduct Design Trends in 2024 | Teenage Engineerings
Product Design Trends in 2024 | Teenage EngineeringsPixeldarts
 
How Race, Age and Gender Shape Attitudes Towards Mental Health
How Race, Age and Gender Shape Attitudes Towards Mental HealthHow Race, Age and Gender Shape Attitudes Towards Mental Health
How Race, Age and Gender Shape Attitudes Towards Mental HealthThinkNow
 
AI Trends in Creative Operations 2024 by Artwork Flow.pdf
AI Trends in Creative Operations 2024 by Artwork Flow.pdfAI Trends in Creative Operations 2024 by Artwork Flow.pdf
AI Trends in Creative Operations 2024 by Artwork Flow.pdfmarketingartwork
 
PEPSICO Presentation to CAGNY Conference Feb 2024
PEPSICO Presentation to CAGNY Conference Feb 2024PEPSICO Presentation to CAGNY Conference Feb 2024
PEPSICO Presentation to CAGNY Conference Feb 2024Neil Kimberley
 
Content Methodology: A Best Practices Report (Webinar)
Content Methodology: A Best Practices Report (Webinar)Content Methodology: A Best Practices Report (Webinar)
Content Methodology: A Best Practices Report (Webinar)contently
 
How to Prepare For a Successful Job Search for 2024
How to Prepare For a Successful Job Search for 2024How to Prepare For a Successful Job Search for 2024
How to Prepare For a Successful Job Search for 2024Albert Qian
 
Social Media Marketing Trends 2024 // The Global Indie Insights
Social Media Marketing Trends 2024 // The Global Indie InsightsSocial Media Marketing Trends 2024 // The Global Indie Insights
Social Media Marketing Trends 2024 // The Global Indie InsightsKurio // The Social Media Age(ncy)
 
Trends In Paid Search: Navigating The Digital Landscape In 2024
Trends In Paid Search: Navigating The Digital Landscape In 2024Trends In Paid Search: Navigating The Digital Landscape In 2024
Trends In Paid Search: Navigating The Digital Landscape In 2024Search Engine Journal
 
5 Public speaking tips from TED - Visualized summary
5 Public speaking tips from TED - Visualized summary5 Public speaking tips from TED - Visualized summary
5 Public speaking tips from TED - Visualized summarySpeakerHub
 
ChatGPT and the Future of Work - Clark Boyd
ChatGPT and the Future of Work - Clark Boyd ChatGPT and the Future of Work - Clark Boyd
ChatGPT and the Future of Work - Clark Boyd Clark Boyd
 
Getting into the tech field. what next
Getting into the tech field. what next Getting into the tech field. what next
Getting into the tech field. what next Tessa Mero
 
Google's Just Not That Into You: Understanding Core Updates & Search Intent
Google's Just Not That Into You: Understanding Core Updates & Search IntentGoogle's Just Not That Into You: Understanding Core Updates & Search Intent
Google's Just Not That Into You: Understanding Core Updates & Search IntentLily Ray
 
Time Management & Productivity - Best Practices
Time Management & Productivity -  Best PracticesTime Management & Productivity -  Best Practices
Time Management & Productivity - Best PracticesVit Horky
 
The six step guide to practical project management
The six step guide to practical project managementThe six step guide to practical project management
The six step guide to practical project managementMindGenius
 
Beginners Guide to TikTok for Search - Rachel Pearson - We are Tilt __ Bright...
Beginners Guide to TikTok for Search - Rachel Pearson - We are Tilt __ Bright...Beginners Guide to TikTok for Search - Rachel Pearson - We are Tilt __ Bright...
Beginners Guide to TikTok for Search - Rachel Pearson - We are Tilt __ Bright...RachelPearson36
 

Destaque (20)

2024 State of Marketing Report – by Hubspot
2024 State of Marketing Report – by Hubspot2024 State of Marketing Report – by Hubspot
2024 State of Marketing Report – by Hubspot
 
Everything You Need To Know About ChatGPT
Everything You Need To Know About ChatGPTEverything You Need To Know About ChatGPT
Everything You Need To Know About ChatGPT
 
Product Design Trends in 2024 | Teenage Engineerings
Product Design Trends in 2024 | Teenage EngineeringsProduct Design Trends in 2024 | Teenage Engineerings
Product Design Trends in 2024 | Teenage Engineerings
 
How Race, Age and Gender Shape Attitudes Towards Mental Health
How Race, Age and Gender Shape Attitudes Towards Mental HealthHow Race, Age and Gender Shape Attitudes Towards Mental Health
How Race, Age and Gender Shape Attitudes Towards Mental Health
 
AI Trends in Creative Operations 2024 by Artwork Flow.pdf
AI Trends in Creative Operations 2024 by Artwork Flow.pdfAI Trends in Creative Operations 2024 by Artwork Flow.pdf
AI Trends in Creative Operations 2024 by Artwork Flow.pdf
 
Skeleton Culture Code
Skeleton Culture CodeSkeleton Culture Code
Skeleton Culture Code
 
PEPSICO Presentation to CAGNY Conference Feb 2024
PEPSICO Presentation to CAGNY Conference Feb 2024PEPSICO Presentation to CAGNY Conference Feb 2024
PEPSICO Presentation to CAGNY Conference Feb 2024
 
Content Methodology: A Best Practices Report (Webinar)
Content Methodology: A Best Practices Report (Webinar)Content Methodology: A Best Practices Report (Webinar)
Content Methodology: A Best Practices Report (Webinar)
 
How to Prepare For a Successful Job Search for 2024
How to Prepare For a Successful Job Search for 2024How to Prepare For a Successful Job Search for 2024
How to Prepare For a Successful Job Search for 2024
 
Social Media Marketing Trends 2024 // The Global Indie Insights
Social Media Marketing Trends 2024 // The Global Indie InsightsSocial Media Marketing Trends 2024 // The Global Indie Insights
Social Media Marketing Trends 2024 // The Global Indie Insights
 
Trends In Paid Search: Navigating The Digital Landscape In 2024
Trends In Paid Search: Navigating The Digital Landscape In 2024Trends In Paid Search: Navigating The Digital Landscape In 2024
Trends In Paid Search: Navigating The Digital Landscape In 2024
 
5 Public speaking tips from TED - Visualized summary
5 Public speaking tips from TED - Visualized summary5 Public speaking tips from TED - Visualized summary
5 Public speaking tips from TED - Visualized summary
 
ChatGPT and the Future of Work - Clark Boyd
ChatGPT and the Future of Work - Clark Boyd ChatGPT and the Future of Work - Clark Boyd
ChatGPT and the Future of Work - Clark Boyd
 
Getting into the tech field. what next
Getting into the tech field. what next Getting into the tech field. what next
Getting into the tech field. what next
 
Google's Just Not That Into You: Understanding Core Updates & Search Intent
Google's Just Not That Into You: Understanding Core Updates & Search IntentGoogle's Just Not That Into You: Understanding Core Updates & Search Intent
Google's Just Not That Into You: Understanding Core Updates & Search Intent
 
How to have difficult conversations
How to have difficult conversations How to have difficult conversations
How to have difficult conversations
 
Introduction to Data Science
Introduction to Data ScienceIntroduction to Data Science
Introduction to Data Science
 
Time Management & Productivity - Best Practices
Time Management & Productivity -  Best PracticesTime Management & Productivity -  Best Practices
Time Management & Productivity - Best Practices
 
The six step guide to practical project management
The six step guide to practical project managementThe six step guide to practical project management
The six step guide to practical project management
 
Beginners Guide to TikTok for Search - Rachel Pearson - We are Tilt __ Bright...
Beginners Guide to TikTok for Search - Rachel Pearson - We are Tilt __ Bright...Beginners Guide to TikTok for Search - Rachel Pearson - We are Tilt __ Bright...
Beginners Guide to TikTok for Search - Rachel Pearson - We are Tilt __ Bright...
 

2013 Puget Sound Rent & Job Growth Study

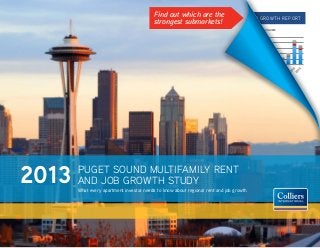
  • 1. Find out which are the strongest submarkets! 2013 Puget sound Multifamily rent and Job growth report sales volume Sales Volume $2,500,000,000 $2,000,000,000 $1,500,000,000 $1,000,000,000 $500,000,000 $- King 2013 Pierce Snohomish Puget sound Multifamily rent and Job growth study What every apartment investor needs to know about regional rent and job growth Colliers International Seattle 1
  • 2. 2013 Puget sound Multifamily rent and Job growth report Nation-Leading Rent & Job Growth Make Seattle the Darling Market for Multifamily Investors As the Puget Sound Region recovers from the Great Recession, 2013 has proved a banner year for multifamily investment. As of the second quarter of 2013, rents rose a nation-leading 6% year-over-year compared to a relatively anemic national average of 2.6%. Stellar rent growth figures are easily attributable to historically low vacancy rates, measuring 3.32% in Seattle by mid-year—a 15-year low, theoretically a result of pent-up demand. Arguably, however, a stronger driver is regional job growth. In 2013, the Seattle-Bellevue-Everett MSA continues to post solid job growth. After having added over 46,500 jobs in 2012, the region is poised to add nearly 50,000 jobs in 2013 (as of Q3 2013 year-over-year job growth figures measured 49,900). With such a large number of jobs added to the market, we have seen strong resilience to supply added to the market (7,200 units added in the last 12 months and over 14,700 units added to the market since 2011) and sustained rent growth. A common theory explaining continued rent growth is more demand for rental housing. Additionally, higher wage jobs are EVERETT increasing price elasticity. From all reports one may assume that owners of all product types in all markets are equal benefactors of this rent growth phenomenon. However, we know such a general assertion never proves true. Accordingly, we sought answers to which markets performed best and to what job growth factors we could attribute such success. The enclosed study analyzes rent growth trends and job growth statistics in 11 of the region’s major submarkets during the last 12 years. We provide summary market rent growth analysis as well as a more granular look at rent growth performance based on building size and age. Additionally, we summarize macro employment trends and then take a closer look at market-level job growth. The analysis we provide factors job growth in absolute numbers, as well as by industry sector, both of which are helpful in gaining insight into market behavior. The following analysis is a starting point to assist multifamily investors in developing investment strategies in the Puget Sound region. Contact us to further refine your investment strategies. LYNNWOOD BOTHELL SEATTLE 520 90 KIRKLAND WEST BELLEVUE EAST BELLEVUE ISSAQUAH RENTON KENT FEDERAL WAY Colliers International Seattle 2
  • 3. 2013 Puget sound Multifamily rent and Job growth report Year-to-Date Performance As of Q3 2013, market fundamentals in Puget Sound remain robust and sales activity reflects a strong desire for placing capital in Puget Sound. A caveat to this statement is the strong focus on core-located, institutional grade multifamily assets, and as a result just over 59 transactions year-to-date. In competition for select assets, investors have both driven up pricing and maintained downward pressure on capitalization rates, somewhat regardless of interest rate increases experienced in July. The result is high priced sales with even more impressive price-per-unit metrics, yet a smaller impact on total number of transactions. We anticipate investor activity to even in the coming year as rent growth propagates across more markets and investors chase yield beyond the core—a phenomenon we have already seen demonstrated in the last quarter. Number of sales Number of Sales 200 Sales sales volume Volume $2,500,000,000 $2,000,000,000 150 $1,500,000,000 100 $1,000,000,000 50 $500,000,000 $- 0 King Pierce Snohomish King Pierce Snohomish +50 units, Tri-County Source: Dupre + Scott Colliers International Seattle 3
  • 4. 2013 Puget sound Multifamily rent and Job growth report Investment Metrics Year-to-Date Performance > ear-to-date sales are $1.47B, on Y track to trail 2012 sales volume by 20% Tri-county unit prices are 14.4% 11 10 Key Indicators RENTAL RATES Regional rental rates increased 6.6% so far this year, 5% when excluding new developments 2011 and a whopping 53.5% higher than 2010 Core Seattle price per square foot averaged $336/SF, nearly 300% higher than 2009 Capitalization rates are 5.2% in King County (-.01% y-o-y), 5.8% in Snohomish County (-0.3% y-o-y) and 7.1% in Pierce County (+0.2% y-o-y) Core Seattle capitalization rates have lifted to 4.6% from 4.4% in 9 Year-over-year rental rates increased in King County by 7.5%, Snohomish County by 5.7% and Pierce County by 3.1% 8 higher than 2012, 39.1% higher than 2012 12 The average apartment unit in downtown Seattle is $1,741, a 5.5% increase over last year 7 6 5 VACANCY RATES Tri-county vacancy rates remain at historical lows, 3.8%, 4.2% and 4.3% in King, Snohomish and Pierce County, respectively 4 ing county vacancy rate rose by 0.5% in the last 6 months, yet is 3.0% lower K than a market peak vacancy of 6.8% in March 2009 3 Seattle’s CBD still has one of the lowest vacancy rates in the region at 3.1% 2 DEVELOPMENT PIPELINE Over 42,000 units are in the tri-county development pipeline for 2013-2017 1 Source: Dupre + Scott 9% of all new development is planned for King County 8 urrently 22,000 units are under construction C ,200 units were delivered in the last 12 months; 7,500 are forecasted for 7 2013—the highest level of deliveries since 1991 Colliers International Seattle 4
  • 5. 2013 Puget sound Multifamily rent and Job growth report Job Growth and Employment Seattle Continues to Lead the Nation The Seattle-Bellevue-Everett MSA continues its trend with historically high job growth. As of Q3 2013, this MSA added 49,900 jobs year-over-year, demonstrating even greater job growth than 2012. Lead by job growth in the technology, manufacturing and construction sectors, the story of job growth in Seattle is the envy of the nation. Seattle has added manufacturing jobs at a rate of 4-times that of the rest of the nation. Unemployment 10.00% Notes: 9.00% 8.00% 7.0% 7.00% 6.4% 5.6% 6.00% year-over-year since Q3 2012 onway Pederson C 5.00% predicts nearly 4.00% 40,000 new jobs US 3.00% added year-over-year Washington Seattle/Bellevue/Everett MSA between 2014-2017 2.00% Percentage Change in Number of Jobs Since July 2011 Added 49,900 jobs 2010 2011 2012 2013 Source: U.S. Bureau of Labor Statistics Construction Retail trade Leisure and hospitality Manufacturing Seattle 9.7% 4.2% 8.5% 3.3% 8.5% 5.9% 7.7% 2.0% Unemployment Unemployment numbers in the Seattle region remain a standout in the nation. Although unemployment ticked up slightly from an anomalously low rate this summer, an unemployment rate of 5.6% signals a strong economy. As compared to the nation, employment has risen 3.1% year-over-year, nearly doubling the national average of 1.7%. One of the strongest measures of local employment strength is the return of all 121,900 jobs lost during the Great Recession— a metric few markets can boast. U.S. Source: Labor Department Colliers International Seattle 5
  • 6. 2013 Puget sound Multifamily rent and Job growth report Rent Growth in the Region’s Eleven Major Submarkets SEATTLE WEST BELLEVUE 27.8% 41.8% cumulative rent growth trend ISSAQUAH EAST BELLEVUE KIRKLAND 26.4% BOTHELL 28.0% cumulative rent growth trend FEDERAL WAY cumulative rent growth trend cumulative rent growth trend RENTON 26.1% cumulative rent growth trend 26.1% 31.1% cumulative rent growth trend EVERETT KENT cumulative rent growth trend 31.6% cumulative rent growth trend LYNNWOOD 27.9% cumulative rent growth trend 18.6% cumulative rent growth trend 29.2% cumulative rent growth trend This summary data indicates cumulative rent growth in each of the region’s eleven major submarkets measured over a 12 year period. Data is based on apartments 50 units and greater, built after 1983. Source: Dupre + Scott Colliers International Seattle 6
  • 7. 2013 Puget sound Multifamily rent and Job growth report Employment Growth by Sector in the Region’s Major Submarkets In an effort to understand market behavior vis-à-vis job growth by industry (and by proxy, income) we provide the following graphs setting forth job growth in our eleven subject submarkets, highlighting four industry employment sectors: Professional/STEM (scientific, technical, engineering and mathematics), retail, construction and manufacturing and FIRE (financial services, insurance and real estate). Although the data sets used do not capture the entire market, they are a representative sample of relative employment trends in each submarket and illustrate relative trends by industry. Note: ll submarket employment statistics drawn from seasonally adjusted Quarterly Census of Employment and Wages (QCEW), the Boeing Company, and the Office A of Washington Superintendent of Public Instruction (OSPI), and were compiled by the Puget Sound Regional Council (PSRC). Figures represent number of jobs, not working persons, and are broken down by major sector per NAICS codes. Data trends marked with a dotted line represents normalizing of data that was unreported because there were either less than three reporting firms in a sector, or where a single employer represents more than 80 percent of jobs in an employment code. SEATTLE BELLEVUE Professional/STEM FIRE Retail Construction and Manufacturing Professional/STEM 100,000 Retail Construction and Manufacturing 40,000 80,000 35,000 * 70,000 60,000 Total Number of Jobs Total Job Numbers FIRE 45,000 90,000 50,000 40,000 30,000 20,000 30,000 25,000 20,000 15,000 10,000 10,000 5,000 0 0 Year rofessional/STEM jobs lead the market P On a gross basis, added more technology jobs than any other region measured Surprisingly, FIRE jobs sill have not recovered from the Great Recession Retail has recovered well, but accounts for lower wage employment * This large spike in construction and manufacturing jobs is an accurate depiction of Seattle’s market during this period. The city built Seahawk stadium, added $190M worth of construction expansion on their Convention Center, built a 520,000 square foot federal courthouse, and constructed the 450-room Elliott Hotel along with additional structures during Seattle’s 36 month construction boom that started in 2000. Year Professional/STEM jobs have had strong growth and were very resilient to the Great Recession All other sectors have trended down over the last decade Source: Puget Sound Regional Council Colliers International Seattle 7
  • 8. 2013 Puget sound Multifamily rent and Job growth report KIRKLAND ISSAQUAH Professional/STEM FIRE Retail Construction and Manufacturing Professional/STEM FIRE Retail Construction and Manufacturing 7,000 3,000 ‡ 2,500 2,000 † * 1,500 1,000 Total Number of Jobs 8,000 3,500 Total Number of Jobs 4,000 6,000 5,000 4,000 3,000 2,000 1,000 500 0 0 Year Year This market is very cyclical and remains highly exposed to single-family homebuilding Very little growth in FIRE jobs rofessional/STEM and Retail job growth are the bright spots with the highest percentage P gains * Professional/STEM employment growth leads the market, a healthy Google presence reflected Healthy jobs recovery post-Great Recession in all sectors FIRE jobs have a consistent 10-year positive trend, marking an increase by 61.5% D ata normalized due to NAICS codes 48 49 not recording in the year 2000. ‡ n 2009-2010 Costco ramped up its online presence and brought hundreds of tech jobs to the Issaquah region. Also, while Microsoft I abandoned its plans for an Issaquah campus in late 2006, they still leased space and brought jobs to the city in 2009 and 2010. † Data estimated due to no available data for NAICS code #51 which was the largest city’s largest Professional/STEM job figure in preceding years. LYNNWOOD BOTHELL Professional/STEM FIRE Retail Professional/STEM Construction and Manufacturing FIRE Retail Construction and Manufacturing 9,000 8,000 8,000 7,000 7,000 Total Number of Jobs Total Number of Jobs 9,000 6,000 5,000 4,000 * 3,000 2,000 6,000 5,000 4,000 * 3,000 2,000 1,000 1,000 0 0 Year Year Retail is king in Lynnwood with one of the largest malls in the region Strong upward Professional/STEM job growth trend Steady decline in FIRE jobs Professional/STEM jobs post fantastic 10-year trend Added more construction jobs than any other market measured Submarket with the largest overall job growth on a percentage basis * * N AICS code #23 did not record in 2001 and 2002, and when it did reappear in 2003 the numbers showed a decline in Construction and Manufacting employment. The data was normalized in this section to show a gradual decline and not the steep drop that eliminating NAICS #23 for two straight years would indicate as this had typically been a strong sector for Lynnwood. Data normalized due to incomplete recording of NAICS code #32 in the year 2000. Source: Puget Sound Regional Council Colliers International Seattle 8
  • 9. 2013 Puget sound Multifamily rent and Job growth report EVERETT RENTON Professional/STEM FIRE Retail Construction and Manufacturing Professional/STEM 40000 35000 * 30000 Retail Construction and Manufacturing 25000 20000 15000 10000 25,000 Total Number of Jobs Total Number of Jobs FIRE 30,000 45000 5000 20,000 * 15,000 10,000 5,000 0 0 Year Year Aerospace is far-and-away the market driver Other employment sectors have little influence on job growth * n a trend basis, Professional/STEM replaced construction and manufacturing jobs O n a percentage basis, highest technical job growth of all markets measured, 116.5% O etail jobs on the decline for nearly a decade R erospace remains a strong, but decreasingly influential market driver A Data normalized due to incomplete recording of NAICS code #33 in 2012. * FEDERAL WAY KENT Professional/STEM FIRE Retail Construction and Manufacturing Professional/STEM 25,000 FIRE Retail Construction and Manufacturing 7,000 6,000 Total Number of Jobs 30,000 Total Number of Jobs Data estimation due to NAICS code #23 not being recorded in 2012. NAICS #23 made comprised over 14,000 jobs in 2011. 20,000 15,000 10,000 5,000 5,000 * 4,000 ‡ 3,000 2,000 1,000 0 0 Year onstruction and manufacturing, predominantly aerospace related, continue to drive this market C All other jobs sections remain relatively flat Year ob sector cyclicality predominates in this market J etail has suffered over a 10-year trend with the greatest job losses R * Data estimated due to incomplete recording of NAICS code #55 from 2000 – 2008. ‡ 2009 saw significant losses for the Professional/STEM sector as Weyerhaeuser cut 1,000 jobs at their corporate headquarters and World Vision laid off 1,200 employees across its workforce. Source: Puget Sound Regional Council Colliers International Seattle 9
  • 10. 2013 Puget sound Multifamily rent and Job growth report SEATTLE 12- WHAT DO THE STATISTICS TELL US? Seattle Rent Growth Seattle experiences strong performance in up-cycles yet is not immune to market downturns. Interestingly, apartment communities larger than 150 units demonstrated more resilience when the market turns. Overall, in the measured period, investments in properties built before 2000 exhibited the greatest amount of rent growth, likely due to value-add strategies by investors. 50-150 Units, Built 1983-1999 YEAR 150+ Units, Built 1983-1999 $1,450 $1,500 PROFessional/STEM $1,350 $1,400 $1,250 $1,300 7.0% $1,150 $1,200 $1,050 $1,100 $950 Fall '13 Fall '12 Spring '13 Fall '11 Spring '12 Fall '10 Spring '11 Fall '09 Spring '10 Fall '08 Spring '09 Fall '07 Spring '08 Fall '06 Spring '07 Fall '05 Spring '06 Fall '04 Spring 0'5 Fall '03 Spring '04 Fall '02 Spring '03 Fall '01 Spring '02 Fall '13 Fall '12 Spring '13 Fall '11 Spring '12 Fall '10 Spring '11 Fall '09 Spring '10 Fall '08 Spring '09 Fall '07 Spring '08 Fall '06 Spring '07 Fall '05 Spring '06 Fall '04 Spring '05 Fall '03 Spring '04 Fall '02 Spring '03 $750 Fall '01 $850 $900 Spring '02 $1,000 Year-overyear: Cumulative rent growth: 3-year cumulative 10-year cumulative Year-overyear: Cumulative rent growth: 3-year cumulative 24% 18% 33% 2.34% 28% 16% 25.6% 10-year cumulative 6.00% FIRE 35% 50-150 Units, Built 2000-2013 150+ Units, Built 2000-2013 $1,800 $1,700 $2,300 $1,600 RETAIL $2,500 $2,100 $1,500 -1.2% $1,900 $1,400 $1,700 $1,300 $1,500 $1,200 $1,300 Mfg Construction Fall '13 Spring '13 Fall '12 Spring '12 Fall '11 Spring '11 Fall '10 Spring '10 Fall '09 Spring '09 Fall '08 Spring '08 Fall '07 Spring '07 Fall '06 Fall '05 Spring '06 Fall '04 Spring '05 Fall '03 Spring '04 Fall '02 Spring '03 Fall '01 Fall '13 Fall '12 Spring '13 Fall '11 Spring '12 Spring '11 Fall '10 Spring '10 Fall '09 Spring '09 Fall '08 Fall '07 Spring '08 Fall '06 Spring '07 Fall '05 Spring '06 Fall '04 Spring '05 Fall '03 Spring '04 Fall '02 Spring '03 Fall '01 Spring '02 Spring '02 $1,100 $1,000 Year-overyear: Cumulative rent growth: 3-year cumulative 10-year cumulative Year-overyear: Cumulative rent growth: 3-year cumulative 10-year cumulative 1.35% 16% 14% 49% 1.55% 19% 14% -7.5% 19% Source: Puget Sound Regional Council $1,100 Source: Dupre + Scott Colliers International Seattle 10
  • 11. 2013 Puget sound Multifamily rent and Job growth report WHAT DO THE STATISTICS TELL US? West Bellevue 12- West Bellevue posted the highest performance in the measured years, with cumulative rent growth of 41.8%. Newer generation buildings, those built after 2000, of institutional size (+150u) show the strongest rent growth performance: 83% growth measured by a 10-year cumulative growth. This measurement is skewed by the addition of new buildings to a relatively older stock, yet the strength of this performance tops all submarkets measured. West Bellevue Rent Growth 50-150 Units, Built 1983-1999 YEAR 150+ Units, Built 1983-1999 $1,700 $1,450 PROFessional/STEM $1,600 $1,400 $1,350 $1,500 $1,300 9.7% $1,400 $1,250 $1,200 $1,300 $1,150 $1,200 $1,100 $1,050 $1,100 $1,000 Fall '13 Fall '12 Spring '13 Fall '11 Spring '12 Fall '10 Spring '11 Fall '09 Spring '10 Fall '08 Spring '09 Fall '07 Spring '08 Fall '06 Spring '07 Fall '05 Spring '06 Fall '04 Spring '05 Fall '03 Spring '04 Fall '02 Spring '03 Fall '01 Fall '13 Fall '12 Spring '13 Fall '11 Spring '12 Fall '10 Spring '11 Fall '09 Spring '10 Fall '08 Spring '09 Fall '07 Spring '08 Fall '06 Spring '07 Fall '05 Spring '06 Fall '04 Spring '05 Spring '04 Fall '02 Spring '03 Fall '01 Spring '02 Spring '02 $1,000 $950 Year-overyear: Cumulative rent growth: 3-year cumulative 10-year cumulative Year-overyear: Cumulative rent growth: 3-year cumulative 14% 14% 18% 2.28% 27% 20% -10.0% 10-year cumulative 1.19% FIRE 33% 50-150 Units, Built 2000-2013 150+ Units, Built 2000-2013 $2,100 RETAIL $2,050 $1,900 -14.6% $1,850 $1,700 $1,650 Year-overyear: Cumulative rent growth: 3-year cumulative 10-year cumulative Year-overyear: Cumulative rent growth: 3-year cumulative 10-year cumulative 2.97% 36% 39% 85% 4.43% 53% 25% -23.6% 83% Source: Puget Sound Regional Council Fall '13 Spring '13 Fall '12 Spring '12 Fall '11 Spring '11 Fall '10 Spring '10 Fall '09 Fall '08 Spring '09 Spring '08 Fall '07 Spring '07 Fall '06 Fall '05 Spring '06 Fall '04 Spring '05 Fall '03 Spring '04 Fall '02 Spring '03 Fall '01 Mfg Construction Spring '02 Fall '13 Spring '13 Fall '12 Spring '12 Fall '11 Spring '11 Fall '10 Spring '10 Fall '09 Spring '09 Fall '08 Spring '08 Fall '07 Spring '07 Fall '06 Spring '06 Fall '05 Spring '05 Fall '04 $850 Fall '03 $900 Spring '04 $1,050 Fall '02 $1,100 Spring '03 $1,250 Fall '01 $1,450 $1,300 Spring '02 $1,500 Source: Dupre + Scott Colliers International Seattle 11
  • 12. 2013 Puget sound Multifamily rent and Job growth report east Bellevue 12- WHAT DO THE STATISTICS TELL US? East Bellevue Rent Growth Rent growth in East Bellevue fits within the mean of all submarkets measured. Buildings between 50-150 units suffered to a greater degree during downturns, yet larger, institutional buildings have performed well during up-markets with a 10-year cumulative rent growth of 48%. 50-150 Units, Built 1983-1999 YEAR 150+ Units, Built 1983-1999 $1,450 $1,500 $1,400 PROFessional/STEM $1,350 $1,300 $1,250 $1,200 9.7% $1,150 $1,100 $1,050 Fall '13 Fall '12 Spring '13 Fall '11 Spring '12 Fall '10 Spring '11 Fall '09 Spring '10 Fall '08 Spring '09 Fall '07 Spring '08 Fall '06 Spring '07 Fall '05 Spring '06 Fall '04 Spring 0'5 Fall '03 Spring '04 Fall '02 Spring '03 Fall '01 Spring '02 Fall '13 Fall '12 Spring '13 Fall '11 Spring '12 Fall '10 Spring '11 Fall '09 Spring '10 Fall '08 Spring '09 Fall '07 Spring '08 Fall '06 Spring '07 Fall '05 Spring '06 Fall '04 Spring '05 Fall '03 Spring '04 $750 Fall '02 $800 Spring '03 $850 Fall '01 $950 $900 Spring '02 $1,000 Year-overyear: Cumulative rent growth: 3-year cumulative 10-year cumulative Year-overyear: Cumulative rent growth: 3-year cumulative 2% 3% 24% 2.86% 34% 25% -10.0% 10-year cumulative 0.14% FIRE 48% 50-150 Units, Built 2000-2013 150+ Units, Built 2000-2013 RETAIL -14.6% NO DATA Mfg Construction 23.6% Source: Puget Sound Regional Council NO DATA Source: Dupre + Scott Colliers International Seattle 12
  • 13. 2013 Puget sound Multifamily rent and Job growth report issaquah 12- WHAT DO THE STATISTICS TELL US? Issaquah Rent Growth Issaquah’s cumulative rent growth is near the bottom of the pack at 26.4%, yet since 2010 buildings of all sizes and ages continue to post strong rent growth numbers. No particular building size or age seems to outperform the market in Issaquah as all building types appear to perform relatively equally during market cycles. 50-150 Units, Built 1983-1999 YEAR 150+ Units, Built 1983-1999 PROFessional/STEM Fall '13 Fall '12 Spring '13 Fall '11 Spring '12 Fall '10 Spring '11 Fall '09 Spring '10 Fall '08 Spring '09 Fall '07 Spring '08 Fall '06 Spring '07 Fall '05 Spring '06 Fall '04 Spring '05 Fall '03 Spring '04 Fall '02 Spring '03 Fall '01 -59.9% Spring '02 Fall '13 Fall '12 Spring '13 Fall '11 Spring '12 Fall '10 Spring '11 Fall '09 Spring '10 Fall '08 Spring '09 Fall '07 $900 Spring '08 $800 Fall '06 $1,000 Spring '07 $900 Fall '05 $1,100 Spring '06 $1,000 Fall '04 $1,200 Spring '05 $1,100 Fall '03 $1,300 Spring '04 $1,200 Fall '02 $1,400 Spring '03 $1,300 Fall '01 $1,500 Spring '02 $1,400 Year-overyear: Cumulative rent growth: 3-year cumulative 10-year cumulative Year-overyear: Cumulative rent growth: 3-year cumulative 22% 25% 33% 2.00% 24% 18% 44.4% 10-year cumulative 1.85% FIRE 32% 50-150 Units, Built 2000-2013 150+ Units, Built 2000-2013 RETAIL $1,700 $1,600 $1,550 34.3% $1,600 $1,500 $1,450 $1,500 $1,400 $1,350 $1,400 $1,300 $1,300 $1,250 $1,200 $1,200 Mfg Construction Fall '13 Fall '12 Spring '13 Fall '11 Spring '12 Fall '10 Spring '11 Fall '09 Spring '10 Fall '08 Spring '09 Fall 0'7 Spring '08 Fall '06 Spring '07 Fall '05 Spring '06 Fall '04 Spring '05 Fall '03 Spring '04 Fall '02 Spring '03 Fall '01 Spring '02 Fall '13 Spring '13 Fall '12 Spring '12 Fall '11 Spring '11 Fall '10 Spring '10 Fall '09 Spring '09 Fall '08 Spring '08 Fall '06 Spring '07 Fall '05 Spring '06 Spring '05 Fall '04 Spring '04 Fall '03 Spring '03 Fall '01 Fall '02 $1,100 Year-overyear: Cumulative rent growth: 3-year cumulative 10-year cumulative Year-overyear: Cumulative rent growth: 3-year cumulative 10-year cumulative 1.94% 23% 17% 17% 1.44% 17% 14% 108.4% 34% Source: Puget Sound Regional Council $1,150 $1,100 Source: Dupre + Scott Colliers International Seattle 13
  • 14. 2013 Puget sound Multifamily rent and Job growth report kirkland 12- WHAT DO THE STATISTICS TELL US? Kirkland Rent Growth Kirkland displayed the second highest cumulative rent growth during the sample period, posting cumulative rent growth of 31.6%. As a relatively new market for new development, we don’t have a complete data set to analyze; however, the data shows very strong performance of buildings from 50 – 150 units, which represent the majority of buildings in this tight submarket. 50-150 Units, Built 1983-1999 YEAR 150+ Units, Built 1983-1999 $2,050 $1,600 $1,850 PROFessional/STEM $1,500 $1,650 26.2% $1,400 Fall '13 Fall '12 Spring '13 Fall '11 Spring '12 Fall '10 Spring '11 Fall '09 Spring '10 Fall '08 Spring '09 Fall '07 Spring '08 Fall '06 Spring '07 Fall '05 Spring '06 Fall '04 Spring '05 Fall '03 Spring '04 Fall '02 Spring '03 Fall '01 Spring '02 Fall '13 Fall '12 Spring '13 Fall '11 Spring '12 Fall '10 Spring '11 Fall '09 Spring '10 Fall '08 Spring '09 Fall '07 Spring '08 Fall '06 Spring '07 Fall '05 Fall '04 $1,000 Spring '05 $850 Fall '03 $1,100 Spring '04 $1,050 Fall '02 $1,200 Spring '03 $1,250 Fall '01 $1,300 Spring '02 $1,450 Year-overyear: Cumulative rent growth: 3-year cumulative 10-year cumulative Year-overyear: Cumulative rent growth: 3-year cumulative 73% 16% 66% 0.54% 6% 28% 61.5% 10-year cumulative 6.05% FIRE 16% 50-150 Units, Built 2000-2013 150+ Units, Built 2000-2013 RETAIL $2,000 $1,900 -19.0% $1,800 $1,700 $1,600 NO DATA Fall 2013 Spring 2013 Fall 2012 Spring 2012 Fall 2011 Spring 2011 Fall 2010 Spring 2010 Fall 2009 Spring 2009 Fall 2008 Spring 2008 $1,300 Year-overyear: Cumulative rent growth: 3-year cumulative 10-year cumulative 0.75% 4% 20% Mfg Construction -35.0% No Data Source: Puget Sound Regional Council $1,500 $1,400 * calculated from Spring 2008 Source: Dupre + Scott Colliers International Seattle 14
  • 15. 2013 Puget sound Multifamily rent and Job growth report bothell 12- WHAT DO THE STATISTICS TELL US? Bothell Rent Growth Bothell sits as the 3rd highest rent growth market in the region. Cumulative rent growth for all building ages and sizes outperforms the market and there is no clear strongest performing category. Without having data for more modern buildings of institutional size, no comparison can be drawn to this subset. Overall, Bothell is a high performing submarket. 50-150 Units, Built 1983-1999 YEAR 150+ Units, Built 1983-1999 $1,050 $1,400 $1,000 $1,300 $950 PROFessional/STEM $1,200 $900 53.9% $1,100 $850 $1,000 $800 Fall '13 Fall '12 Spring '13 Fall '11 Spring '12 Fall '10 Spring '11 Fall '09 Spring '10 Fall '08 Spring '09 Fall '07 Spring '08 Fall '06 Spring '07 Fall '05 Spring '06 Fall '04 Spring '05 Fall '03 Spring '04 Fall '02 Spring '03 Fall '01 Spring '02 Fall '13 Fall '12 Spring '13 Fall '11 Spring '12 Fall '10 Spring '11 Fall '09 Spring '10 Fall '08 Spring '09 Fall '07 Spring '08 Fall '06 Spring '07 Fall '05 Spring '06 Fall '04 Spring '05 Fall '03 Spring '04 Fall '02 $800 Spring '03 $700 Year-overyear: Cumulative rent growth: 3-year cumulative 10-year cumulative Year-overyear: Cumulative rent growth: 3-year cumulative 26% 10% 38% 2.34% 28% 23% -45.0% 10-year cumulative 2.15% FIRE 44% 50-150 Units, Built 2000-2013 150+ Units, Built 2000-2013 RETAIL $1,450 $1,400 -33.9% $1,350 $1,300 $1,250 NO DATA $1,200 Spring '13 Fall '12 Spring '12 Fall '11 Spring '11 Fall '10 Spring '10 Fall '09 Spring '09 $1,150 Year-overyear: Cumulative rent growth: 3-year cumulative 10-year cumulative 2.10% 8% 14% Mfg Construction 242.8% No Data Source: Puget Sound Regional Council Fall '01 $900 Spring '02 $750 * calculated from Spring 2009 Source: Dupre + Scott Colliers International Seattle 15
  • 16. 2013 Puget sound Multifamily rent and Job growth report lynnwood Lynnwood Rent Growth 12- WHAT DO THE STATISTICS TELL US? The performance of the Lynnwood market places it within the region’s average for rent growth. Older buildings have performed well during market up-cycles, yet we have incomplete data to evaluate the performance of the newer stock of buildings. 50-150 Units, Built 1983-1999 YEAR 150+ Units, Built 1983-1999 $1,050 $1,100 $1,050 $1,000 PROFessional/STEM $1,000 $950 $950 $900 $850 80.0% $900 $850 $800 $800 $750 $750 $700 $700 Fall '13 Fall '12 Spring '13 Fall '11 Spring '12 Fall '10 Spring '11 Fall '09 Spring '10 Fall '08 Spring '09 Fall '07 Spring '08 Fall '06 Spring '07 Fall '05 Spring '06 Fall '04 Spring '05 Fall '03 Spring '04 Fall '02 Spring '03 Fall '01 Spring '02 Fall '13 Fall '12 Spring '13 Fall '11 Spring '12 Fall '10 Spring '11 Fall '09 Spring '10 Fall '08 Spring '09 Fall '07 Spring '08 Fall '06 Spring '07 Fall '05 Spring '06 Fall '04 Spring '05 Fall '03 Spring '04 Fall '02 Spring '03 Fall '01 Spring '02 $650 Year-overyear: Cumulative rent growth: 3-year cumulative 10-year cumulative Year-overyear: Cumulative rent growth: 3-year cumulative 30% 17% 23% 2.33% 28% 19% -80.0% 10-year cumulative 2.51% FIRE 33% 50-150 Units, Built 2000-2013 150+ Units, Built 2000-2013 RETAIL $1,370 14.3% $1,350 $1,330 $1,310 $1,270 Year-overyear: Cumulative rent growth: 3.30% 7% 3-year cumulative Fall '13 Spring '13 Fall '12 Spring '12 $1,250 10-year cumulative Mfg Construction -79.9% No Data No Data Source: Puget Sound Regional Council NO DATA $1,290 * calculated from Spring 2012 Source: Dupre + Scott Colliers International Seattle 16
  • 17. 2013 Puget sound Multifamily rent and Job growth report everett 12- WHAT DO THE STATISTICS TELL US? Everett Rent Growth Everett’s cumulative rent growth is 2nd from last in the overall market, tied with Kent. Historically the market has shown volatility throughout market cycles, yet rent growth in up-cycles is comparable to market averages. With incomplete data for newer buildings of institutional size, we are unable to draw comparisons for all building sizes. 50-150 Units, Built 1983-1999 YEAR 150+ Units, Built 1983-1999 $900 $1,050 $850 PROFessional/STEM $1,000 $950 $800 -10.3% $900 $750 $850 $700 $800 Fall '13 Fall '12 Spring '13 Fall '11 Spring '12 Fall '10 Spring '11 Fall '09 Spring '10 Fall '08 Spring '09 Fall '07 Spring '08 Fall '06 Spring '07 Fall '05 Spring '06 Fall '04 Spring '05 Fall '03 Spring '04 Fall '02 Spring '03 Fall '01 Spring '02 Fall '13 Fall '12 Spring '13 Fall '11 Spring '12 Fall '10 Spring '11 Fall '09 Spring '10 Fall '08 Spring '09 Fall '07 Spring '08 Fall '06 Spring '07 Fall '05 Spring '06 Fall '04 Spring '05 Fall '03 Spring '04 Fall '02 Spring '03 $700 Fall '01 $750 $600 Spring '02 $650 Year-overyear: Cumulative rent growth: 3-year cumulative 10-year cumulative Year-overyear: Cumulative rent growth: 3-year cumulative 30% 10% 38% 2.33% 28% 15% 16.3% 10-year cumulative 2.51% FIRE 31% 50-150 Units, Built 2000-2013 150+ Units, Built 2000-2013 $1,075 RETAIL $1,260 $1,240 $1,025 0.1% $1,220 $975 $1,200 $925 $1,180 $1,160 $875 $1,140 $1,120 Year-overyear: Cumulative rent growth: 3-year cumulative 10-year cumulative 3.30% 7% 11% 26% Source: Dupre + Scott Mfg Construction Year-overyear: Cumulative rent growth: 1.03% 12% 3-year cumulative Fall '13 Spring '13 $1,100 Spring '12 Fall '13 Fall '12 Spring '13 Fall '11 Spring '12 Spring '11 Fall '10 Spring '10 Fall '09 Spring '09 Fall '07 Spring '08 Fall '06 Spring '07 Fall '05 Spring '06 Fall '04 Spring '05 Spring '04 Fall '03 Fall '02 Fall '01 Spring '02 $775 10-year cumulative -85.6% No Data No Data Source: Puget Sound Regional Council $825 * calculated from Spring 2012 Colliers International Seattle 17
  • 18. 2013 Puget sound Multifamily rent and Job growth report renton 12- WHAT DO THE STATISTICS TELL US? Renton Rent Growth In the analysis of cumulative rent growth, Renton sits near the dead-center of the pack, posting the 6th highest growth rate. Similar to Everett, the market shows significant volatility throughout market cycles. Consistent rent growth of newer buildings is hard to predict due to volatility and older buildings display steadier rent growth trends during up-cycles. 50-150 Units, Built 1983-1999 YEAR 150+ Units, Built 1983-1999 $1,050 $1,150 $1,100 $1,000 PROFessional/STEM $1,050 $950 $1,000 116.5% $950 $900 $900 $850 $850 $800 $800 $750 $750 Fall '13 Fall '12 Spring '13 Fall '11 Spring '12 Fall '10 Spring '11 Fall '09 Spring '10 Fall '08 Spring '09 Fall '07 Spring '08 Fall '06 Spring '07 Fall '05 Spring '06 Fall '04 Spring '05 Fall '03 Spring '04 Fall '02 Spring '03 Fall '01 Fall '13 Fall '12 Spring '13 Fall '11 Spring '12 Fall '10 Spring '11 Fall '09 Spring '10 Fall '08 Spring '09 Fall '07 Spring '08 Fall '06 Spring '07 Fall '05 Spring '06 Fall '04 Spring '05 Fall '03 Spring '04 Fall '02 Spring '03 Fall '01 Spring '02 $700 Spring '02 $700 Year-overyear: Cumulative rent growth: 3-year cumulative 10-year cumulative Year-overyear: Cumulative rent growth: 3-year cumulative 18% 12% 25% 1.93% 23% 14% -2.8% 10-year cumulative 1.52% FIRE 27% 50-150 Units, Built 2000-2013 150+ Units, Built 2000-2013 RETAIL $1,550 $1,300 $1,500 $1,250 -32.6% $1,450 $1,200 $1,400 $1,350 $1,150 $1,300 $1,100 $1,250 $1,200 $1,150 Fall '13 Fall '12 Spring '13 Fall '11 Spring '12 Fall '10 Spring '11 Fall '09 Spring '10 Fall '08 Spring '09 Fall '07 Spring '08 Fall '06 Spring '07 Fall '05 Spring '06 Fall '04 Spring '05 Fall '03 Spring '04 Fall '02 Spring '03 Fall '01 Spring '02 Fall 2013 Fall 2012 Spring 2013 Fall 2011 Spring 2012 Fall 2010 Spring 2011 Spring 2010 Fall 2009 Fall 2008 Spring 2009 Spring 2008 Fall 2007 Spring 2007 Fall 2006 Spring 2006 Fall 2005 Spring 2005 Fall 2004 Spring 2004 Fall 2003 Spring 2003 Fall 2002 Spring 2002 Mfg Construction $1,100 Year-overyear: Cumulative rent growth: 3-year cumulative 10-year cumulative Year-overyear: Cumulative rent growth: 3-year cumulative 10-year cumulative 1.18% 14% 1% 18% 0.44% 5% 9% -85.1% 18% Source: Puget Sound Regional Council $1,050 $1,000 * calculated from Spring 2002 Source: Dupre + Scott Colliers International Seattle 18
  • 19. 2013 Puget sound Multifamily rent and Job growth report Kent 12- WHAT DO THE STATISTICS TELL US? Kent Rent Growth Interestingly, Kent’s cumulative rent growth sits 2nd from last, tied with Everett. Kent has experienced relatively steady rent growth over the measured period, yet the amount of actual dollars added to rent is quite small. Very little in Kent rents for over $1,000/unit, so despite any rent growth trends, actual rent appreciation remains minimal. 50-150 Units, Built 1983-1999 YEAR 150+ Units, Built 1983-1999 $1,100 $1,000 $1,050 PROFessional/STEM $950 $1,000 -23.8% $900 $950 $900 $850 $850 $800 $800 $750 $750 $700 Fall '13 Fall '12 Spring '13 Fall '11 Spring '12 Fall '10 Spring '11 Fall '09 Spring '10 Fall '08 Spring '09 Fall '07 Spring '08 Fall '06 Spring '07 Fall '05 Spring '06 Fall '04 Spring '05 Fall '03 Spring '04 Fall '02 Spring '03 Fall '01 Fall '13 Fall '12 Spring '13 Fall '11 Spring '12 Fall '10 Spring '11 Fall '09 Spring '10 Fall '08 Spring '09 Fall '07 Spring '08 Fall '06 Spring '07 Fall '05 Spring '06 Fall '04 Spring '05 Fall '03 Spring '04 Fall '02 Spring '03 Fall '01 Spring '02 Spring '02 $700 $650 Year-overyear: Cumulative rent growth: 3-year cumulative 10-year cumulative Year-overyear: Cumulative rent growth: 3-year cumulative 22% 8% 27% 2.05% 25% 13% 36.7% 10-year cumulative 1.84% FIRE 32% 50-150 Units, Built 2000-2013 150+ Units, Built 2000-2013 $1,100 RETAIL $1,250 1.3% $1,200 $1,050 $1,150 $1,000 $1,100 $1,050 $950 $1,000 $900 $950 Year-overyear: Cumulative rent growth: 3-year cumulative 10-year cumulative 1.18% 14% 1% 18% * calculated from Spring 2002 Fall '13 Spring '13 Fall '12 Spring '12 Fall '11 Fall '10 Spring '11 Fall '09 Spring '10 Spring '09 Fall '08 Spring '08 Fall '07 Fall '06 Spring '07 Spring '06 Fall '05 Spring '05 Fall '04 Spring '04 Fall '13 Fall '12 Spring '13 Spring '12 Fall '11 Spring '11 Spring '10 Fall '09 Spring '09 Spring '08 Fall '07 Spring '07 Fall '06 Spring '05 Fall '03 Spring '04 Spring '03 Fall '02 Spring '02 $850 Year-overyear: Cumulative rent growth: 3-year cumulative 10-year cumulative 2.38% 21% 18% 1.8% No Data Source: Puget Sound Regional Council Mfg Construction $900 * calculated from Spring 2004 Source: Dupre + Scott Colliers International Seattle 19
  • 20. 2013 Puget sound Multifamily rent and Job growth report WHAT DO THE STATISTICS TELL US? federal way 12- Federal Way’s cumulative rent growth can best be described as anemic. It sits dead last in the market – by a strong margin—and its cumulative rent growth is less than half that of the top performing market. With little data on new buildings in the market, we cannot draw any comparisons to older buildings, yet it is safe to say that the overall performance of the market is very low compared to the region. Federal Way Rent Growth 50-150 Units, Built 1983-1999 YEAR 150+ Units, Built 1983-1999 $1,000 PROFessional/STEM $950 $950 $900 $900 $850 12.3% $850 $800 $750 $800 $700 $750 Fall 2013 Fall 2012 Spring 2013 Fall 2011 Spring 2012 Fall 2010 Spring 2011 Fall 2009 Spring 2010 Fall 2008 Spring 2009 Fall 2007 Spring 2008 Fall 2006 Spring 2007 Fall 2005 Spring 2006 Fall 2004 Spring 2005 Fall 2003 Spring 2004 Fall 2002 Spring 2003 $700 Fall 2001 Fall '13 Fall '12 Spring '13 Fall '11 Spring '12 Fall '10 Spring '11 Fall '09 Spring '10 Fall '08 Spring 2'9 Fall '07 Spring '08 Fall '06 Spring '07 Fall '05 Spring '06 Fall '04 Spring '05 Fall '03 Spring '04 Fall '02 Spring '03 Fall '01 Spring '02 $600 Spring 2002 $650 Year-overyear: Cumulative rent growth: 3-year cumulative 10-year cumulative Year-overyear: Cumulative rent growth: 3-year cumulative 19% 8% 16% 1.54% 18% 7% 21.4% 10-year cumulative 1.58% FIRE 21% 50-150 Units, Built 2000-2013 150+ Units, Built 2000-2013 RETAIL -15.9% NO DATA Mfg Construction 28.1% Source: Puget Sound Regional Council NO DATA Source: Dupre + Scott Colliers International Seattle 20
  • 21. 2013 Puget sound Multifamily rent and Job growth report About the Author Dylan Simon Dylan P. Simon direct 206 624 7413 mobile 206 414 8575 dylan.simon@colliers.com Dylan Simon specializes in the marketing and sales of urban apartment complexes and developable land. Having lived in diverse urban centers, Dylan offers clients unique insight into urban development and high growth opportunities. Additionally, Dylan’s study of regional submarkets and trends positions him to provide clients the best possible guidance on apartment investment and disposition strategies throughout the Puget Sound region. Dave Schumacher Senior Vice President direct 206 382 8555 mobile 425 985 8528 dave.schumacher@colliers. com Expertise in urban apartment sales development Savvy marketer with deep experience in financial analysis and deal negotiation 10 years legal experience, J.D. UCLA School of Law David Mortensen Senior Associate direct 206 382 8554 mobile 206 604 6118 david.mortensen@colliers.com Background in construction management, B.S. Mechanical Engineering Active member of ULI, NAIOP Downtown Seattle Association Colliers International 601 Union Street, Suite 5300 Seattle, Washington 98101 206 223 0866 www.colliers.com Colliers Multi-family Team As experts in the marketing and sale of apartment complexes in Seattle and the Puget Sound region, we take a sharp focus on understanding the dynamics of our market—especially the trends that impact our clients the most. Our study of rent and job growth provides an essential background in providing our clients expert guidance to help them shape their investment decisions. Our team represents over 50 years of combined market experience in the Puget Sound region, brokering apartment transactions totaling over $2 billion dollars in value. With expertise in market analysis, marketing, sales and negotiation we provide a single source solution to your apartment investment needs in Puget Sound. Please contact us directly to discuss your investment objectives and we look forward to working with you. Dave Schumacher David W. Mortensen Kate Lee » 35 years of multifamily sales experience » 11 years experience in multifamily sales » Over $2 billion in multifamily transactions » Expert in financial and market analysis » Provides project management support for all of the team’s marketing and sales efforts » Represents buyers/sellers in marketrate apartments, student housing multifamily land and condominium conversions. » Started in multifamily industry with Holland Residential and was a part of the Investment Management Team working on acquisitions and dispositions » CoStar Power Broker in 2011 » Responsible for providing and tracking due diligence items Senior Vice President » Widely recognized as one of Seattle’s top apartment brokers » Strong client relationships with the leading pension fund advisors, REITs, and large syndicators as well as high net worth individuals and families » Rookie of the Year in his first year » Remained the top apartment broker in the Seattle office for most of his 14 year tenure » 1990 Top CB investment broker in the country Senior Associate » Top 5 Broker in the Colliers Northwest region » Technical expertise in apartment value analysis and tireless marketing efforts have proven invaluable to his clients Project Marketing Manager » This includes obtaining materials for the brokers, title companies, lenders, and equity partners » Creates investment summaries on potential deals and sales collateral This document has been prepared by Colliers International for advertising and general information only. Colliers International makes no guarantees, representations or warranties of any kind, expressed or implied, regarding the information including, but not limited to, warranties of content, accuracy and reliability. Any interested party should undertake their own inquiries as to the accuracy of the information. Colliers International excludes unequivocally all inferred or implied terms, conditions and warranties arising out of this document and excludes all liability for loss and damages arising there from. This publication is the copyrighted property of Colliers International and / or its licensor(s). © 2013. All rights reserved. Colliers International Seattle 21