

Recomendados
Recomendados
Mais conteúdo relacionado
Mais procurados
Mais procurados (19)
Semelhante a Mf+recommendations
Semelhante a Mf+recommendations (20)
Mais de dvwealth
Mais de dvwealth (14)
Último
Último (20)
Mf+recommendations
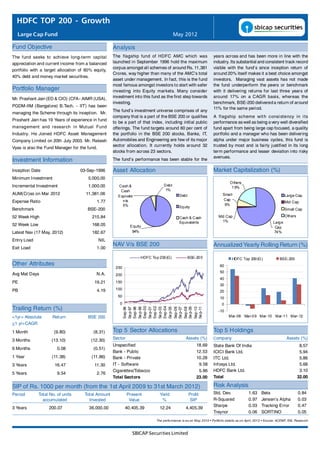
- 1. HDFC TOP 200 - Growth Large Cap Fund May 2012 Fund Objective Analysis The fund seeks to achieve long-term capital The flagship fund of HDFC AMC which was years across and has been more in line with the appreciation and current income from a balanced launched in September 1996 hold the maximum industry. Its substantial and consistent track record corpus amongst all schemes of around Rs. 11,381 visible with the fund's since inception return of portfolio with a target allocation of 60% equity, Crores, way higher than many of the AMC's total around 20% itself makes it a best choice amongst 40% debt and money market securities. asset under management. In fact, this is the fund investors. Managing vast assets has not made most famous amongst investors to start with safer the fund underperform the peers or benchmark Portfolio Manager investing into Equity markets. Many consider with it delivering returns for last three years of Mr. Prashant Jain (ED & CIO) (CFA - AIMR (USA), investment into this fund as the first step towards around 17% on a CAGR basis, whereas the investing. benchmark, BSE-200 delivered a return of around PGDM-IIM (Bangalore) B.Tech. - IIT) has been 11% for the same period. The fund's investment universe comprises of any managing the Scheme through its inception. Mr. company that is a part of the BSE 200 or qualifies A flagship scheme wit h consi stency in i ts Prashant Jain has 19 Years of experience in fund to be a part of that index, including initial public performance as well as being a very well diversified management and research in Mutual Fund offerings. The fund targets around 60 per cent of fund apart from being large cap focused, a quality Industry. He Joined HDFC Asset Management the portfolio in the BSE 200 stocks. Banks, IT, portfolio and a manager who has been delivering Company Limited on 20th July 2003. Mr. Rakesh Automobiles and Engineering are few of its major alpha under major business cycles, this fund is sector allocation. It currently holds around 32 trusted by most and is fairly justified in its long Vyas is also the Fund Manager for the fund. stocks from across 23 sectors. term performance and lesser deviation into risky avenues. Investment Information The fund's performance has been stable for the Inception Date 03-Sep-1996 Asset Allocation Market Capitalization (%) Minimum Investment 5,000.00 O thers Incremental Investment 1,000.00 Cash & Debt 1 9% Cash 1% AUM(Cr)as on Mar 2012 11,381.06 Debt Small Large Cap Equivale Expense Ratio 1.77 n ts Cap Mid Cap 5% 6% Equity Benchmark BSE-200 Small Cap 52 Week High 215.84 Cash & Cash Mid Cap Others Equivalents 1% Larg e 52 Week Low 168.05 Equity Cap Latest Nav (17 May, 2012) 182.67 94% 74% Entry Load NIL NAV V/s BSE 200 Annualized Yearly Rolling Return (%) Exit Load 1.00 HDFC To p 200 (G) BSE-20 0 HDFC Top 200 (G ) BSE-200 Other Attributes 60 250 50 Avg Mat Days N.A. 200 40 PE 19.21 150 30 PB 4.19 100 20 50 10 0 0 Trailing Return (%) Sep-00 Sep-02 Sep-04 Sep-06 Sep-96 Se p-97 Sep-98 Se p-99 Se p-01 Se p-03 Se p-05 Se p-07 Sep-08 Se p-09 Sep-10 Se p-11 -10 <1yr= Absolute Return BSE 200 Mar-08 Mar-0 9 Mar-10 Mar-11 Mar-12 >1 yr=CAGR 1 Month (9.80) (8.31) Top 5 Sector Allocations Top 5 Holdings 3 Months (13.10) (12.30) Sector Assets (%) Company Assets (%) Unspecified 18.69 State Bank Of India 8.57 6 Months 0.08 (0.51) Bank - Public 12.53 ICICI Bank Ltd. 5.94 1 Year (11.38) (11.86) Bank - Private 10.28 ITC Ltd. 5.86 3 Years 16.47 11.30 IT - Software 9.58 Infosys Ltd. 5.68 Cigarettes/Tobacco 5.86 HDFC Bank Ltd. 3.10 5 Years 9.54 2.76 Total Sectors 23.00 Total 32.00 SIP of Rs. 1000 per month (from the 1st April 2009 to 31st March 2012) Risk Analysis Period Total No. of units Total Amount Present Yield Profit Std. Dev. 1.63 Beta 0.84 accumulated Invested Value % SIP R-Squared 0.97 Jensen's Alpha 0.03 Sharpe 0.03 Tracking Error 0.47 3 Years 200.07 36,000.00 40,405.39 12.24 4,405.39 Treynor 0.06 SORTINO 0.05 The perfo rmance is a s on May, 2 012 • Portfo lio d etails as o n Apri l, 201 2 • Source: ACEMF, SSL Resea rch SBICAP Securities Limited
- 2. SBI Magnum Emerging Businesses(D) Mid/Small Cap Fund MAY 2012 Fund Objective Analysis To provi de t he investors maximum growth The fund launched in October 2004 has an objective What has been the most attractive of the fund is its opportunity through equity investments in stocks of of investing in growth oriented sectors of the ability to deliver high returns in bull phase as well growth oriented sectors of the economy and also to economy that are considered emerging. A class hold better than peers in bear markets as visible in participate in the growth potential presented by performer in its category of mid and small cap fund, its 2011 performance. It delivered a substantial various companies that are considered emergent the fund has an allocation of around 39% in small return of around 13% in the last one year, whereas and have expor t or ientati on/outsourci ng cap and around 18% in mid cap and around 35% in the benchmark BSE-500 delivered a negative 12%. opportunities or are globally competitive by investing large cap stocks. The fund is currently invested On a three year basis the fund has delivered a return in the stocks representing such companies. The fund may also evaluate emerging businesses with growth around 9% in cash. of around 34% whereas the benchmark delivered potential and domestic focus. 12% for the same period. The fund's stock selection ability has delivered has been that of some of the best stocks like Page The funds high performance and is suitable for a Portfolio Manager Industries, Hawkins cookers, Goodyear India, etc. High risk High investor category of risk takers. It is Mr. R. Sri nivasan (Senior Fund Manager - Pharma, finance and Banking, Textile and IT sectors certainly one of the best funds under the category Equities) (B.Com, AICWA) has collectively over are few of its biggest bets. The fund currently hold of Mid and Small cap and one can take this fund 16 years of experience in the area of financial few best selected stocks with latest being around into consideration after his allocation to other less services. Prior to joining SBI MF, he was heading 26 from across 22 sectors. The AUM of the fund is risky funds. 'Public Markets' at Future Capital Holdings, asset currently of around Rs. 561.34 Crores. management and financial services of the Future Group. He has also worked with Principal PNB AM C as a port folio m anager and wi th Asset Allocation Market Capitalization (%) Oppenheimer & Co (Blackstone). Others Others Investment Information 9% 8% Larg e Cap 35% Inception Date 11-Oct-2004 Large Cap Minimum Investment 2,000.00 Mid Cap Incremental Investment 500.00 Small Cap AUM(Cr)as on Mar 2012 561.34 Equity Sma ll Cap Others Expense Ratio 2.35 91% 39% Mid Cap Benchmark BSE-500 Equity Others 18% 52 Week High 17.70 52 Week Low 14.28 NAV V/s BSE 500 Annualized Yearly Rolling Return (%) Latest Nav (17 May, 2012) 14.55 Entry Load Nil SBI Mag num Emerging Businesses(D) SBI Mag num Emerging Businesses(D) Exit Load 1.00 BSE-500 BSE-500 60 100 Other Attributes 50 80 40 60 Avg Mat Days N.A. 30 40 PE 21.20 20 20 10 0 PB 6.11 0 -20 Oct -0 8 Trailing Return (%) Oct-04 Jun-05 Feb-06 Oct-06 Jun-07 Ju n-09 Feb-08 Oct-10 Feb-10 Jun-11 Feb-12 -40 Mar-08 Mar-09 Mar-10 Mar-1 1 Mar-12 <1yr= Absolute Return BSE-500 >1 yr=CAGR Top 5 Sector Allocations Top 5 Holdings 1 Month -3.83 -8.34 Sector Assets (%) Company Assets (%) 3 Months 0.77 -12.07 Other 8.36 Page Industries Ltd. 6.86 6 Months 4.99 -0.50 Pharmaceuticals & Drugs 8.28 HDFC Bank Ltd. 6.42 1 Year 12.82 -12.07 Finance - Investment 7.61 Tata Consultancy Services Ltd. 6.32 Textile 6.86 Bajaj Holdings & Investment Ltd 6.23 3 Years 34.24 11.84 Bank - Private 6.42 Muthoot Finance Ltd 6.17 5 Years 8.05 2.39 Total Sectors 22.00 Total Stocks 26.00 SIP of Rs. 1000 per month (from the 1st April 2009 to 31st March 2012) Risk Analysis Period Total No. of units Total Amount Present Yield Profit Std. Dev. 1.70 Beta 0.74 accumulated Invested Value % SIP R-Squared 0.82 Jensen's Alpha 0.02 Sharpe 0.02 Tracking Error 1.08 3 Years 1062.18 36,000.00 46,532.13 29.26 10,532.13 Treynor 0.05 SORTINO 0.03 The perfo rmance is a s on May, 2 012 • Portfo lio d etails as o n Apri l, 201 2 • Source: ACEMF, SSL Resea rch SBICAP Securities Limited
- 3. Canara Robeco Equity Diversified (G) Multi Cap Fund MAY 2012 Fund Objective Analysis To generate capital appreciation by investing in Launched in September 2003, the fund is a Multi delivered its best yearly performance from March equity and equity related securities. cap Fund diversified with a Large cap exposure of '09 to March '10 wherein it achieved return of around ~82% and Mid-Small cap exposure standing at 140.63% as against its benchmark BSE-200's return ~13% as on Month ended April, 2012. The fund is of around 124.07% for the same period. In case of currently around 94% invested in equities with the worst performance, its performance has not been rest being in Cash. that risky as its worst yearly performance was of Portfolio Manager Mr. Anand Shah, whose other funds under Canara about -54.42% which fell lesser than the benchmark Robeco were of the top performers, was initially performance at around -59.11% Mr. Soumendra Nath Lahiri (Head - Equities) (B.E, PGDM) has been managing the scheme since June the fund manager of the scheme since July 2009. When calculated on a rolling period basis, the recent The fund is currently managed by Mr. Soumendra performance of the fund is at around 14% and 45% 2009. Mr. Lahiri has 22 years of experience, out Nath Lahiri. for the last two years which is way higher than the of which 16 years is in research and asset benchmark performance of around 6% and 30%, The fund holds more than 50 stocks from across management with Emkay Global Services, Fortuna respectively. almost all sectors. Banks, IT and Pharma consists Capital, DSP Merrill Lynch, and Dolat Capital of Major allocation with the likes of HDFC Bank, A very well diversified portfolio, consistent Market Ltd. amongst others. Infosys, ITC, etc. The AUM of the fund is currently performance during the bull phase as well as lesser of around Rs. 542.78 Crores. downside risk is the quality of the fund, making it a In respect to the performance, the fund has best in diversified category. Investment Information Inception Date 31-Mar-1996 Asset Allocation Market Capitalization (%) Minimum Investment 5000.00 Cash & Oth ers Large Ca p Debt Small Incremental Investment 1000.00 6% Mid Cap 6% Cap AUM(Cr)as on Mar 2012 310.79 4% Small Cap Expense Ratio 2.08 Mid Cap Oth ers 9% Benchmark BSE 200 52 Week High 32.02 Equity Large 94% 52 Week Low 29.59 Cap Equity Cash & Debt 81% Latest Nav (17 May, 2012) 31.58 Entry Load (%) 0.00 NAV V/s BSE 200 Annualized Yearly Rolling Return (%) Exit Load (%) 1.00 Ca nara Ro beco Eq D ivers ified(G) Canara Robeco Eq Diversified(G) Other Attributes BSE-200 BSE-200 70 Avg Mat Days 365.00 60 50 50 40 PE N.A. 40 30 30 PB N.A. 20 20 10 10 Trailing Return (%) 0 0 Sep- 03 Jul-04 Mar-06 Nov- 07 Sep- 08 Mar-11 Jul- 09 May-05 Jan-07 May-10 Jan-12 -10 <1yr= Absolute Return BSE-200 Mar-08 Mar-09 Mar-10 Mar-11 Mar-12 >1 yr=CAGR 1 Month (6.88) (8.31) Top 5 Sector Allocations Top 5 Holdings 3 Months (7.74) (12.30) Sector Assets (%) Company Assets (%) 6 Months 1.35 (0.51) Bank - Private 15.84 HDFC Bank Ltd. 6.00 IT - Software 8.32 Infosys Ltd. 5.61 1 Year (4.04) (11.86) Pharmaceuticals & Drugs 6.62 ITC Ltd. 4.63 3 Years 19.05 11.30 Bank - Public 6.24 ICICI Bank Ltd. 4.55 5 Years 10.04 2.76 Refineries 6.10 State Bank Of India 3.83 Total Sectors 31.00 Total Stocks 51.00 SIP of Rs. 1000 per month (from the 1st April 2009 to 31st March 2012) Risk Analysis Period Total No. of units Total Amount Present Yield Profit Std. Dev. 1.63 Beta 0.82 accumulated Invested Value % SIP R-Squared 0.95 Jensen's Alpha 0.03 Sharpe 0.03 Tracking Error 0.59 3 Years 756.26 36,000.00 41,549.37 15.41 5,549.37 Treynor 0.06 SORTINO 0.05 The perfo rmance is a s on May, 2 012 • Portfo lio d etails as o n Apri l, 201 2 • Source: ACEMF, SSL Resea rch SBICAP Securities Limited
- 4. HDFC Tax Saver ELSS Fund May 2012 Fund Objective Analysis The investment objective of the Scheme is to The fund was launched in March 1996 with benchmark as well as peers on three year as well currently holding an AUM of around Rs. 3,114 as five years basis, it has generated a good return achieve long term growth of capital Crore. A long track record of consistently decent with a CAGR of ~20% compared to the benchmark performance of the fund like the other funds of return of ~12% for 3 years. When compared on a HDFC has been its greatest advantage. The fund Rolling return basis, it has been a benchmark Portfolio Manager is currently managed by Mr. Vinay R. Kulkarni and beater for consecutive periods. On the ratios front, Mr. Rakesh Vyas. the fund has shown a Sharpe of 0.02 with the Mr. Vinay R. Kulkarni (Senior Fund Manager - Market Sensitivity (Beta) of 0.77. As per the latest portfolio, the Fund currently has Equities) is B. Tech (IIT Mumbai), PGDM (IIM, an Equity portion of around 87%, and the rest in A long track record of successful performance has Bangalore) has collectively over 22 years of Debt and Cash. The Market Capitalization of the been the biggest key for investment into this Fund. experience, of which 20 years in Fund Management Fund is diversified with Large Cap constituting of In fact, along with other Tax saving fund, one can around 65% and Mid Cap exposure of around 10%. allocate to these diversified ELSS Fund. and Equity Research with AMCs like UTI Asset The Sector of Bank, Pharma and IT are preferred. Management as Fund Manager and 2 years in IT The ELSS Category has seen this fund performing SBI, TCS and IT consists of its major composition with a consistency in its genes and therefore for Industry with Patni Computer Systems. of the overall 35 stocks from 29 sectors. the one's preferring with lesser of risk and higher The fund's performance has been consistent since of diversification, this fund can certainly prove a its launch except it hitting a roadblock during the good bet. Investment Information great fall of 2007. Consistently, beating the Inception Date 31-Mar-1996 Asset Allocation Market Capitalization (%) Minimum Investment 500.00 Others Others Incremental Investment 500.00 11% 13% AUM(Cr) as on Mar-2012 3114.05 Large Cap Unspecif Debt ied Expense Ratio 1.85 Mid Cap 2% 11% Benchmark S&P CNX 500 Unspecified Equity Ot hers Mid Cap 52 Week High 240.19 10% 87% Large 52 Week Low 189.27 Cap Latest Nav (14 May, 2012) 206.25 Equity Debt Others 66% Entry Load NIL NAV V/s S&P CNX 500 Annualized Yearly Rolling Return (%) Exit Load NIL HDFC TaxSaver(G ) S&P CNX 500 HDFC TaxSaver(G) S&P CNX 500 Other Attributes 400 250 350 Avg Mat Days N.A. 300 200 250 150 PE 19.01 200 100 150 PB 4.49 100 50 50 0 0 Trailing Return (%) -50 Aug-00 Oct-01 Dec-02 Feb-04 Apr-05 Jun-06 Aug-07 Oct-08 Dec-09 Feb-11 Apr-12 Jun-99 Mar-04 Mar-06 Mar-08 Mar-10 Mar-12 Mar-05 Mar-07 Mar-09 Mar-11 <1yr= Absolute Return S&P CNX 500 >1 yr=CAGR 1 Month (5.79) (6.30) Top 5 Sector Allocations Top 5 Holdings 3 Months (7.19) (8.92) Sector Assets (%) Company Assets (%) Unspecified 11.48 Other Equities 11.48 6 Months (2.05) (4.11) Bank - Public 9.04 State Bank Of India 6.67 1 Year (9.99) (12.54) IT - Software 9.00 Tata Consultancy Services Ltd. 5.10 3 Years 20.42 11.92 Pharmaceuticals & Drugs 8.84 ITC Ltd. 4.29 Other 7.12 Infosys Ltd. 3.90 5 Years 7.39 2.67 Total Sectors 29.00 Total Stocks 35.00 SIP of Rs.1000 per month (from the 1st April 2009 to 31st March 2012) Risk Analysis Period Total No. of units Total Amount Present Yield Profit Std. Dev. 1.53 Beta 0.77 accumulated Invested Value % SIP R-Squared 0.94 Jensen's Alpha 0.01 Sharpe 0.02 Tracking Error 0.69 3 Years 65.65 36,000.00 41,001.22 13.89 5,001.22 Treynor 0.04 SORTINO 0.04 The perfo rmance is a s on May, 2 012 • Portfo lio d etails as o n Apri l, 201 2 • Source: ACEMF, SSL Resea rch SBICAP Securities Limited
- 5. Canara Robeco Equity Tax Saver ELSS Fund MAY 2012 Fund Objective Analysis To provide long term capital appreciation by Launched since March 1993, Canara Robeco Equity able to beat the benchmark as well as peers on predominantly investing in equities to facilitate the Tax Saver was earlier known as Canpep '93. The three year as well as five years basis. It has been subscribers to seek tax benefits as provided under scheme was converted into open ended plan from the top performer too. On a three years basis, the May 1999. fund has generated a good return with a CAGR of Section 80 C of the Income Tax Act, 1961. Mr. Anand Shah, whose other funds under Canara ~21% compared to the benchmark return of ~11% However, there can be no assurance that the Robeco were of the top performers, was initially for the same period. On the ratios front, the fund investment objective of the scheme will be realized. has shown a Sharpe of 0.03 with the Market the fund manager of the scheme since July 2009. The fund is currently managed by Mr. Soumendra Sensitivity (Beta) of 0.81. Portfolio Manager Nath Lahiri. The fund has achieved exceptional performance in Mr. Soumendra Nath Lahiri (Head - Equities) (B.E, the past few years. Although, the Funds star The Fund currently has an Equity portion of around PGDM) has been managing the scheme since June 93%, and the rest in Cash. Allocated Majorly into performer of the Past Mr. Anand Shah quit in early 2009. Mr. Lahiri has 22 years of experience, out Large Cap Stocks, the fund holds more than 50 2011, the Fund has been in consistent in its stocks from across almost all sectors. Banks and performance under Mr. Lahiri too. of w hi ch 16 year s in research and asset management with Emkay Global Services, Fortuna IT consists of Major allocation with the likes of HDFC With it being the last year for ELSS Category for Bank, ICICI Bank, SBI Bank, etc. The Fund Holds the Tax Savers, this Fund with its superior stock Capital, DSP Merrill Lynch, and Dolat Capital cash of around 5-7%. selection and fund management skills can prove a Market Ltd. amongst others. good bet. In respect to the performance, the Fund has been Investment Information Minimum Investment 500.00 Asset Allocation Market Capitalization (%) Incremental Investment 500.00 Others Others, AUM(Cr)as on Mar 2012 362.34 7% 6.60 Large Cap Small Cap, 5.07 Mid Cap Expense Ratio 2.32 Small Cap Benchmark BSE-100 Others 52 Week High 18.85 Equity 52 Week Low 15.78 Mid Cap, 93% Large Latest Nav (14 May, 2012) 16.34 10.46 Ca p, Equity Others 77.87 Entry Load NIL Exit Load NIL NAV V/s BSE 100 Annualized Yearly Rolling Return (%) Canara Robe co Eq uity Tax Save r(D) Canar a Robeco Equity Tax S aver(D) BSE-100 Other Attributes BSE-10 0 100 100 80 Avg Mat Days 1.83 80 60 PE 20.57 60 40 PB 4.82 40 20 20 0 Trailing Return (%) - -20 Feb-02 Dec-02 Au g-04 Ju n-05 Feb-07 Dec-07 Au g-09 Ju n-10 Feb-12 Apr-01 Oct-03 Apr-06 Oct-08 Apr-11 Mar-04 Mar-06 Mar-07 Mar-08 Mar-11 Mar-12 Mar-05 Mar-09 Mar-10 <1yr= Absolute Return BSE-100 >1 yr=CAGR 1 Month (4.28) (6.22) Top 5 Sector Allocations Top 5 Holdings 3 Months (5.10) (9.38) Sector Assets (%) Company Assets (%) 6 Months (0.86) (4.57) Bank - Private 15.20 HDFC Bank Ltd. 6.36 IT - Software 8.67 Infosys Ltd. 5.69 1 Year (4.87) (12.26) Pharmaceuticals & Drugs 7.25 ICICI Bank Ltd. 4.81 3 Years 21.51 11.72 Bank - Public 6.25 ITC Ltd. 3.42 5 Years 12.19 3.53 Refineries 5.57 Reliance Industries Ltd. 3.11 Total Sectors 31.00 Total 56.00 SIP of Rs. 1000 per month (from the 1st April 2009 to 31st March 2012) Risk Analysis Period Total No. of units Total Amount Present Yield Profit Stand. Deviation 1.63 Beta 0.81 accumulated Invested Value % SIP R-Squared 0.93 Jensen's Alpha 0.02 Sharpe 0.03 Tracking Error 0.71 3 Years 331.89 36,000.00 41,688.29 15.80 5,688.29 Treynor 0.06 SORTINO 0.05 The perfo rmance is a s on May, 2 012 • Portfo lio d etails as o n Apri l, 201 2 • Source: ACEMF, SSL Resea rch SBICAP Securities Limited
- 6. HDFC Prudence Fund - Growth Balanced Fund May 2012 Fund Objective Analysis The fund seeks to achieve long-term capital The fund ever since its launch in February 1994 whereas the benchmark, Crisil Balanced Fund has been one of the most trusted funds for Index delivered a return of around 9% for the same appreciation and current income from a balanced investments into the Balanced Category. The same period. portfolio with a target allocation of 60% equity, is visible with a gigantic Corpus/AUM built up by The Scheme is managed by one of the most 40% debt and money market securities. the fund of Rs. 6200 Crores. The fund has an successful and well known Fund Manager in the excellent track record in its performance since the Indian Mutual Fund Industry - Mr. Prashant Jain. Portfolio Manager beginning of its launch and has given an average His other funds of HDFC Equity and HDFC Top return of more than 18% since its inception. Mr. Prashant Jain (ED & CIO) (CFA - AIMR (USA), 200 are of size around Rs. 20,000 Crores when Being a Balanced fund the Equity Allocation of the Combined together (higher than many of the other PGDM-IIM (Bangalore) B.Tech. - IIT) has been fund has around 72% and debt allocation standing AMC's overall AUM itself) and also one of the best managing the Scheme through its inception. Mr. at around 22% for the latest available Month. The performing ones in the industry since long time. Prashant Jain has 19 Years of experience in fund equity portion is majorly invested into Large Cap Balanced Fund is the category suggestible for most management and research in Mutual Fund with around 42% and a small portion being in small of the beginner and conservative investors. This Industry. He Joined HDFC Asset Management and midcap. fund can certainly cater to investors who wish less Company Limited on 20th July 2003. Mr. Rakesh On the performance front, the fund's return has volatility and stable returns. Overall, HDFC Vyas is also the Fund Manager for the fund. been exceptional when compared to benchmark Prudence can be considered as an initial or priority as well as peers. The fund's returns for last three scheme suggestible to almost all class of investors. Investment Information years have been of around 23% on a CAGR basis, Inception Date 01-Feb-1994 Asset Allocation Market Capitalization (%) Minimum Investment 5,000.00 Ot hers Others Incremental Investment 1,000.00 15% La rge 7% Debt C ap AUM(Cr)as on Mar 2012 6,248.60 22% 42% Expense Ratio 1.79 O th er Equ ity Benchmark Crisil Balanced Fund Index 2 8% Small 52 Week High 221.30 Cap Mid Cap Equit y 13% 52 Week Low 183.13 71% 2% Large Cap Mid Cap Small Cap Latest Nav (17 May, 2012) 203.94 Debt Equity Others Othe r Equ it y Others Entry Load - NAV V/s S&P CNX Nifty* Annualized Yearly Rolling Return (%) Exit Load 1.00 HDFC Prudence(G) S&P CNX Nifty HDFC Prudence(G) Crisil Balanced Fund Index Other Attributes 50 300 Avg Mat Days N.A> 250 40 PE 16.91 200 30 150 PB 4.21 20 100 10 50 0 Trailing Return (%) 0 Feb-94 Feb-95 Feb-97 Feb-98 Feb-00 Feb-01 Feb-02 Feb-04 Feb-05 Feb-08 Feb-09 Feb-11 Feb-12 Feb-96 Feb-99 Feb-03 Feb-06 Feb-07 Feb-10 -10 <1yr= Absolute Return Crisil Balanced Mar-08 Mar-09 Mar-10 Mar-11 Mar-12 >1 yr=CAGR Fund Index 1 Month -6.01 -5.19 Top 5 Sector Allocations Top 5 Holdings 3 Months -6.88 -7.79 Sector Assets (%) Company Assets (%) Unspecified 14.81 Other Equities 14.81 6 Months 4.37 0.89 Bank - Public 11.18 State Bank Of India 5.63 1 Year -3.34 -3.93 Other 10.49 ICICI Bank Ltd. 3.70 3 Years 22.54 8.88 Bank - Private 4.69 Page Industries Ltd. 3.44 IT - Software 4.55 Bank Of Baroda 2.47 5 Years 11.47 5.37 Total Sectors 33.00 Total 41.00 SIP of Rs. 1000 per month (from the 1st April 2009 to 31st March 2012) Risk Analysis Period Total No. of units Total Amount Present Yield Profit Std. Dev. 1.13 Beta 0.54 accumulated Invested Value % SIP R-Squared 0.90 Jensen's Alpha 0.03 Sharpe 0.04 Tracking Error 0.99 3 Years 200.60 36,000.00 42,957.43 19.33 6,957.43 Treynor 0.09 SORTINO 0.07 * Compared with S&P CNX Nifty as CRISIL Balanced Index data is unavailable The perfo rmance is a s on May, 2 012 • Portfo lio d etails as o n Apri l, 201 2 • Source: ACEMF, SSL Resea rch SBICAP Securities Limited
- 7. Canara Robeco MIP (G) MIP Fund MAY 2012 Fund Objective Analysis To generate income by investing in a wide range The fund was launched in March 1996 as a Monthly The AUM of the fund is currently of around Rs. of debt securities and money market instruments Income Plan fund. Being an MIP its portfolio consists 310.78 Crores. of various maturities and risk profile and a small of an asset allocation of majorly into Debt and In respect to the performance, the fund has portion of investment in equities and equity related Money market instruments for current income and delivered its best yearly performance from October instruments. a small portion in Equity for growth. As of the latest 2008 -2009, wherein it achieved return of around available portfolio on April 2012, the fund holds a Portfolio Manager debt allocation of around 75% and equity exposure ~32% as against its benchmark Crisil MIP Blended Index's return of around ~21% for the same period. Mr. Ritesh Kumar Jain (Head - Fixed Income) of around 20%. On a trailing return basis, the fund has beaten its (B.Com, M.B.E) has over 10 years of experience. The fund is managed by Mr. Ritesh Jain, whose benchmark on a three years as well as five years Before joining with Canara Robeco, Mr. Jain has other debt funds under Canara Robeco have been basis. worked with IDBI Bank Ltd., Mumbai as Manager, performing consistently well. In fact, the fund Treasury (1998-2001) as well as with Kotak Under the Category of MIP this fund has been a manager was recently awarded the Best Debt fund Mahindra Asset Management Co. Ltd., Mumbai consistent performer and a choice for the ones as Fund Manager (2002-2007) and as Head - Fixed manager for the year award. expecting a steady cash flow on a monthly basis. income (2007- Till April 2008). Mr. Jain was In the terms of portfolio, the fund holds mostly The MIP category is most suitable for retired and recently awarded as Debt Fund Manager of the financial and banking sectors with likes of HDFC conservative investors aiming at protection of capital year award. Ltd, Central Bank of India, Oriental Bank of and income. Commerce, etc as few of its major constituents. Investment Information Inception Date 16-Sep-2003 Asset Allocation Market Capitalization (%) Minimum Investment 5,000.00 Oth ers L arge 5% Cap Incremental Investment 1,000.00 Large Cap 16% Mid Cap Equity AUM(Cr)as on Mar 2012 542.78 Mid Ca p 3% 20% Small Ca p Expense Ratio 2.25 Small Others Benchmark CRISIL MIP Blended Index Cap De bt 1% 52 Week High 56.74 75% O thers 52 Week Low 47.53 80% Debt Equity Oth ers Latest Nav (17 May, 2012) 51.84 Entry Load NIL NAV V/s S&P CNX Nifty* Annualized Yearly Rolling Return (%) Exit Load 1.00 Canara Robeco MIP(G) Canara Robeco MIP(G) Crisil MIP Blended Index Other Attributes S&P CNX Nif ty 20 14 18 12 Avg Mat Days 1.83 10 16 14 PE 20.74 8 12 6 10 PB 5.06 4 8 2 6 0 4 Trailing Return (%) Jan -0 8 Nov-08 Sep-09 Jul-10 Dec-10 May-11 Mar-12 Jun-08 Apr-09 Feb-10 Oct-11 2 0 <1yr= Absolute Return Crisil MIP Mar-08 Mar-09 Mar- 10 Mar-11 Mar-12 >1 yr=CAGR Blended Index 1 Month -0.91 -0.82 Top 5 Sector Allocations Top 5 Holdings 3 Months 0.76 -0.49 Sector Assets (%) Company Assets (%) 6 Months 4.05 4.05 Bank - Public 24.62 HDFC Ltd. 10.13 Finance - NBFC 13.20 Central Bank Of India 8.35 1 Year 6.52 5.66 Finance - Housing 10.13 Tata Motors Finance Ltd. 8.27 3 Years 9.00 6.47 Steel/Sponge Iron/Pig Iron 8.12 Jindal Steel & Power Ltd. 8.12 5 Years 9.81 6.85 Finance Term Lending 5.08 Oriental Bank Of Commerce 7.79 Total Sectors 37.00 Total Stocks 46.00 SIP of Rs. 1000 per month (from the 1st April 2009 to 31st March 2012) Risk Analysis Period Total No. of units Total Amount Present Yield Profit Std. Dev. 0.45 Beta 0.18 accumulated Invested Value % SIP R-Squared 0.75 Jensen's Alpha 0.02 Sharpe 0.07 Tracking Error 1.57 3 Years 1280.75 36,000.00 40,181.25 11.61 4,181.25 Treynor 0.16 SORTINO 0.13 * Compared with S&P CNX Nifty as CRISIL MIP Blended Index data is unavailable The perfo rmance is a s on May, 2 012 • Portfo lio d etails as o n Apri l, 201 2 • Source: ACEMF, SSL Resea rch SBICAP Securities Limited