SlideShare uma empresa Scribd logo
1 de 8
Project Name
LBO Transaction Summary
($ in millions, except per share data)

Transaction Assumptions                                       Sources & Uses of Funds
Transaction Date                             December 2008    Sources                        Amount    Percent       Rate        Term           Fees
Months to End of Year                                   12    Existing Cash                   $32.5     22.9%
Minimum Operating Cash                                $5.0    Line of Credit*                   0.0      0.0%        5.6%      5 years          1.5%
12 Month LIBOR                                      2.80%     Senior Debt - Term A             34.8     24.5%        8.3%      5 years          1.5%
                                                              Senior Debt - Term B              0.0      0.0%        9.3%      8 years          1.5%
Trading Information                                           Sub Debt                          0.0      0.0%       11.8%     10 years          2.0%
                                           Deal    Current    Rollover Debt                     0.0      0.0%        0.0%      0 years          0.0%
Share Price                              $10.00     $2.03     Equity                           74.5     52.6%                                   1.0%
Diluted Shares                             13.3      13.2       Total Sources                $141.8    100.0%
  Equity Market Value                    $132.9     $26.9                                                                    *Available Line of Credit
Plus: Debt Outstanding                      4.7       4.7     Uses                                                                             $17.5
Less: Cash & Equivalents                   37.5      37.5     Purchase of Equity              $132.9    93.7%
  Enterprise Value                       $100.1     ($5.9)    Debt Repayment                     4.7     3.3%
                                                              Working Capital                    0.0     0.0%
2008P EBITDA Multiple                      5.8x       -0.3x   Financing Fees                     1.5     1.1%
                                                              Transaction Expenses               2.7     1.9%        2.0%
Debt Capacity Analysis                                          Total Uses                    $141.8   100.0%
2008P EBITDA                                        $17.4
Senior Debt / EBITDA Coverage                         2.0x    Equity IRR Calculation
 Senior Debt Capacity                               $34.8     Exit LTM EBITDA Multiple                           2011 Exit   2012 Exit     2013 Exit
Sub Debt / EBITDA Coverage                            0.0x         5.0x                                              8.7%       12.5%         14.5%
 Sub Debt Capacity                                   $0.0          6.0x                                             16.1%       17.7%         18.3%
                                                                   7.0x                                             22.6%       22.2%         21.7%
Goodwill Calculation                                               8.0x                                             28.5%       26.3%         24.7%
Purchase Price of Equity                           $132.9
Plus: Transaction Costs                               4.2     Credit Statistics
Less: Book Value of Equity                           90.0                                                         2008PF        2009P          2010P
  Total Deal Goodwill                               $47.1     EBITDA / Interest Exp.                                 6.6x         8.0x           9.0x
                                                              EBITDA - CapEx / Interest Exp.                         2.6x         4.4x           5.4x
% of Goodwill Allocated to Intangibles               20.0%    Total Debt / EBITDA                                    2.0x         1.7x           1.1x
 Amount Allocated to Intangibles                      $9.4    EBITDAR / Adj. Interest Exp.                           3.6x         3.7x           3.9x
Amortization Period                                 7 years   EBITDAR - CapEx / Adj. Interest Exp.                   2.9x         3.2x           3.3x
 Annual Amortization of Intangibles                   $1.3    Adj. Total Debt / EBITDAR                              6.0x         6.0x           5.7x
Amount Allocated to Goodwill                         $37.7
                                                              Cumulative Senior                2009P    2010P       2011P       2012P          2013P
                                                              Debt Paydown                     20.0%    40.0%       62.4%       93.2%         100.0%
Project Name
Returns Analysis
($ in millions, except per share data)


2011 Exit Analysis                                                               Sensitivity Analysis - 2011 Exit
Years to Exit                                3.0                                 Price                 LTM EBITDA Exit Multiple            Premium
Exit EBITDA Multiple                        5.0x      6.0x      7.0x      8.0x           8.7%           5.0x       6.0x             7.0x
Exit LTM EBITDA                            20.6      20.6      20.6      20.6    $8.00                 8.7%       8.7%             8.7%     294.1%
 Implied Enterprise Value                $103.0    $123.6    $144.2    $164.7    $9.00                 8.7%       8.7%             8.7%     343.3%
                                                                                 $10.00                8.7%       8.7%             8.7%     392.6%
Less: Debt Outstanding                     13.1      13.1      13.1      13.1    $11.00                8.7%       8.7%             8.7%     441.9%
Plus: Cash & Equivalents                    5.0       5.0       5.0       5.0    $12.00                8.7%       8.7%             8.7%     491.1%
  Implied Equity Value                    $94.9    $115.5    $136.1    $156.7

Implied IRR                                8.7%     16.1%     22.6%     28.5%
Implied Return Multiple                     1.3x      1.5x      1.8x      2.1x

2012 Exit Analysis                                                               Sensitivity Analysis - 2012 Exit
Years to Exit                                4.0                                 Price                 LTM EBITDA Exit Multiple            Premium
Exit EBITDA Multiple                        5.0x      6.0x      7.0x      8.0x          12.5%           5.0x        6.0x            7.0x
Exit LTM EBITDA                            23.1      23.1      23.1      23.1    $8.00               12.5%        12.5%           12.5%     294.1%
 Implied Enterprise Value                $115.7    $138.9    $162.0    $185.2    $9.00               12.5%        12.5%           12.5%     343.3%
                                                                                 $10.00              12.5%        12.5%           12.5%     392.6%
Less: Debt Outstanding                      2.3       2.3       2.3       2.3    $11.00              12.5%        12.5%           12.5%     441.9%
Plus: Cash & Equivalents                    5.0       5.0       5.0       5.0    $12.00              12.5%        12.5%           12.5%     491.1%
  Implied Equity Value                   $118.4    $141.5    $164.7    $187.8

Implied IRR                               12.5%     17.7%     22.2%     26.3%
Implied Return Multiple                     1.6x      1.9x      2.2x      2.5x

2013 Exit Analysis                                                               Sensitivity Analysis - 2013 Exit
Years to Exit                                5.0                                 Price                 LTM EBITDA Exit Multiple            Premium
Exit EBITDA Multiple                        5.0x      6.0x      7.0x      8.0x          14.5%           5.0x        6.0x            7.0x
Exit LTM EBITDA                            25.9      25.9      25.9      25.9    $8.00               14.5%        14.5%           14.5%     294.1%
 Implied Enterprise Value                $129.6    $155.5    $181.4    $207.3    $9.00               14.5%        14.5%           14.5%     343.3%
                                                                                 $10.00              14.5%        14.5%           14.5%     392.6%
Less: Debt Outstanding                      0.0       0.0       0.0       0.0    $11.00              14.5%        14.5%           14.5%     441.9%
Plus: Cash & Equivalents                   15.6      15.6      15.6      15.6    $12.00              14.5%        14.5%           14.5%     491.1%
  Implied Equity Value                   $145.2    $171.1    $197.0    $222.9

Implied IRR                               14.5%     18.3%     21.7%     24.7%
Implied Return Multiple                     1.9x      2.3x      2.6x      3.0x
Project Name
Summary Financials and Credit Analysis
($ in millions, except per share data)
                                                                 FY December 31,
                                         2008PF      2009P      2010P     2011P       2012P      2013P

Unadjusted Operating Statistics
Revenue                                    $274.0     $271.5     $276.9     $290.8     $305.3     $320.6
EBITDA                                       17.4       16.5       18.2       20.6       23.1       25.9
EBIT                                          5.4        3.2        4.5        6.1        7.7        9.5
Capital Expenditures                         10.5        7.4        7.3        8.9        9.1        9.3
Interest Expense                              2.6        2.1        2.0        1.4        0.6        0.1
Total Debt                                   34.8       27.8       20.9       13.1        2.3        0.0
Total Capitalization                        109.3      102.7       97.3       92.5       86.2       89.8

Unadjusted Credit Statistics
EBITDA / Interest Expense                     6.6x       8.0x       9.0x      14.6x      36.2x     265.7x
EBITDA - CapEx / Interest Expense             2.6x       4.4x       5.4x       0.5x       3.3x       N.A.
Total Debt / EBITDA                           2.0x       1.7x       1.1x       0.6x       0.1x       0.0x
Total Debt / Total Capitalization           31.8%      27.1%      21.4%      14.1%       2.7%       0.0%
Cumulative Senior Debt Paydown                         20.0%      40.0%      62.4%      93.2%     100.0%

Adjusted Operating Statistics
EBITDAR                                     $53.3      $52.1      $54.5      $58.7      $63.2      $67.9
Adjusted Interest Expense                    14.6       13.9       14.1       14.1       14.0       14.1
Adjusted Total Debt                         322.1      312.5      311.2      317.9      322.5      336.1
Adjusted Total Capitalization               396.6      387.4      387.7      397.4      406.3      425.9

Adjusted Credit Statistics
EBITDAR / Adj. Interest Exp.                  3.6x       3.7x       3.9x       4.2x       4.5x       4.8x
EBITDAR - CapEx / Adj. Interest Exp.          2.9x       3.2x       3.3x       3.5x       3.9x       4.2x
Adj. Total Debt / EBITDAR                     6.0x       6.0x       5.7x       5.4x       5.1x       4.9x
Adj. Total Debt / Adj. Total Cap.           81.2%      80.7%      80.3%      80.0%      79.4%      78.9%

Adjustment Calculations
Rent Expense                                $35.9      $35.6      $36.3      $38.1      $40.0      $42.0
Rent Factor                                   8.0x       8.0x       8.0x       8.0x       8.0x       8.0x
 Adjustment to Total Debt                  $287.3     $284.7     $290.4     $304.9     $320.1     $336.1

Expense Attributable to Interest            33.3%      33.3%      33.3%      33.3%      33.3%      33.3%
 Adjustment to Interest Expense             $12.0      $11.9      $12.1      $12.7      $13.3      $14.0
Project Name
Operating Assumptions
($ in millions, except per share data)
                                            FY December 31,                             FY December 31,
                                           2006A     2007A       2008P      2009P      2010P     2011P       2012P      2013P
Income Statement
Revenue Growth                                 0.0%       3.2%     (0.1%)     (0.9%)      2.0%       5.0%       5.0%       5.0%
EBITDA Growth                               (12.2%)    (40.0%)    (14.7%)     (5.0%)     10.4%      13.0%      12.4%      11.9%
Net Income Growth                           (13.6%)    (53.7%)    (47.9%)    (90.0%)    324.5%      86.8%      51.7%      34.1%

COGS (% of Revenue)                          50.5%      53.7%      55.5%      56.0%      56.0%      56.0%      56.0%      56.0%
SG&A (% of Revenue)                          23.2%      25.7%      25.0%      24.8%      24.3%      23.8%      23.3%      22.8%
Rent Expense (% of Revenue)                  13.5%      13.1%      13.1%      13.1%      13.1%      13.1%      13.1%      13.1%
Interest Income (% of Cash)                               4.9%       1.6%      1.6%       1.6%       1.6%       1.6%       1.6%
Other Income (% of Revenue)                   0.0%      (0.1%)     (0.1%)      0.0%       0.0%       0.0%       0.0%       0.0%
Effective Tax Rate                           39.0%      34.6%      36.6%      37.5%      37.5%      37.5%      37.5%      37.5%

Gross Margin                                 49.5%      46.3%      44.5%      44.0%      44.0%      44.0%      44.0%      44.0%
EBITDA Margin                                12.8%       7.4%       6.3%       6.1%       6.6%       7.1%       7.6%       8.1%
Net Income Margin                             5.8%       2.6%       1.3%       0.1%       0.6%       1.0%       1.5%       1.9%

Balance Sheet
Accounts Receivable Days                                  6.4        6.4        6.6        6.6        6.6        6.6        6.6
Inventory Turnover                                        4.5x       5.5x       5.5x       5.5x       5.5x       5.5x       5.5x
Prepaid Expenses (% of Revenue)               2.7%       0.9%       2.0%       2.2%       2.2%       2.2%       2.2%       2.2%
Other Current Assets (% of Revenue)           0.0%       0.0%       0.0%       0.0%       0.0%       0.0%       0.0%       0.0%
Other Assets (% of Revenue)                   0.1%       0.1%       0.1%       0.1%       0.1%       0.1%       0.1%       0.1%

Accounts Payable Days                                    28.3       21.8       20.9       20.9       20.9       20.9       20.9
Accrued Expenses (% of Revenues)              0.6%       0.7%       1.0%       0.9%       0.9%       0.9%       0.9%       0.9%
Other Current Liabilities (% of Revenue)      4.3%       5.2%       3.8%       3.8%       3.8%       3.8%       3.8%       3.8%
Other Liabilities (% of Revenue)              6.7%       5.9%       6.0%       6.2%       6.2%       6.2%       6.2%       6.2%

Store Buildout
Beginning Number of Stores                     306        296        297        295        292        297        307        317
New Stores                                      17         10         14          5          5         10         10         10
Closed Stores                                   27          9         16          8          0          0          0          0
Stores Opened, net                             (10)         1         (2)        (3)         5         10         10         10
Ending Number of Stores                        296        297        295        292        297        307        317        327
Net Store Growth                             -3.3%       0.3%      -0.7%      -1.0%       1.7%       3.4%       3.3%       3.2%
New Store Capex                               $5.1       $3.0       $4.2       $1.5       $1.5       $3.0       $3.0       $3.0
Capex per New Store                           $0.3       $0.3       $0.3       $0.3       $0.3       $0.3       $0.3       $0.3

Maintenance Capex                             $7.2       $9.1       $6.3       $5.9       $5.8       $5.9       $6.1       $6.3
Maintenance Capex, per Existing Store        $0.02      $0.03      $0.02      $0.02      $0.02      $0.02      $0.02      $0.02

Total Capex                                  $12.3      $12.1      $10.5       $7.4       $7.3       $8.9       $9.1       $9.3
Project Name
Actual & Projected Income Statement
($ in millions, except per share data)

                                          FY December 31,                             FY December 31,
                                         2006A     2007A       2008P      2009P      2010P     2011P       2012P      2013P

Revenue                                   $265.9     $274.5     $274.0     $271.5     $276.9     $290.8     $305.3     $320.6
COGS                                       134.2      147.5      152.2      152.1      155.2      162.9      171.1      179.6
 Gross Profit                              131.7      127.0      121.9      119.4      121.8      127.9      134.3      141.0

SG&A                                        61.8       70.7       68.6       67.3       67.3       69.2       71.1       73.1
 EBITDAR                                   $69.9      $56.3      $53.3      $52.1      $54.5      $58.7      $63.2      $67.9

Rent Expense                                36.0       36.0       35.9       35.6       36.3       38.1       40.0       42.0
 EBITDA                                    $33.9      $20.4      $17.4      $16.5      $18.2      $20.6      $23.1      $25.9

Depreciation of Existing Assets             11.4       12.1       12.0       12.0       12.0       12.0       12.0       12.0
Depreciation of New CapEx                    0.0        0.0        0.0        0.0        0.4        1.2        2.1        3.0
Amortization of Intangibles                  0.0        0.0        0.0        1.3        1.3        1.3        1.3        1.3
 Total D&A                                  11.4       12.1       12.0       13.3       13.7       14.5       15.4       16.4
 EBIT                                      $22.6       $8.2       $5.4       $3.2       $4.5       $6.1       $7.7       $9.5

Other Income                                 0.0        0.2        0.3        0.0        0.0        0.0        0.0        0.0
Interest Income                             (2.5)      (2.8)      (0.7)      (0.1)      (0.1)      (0.1)      (0.1)      (0.2)
Unused Credit Line Fee                       0.0        0.0        0.0        0.0        0.0        0.0        0.0        0.0
Existing Debt Interest Expense               0.0        0.0        0.0        0.0        0.0        0.0        0.0        0.0
Line of Credit Interest Expense              0.0        0.0        0.0        0.0        0.0        0.0        0.0        0.0
Senior Debt - Term A Interest Expense        0.0        0.0        0.0        2.6        2.0        1.4        0.6        0.1
Senior Debt - Term B Interest Expense        0.0        0.0        0.0        0.0        0.0        0.0        0.0        0.0
Sub Debt Interest Expense                    0.0        0.0        0.0        0.0        0.0        0.0        0.0        0.0
  Total Other Expense                       (2.5)      (2.6)      (0.4)       2.6        2.0        1.4        0.6       (0.0)
  Pretax Income                             25.1       10.8        5.8        0.6        2.5        4.7        7.1        9.5

Income Taxes                                 9.8        3.7        2.1        0.2        0.9        1.8        2.7        3.6
  Net Income                               $15.3       $7.1       $3.7       $0.4       $1.6       $2.9       $4.4       $6.0
Project Name
Actual & Projected Balance Sheet
($ in millions, except per share data)

                                          FY December 31,               Current                                  FY December 31,
                                         2006A     2007A      2008P     Adjust.     2008PF     2009P     2010P        2011P      2012P     2013P
Assets
Cash & Equivalents                         $61.5      $50.1     $37.5     ($32.5)       $5.0      $3.0      $4.3         $5.0       $5.0     $15.6
Accounts Receivable                          4.8        4.8       4.8                    4.8       5.0       5.0          5.3        5.5       5.8
Inventory                                   34.8       30.5      25.0                   25.0      30.0      28.1         29.5       30.9      32.5
Prepaid Expenses                             7.2        2.5       5.6                    5.6       6.0       6.1          6.4        6.7       7.1
Other Current Assets                         0.0        0.0       0.0                    0.0       0.0       0.0          0.0        0.0       0.0
  Total Current Assets                     108.3       87.9      73.0      (32.5)       40.5      44.0      43.5         46.2       48.2      61.0

Net PP&E                                    50.5       49.3      46.4                   46.4      41.8      36.8         32.5       27.6      21.9
Existing Goodwill & Intangibles              0.1       11.5      11.4                   11.4      11.4      11.4         11.4       11.4      11.4
Acquisition Goodwill                         0.0        0.0       0.0       37.7        37.7      37.7      37.7         37.7       37.7      37.7
Acquisition Intangibles                      0.0        0.0       0.0        9.4         9.4       8.1       6.7          5.4        4.0       2.7
Other Assets                                 0.3        0.4       0.4                    0.4       0.4       0.4          0.4        0.4       0.5
 Total Assets                             $159.2     $149.1    $131.2      $14.6      $145.8    $143.4    $136.5       $133.6     $129.4    $135.2

Liabilities & Shareholders' Equity
Accounts Payable                           $11.7      $10.5      $7.0                   $7.0     $11.0      $8.9         $9.3       $9.8     $10.3
Accrued Expenses                             1.7        1.9       2.7                    2.7       2.5       2.6          2.7        2.8       3.0
Other Current Liabilities                   11.5       14.3      10.4                   10.4      10.4      10.6         11.1       11.7      12.2
  Total Current Liabilities                 24.9       26.7      20.0        0.0        20.0      23.9      22.0         23.1       24.3      25.5

Other Liabilities                           17.8       16.3      16.5                   16.5      16.8      17.2         18.0       18.9      19.9
Existing Debt                                0.0        5.9       4.7       (4.7)        0.0       0.0       0.0          0.0        0.0       0.0
New Line of Credit                           0.0        0.0       0.0        0.0         0.0       0.0       0.0          0.0        0.0       0.0
New Senior Debt - Term A                     0.0        0.0       0.0       34.8        34.8      27.8      20.9         13.1        2.3       0.0
New Senior Debt - Term B                     0.0        0.0       0.0        0.0         0.0       0.0       0.0          0.0        0.0       0.0
New Sub Debt                                 0.0        0.0       0.0        0.0         0.0       0.0       0.0          0.0        0.0       0.0
Accumulated PIK Interest                     0.0        0.0       0.0                    0.0       0.0       0.0          0.0        0.0       0.0
 Total Liabilities                          42.7       48.9      41.2       30.1        71.3      68.5      60.0         54.2       45.6      45.4

Existing Shareholders' Equity              116.5      100.3      90.0      (90.0)        0.0       0.0       0.0          0.0        0.0       0.0
New Common Stock                             0.0        0.0       0.0       74.5        74.5      74.5      74.5         74.5       74.5      74.5
New Retained Earnings                        0.0        0.0       0.0        0.0         0.0       0.4       1.9          4.9        9.3      15.3
 Total Shareholders' Equity                116.5      100.3      90.0      (15.4)       74.5      74.9      76.5         79.4       83.9      89.8
 Total Liabilities & Shlds. Equity        $159.2     $149.1    $131.2      $14.6      $145.8    $143.4    $136.5       $133.6     $129.4    $135.2
Project Name
Projected Cash Flow Statement
($ in millions, except per share data)
                                                      FY December 31,
                                         2009P    2010P      2011P      2012P     2013P

Net Income                                $0.4     $1.6       $2.9       $4.4      $6.0
Depreciation on Existing Assets           12.0     12.0       12.0       12.0      12.0
Depreciation on New CapEx                  0.0      0.4        1.2        2.1       3.0
Amortization of Intangibles                1.3      1.3        1.3        1.3       1.3
Change in Accounts Receivable             (0.2)    (0.0)      (0.3)      (0.3)     (0.3)
Change in Inventory                       (5.0)     2.0       (1.4)      (1.5)     (1.5)
Change in Prepaid Expenses                (0.4)    (0.1)      (0.3)      (0.3)     (0.3)
Change in Other Assets                    (0.0)    (0.0)      (0.0)      (0.0)     (0.0)
Change in Accounts Payable                 4.0     (2.1)       0.4        0.5       0.5
Change in Accrued Expenses                (0.2)     0.0        0.1        0.1       0.1
Change in Other Liabilities                0.4      0.5        1.4        1.5       1.5
 Cash Flow from Operations               $12.4    $15.6      $17.4      $19.9     $22.3

Capital Expenditures                     ($7.4)   ($7.3)      ($8.9)     ($9.1)   ($9.3)
 Cash Flow from Investing                ($7.4)   ($7.3)      ($8.9)     ($9.1)   ($9.3)

Repayments of Line of Credit              $0.0     $0.0        $0.0       $0.0     $0.0
Repayments of Senior Debt - Term A        (7.0)    (7.0)       (7.8)     (10.7)    (2.3)
Repayments of Senior Debt - Term B         0.0      0.0         0.0        0.0      0.0
Repayments of Sub Debt                     0.0      0.0         0.0        0.0      0.0
Additions to PIK Interest                  0.0      0.0         0.0        0.0      0.0
 Cash Flow from Financing                ($7.0)   ($7.0)      ($7.8)    ($10.7)   ($2.3)

Net Cash Flow                            ($2.0)    $1.3       $0.7       ($0.0)   $10.6
 Beginning Cash & Equivalents              5.0      3.0        4.3         5.0      5.0
Ending Cash & Equivalents                 $3.0     $4.3       $5.0        $5.0    $15.6
Project Name
Projected Debt Schedule
($ in millions, except per share data)
                                                      FY December 31,
                                         2009P    2010P      2011P      2012P    2013P    12 Month LIBOR              2.80%
Cash Flow Available to Repay Debt        $10.0    $11.2      $12.8      $15.7    $18.0
Minimum Cash Balance                       5.0      5.0        5.0        5.0      5.0
 Net Cash Available                       $5.0     $6.2       $7.8      $10.7    $13.0
                                                                                                     Terms
Line of Credit                                                                                       Availability     $17.5
Beginning Balance                         $0.0     $0.0       $0.0       $0.0     $0.0               Unused Fee       0.25%
Borrowings / (Repayment)                   0.0      0.0        0.0        0.0      0.0               Spread            2.8%
Ending Balance                             0.0      0.0        0.0        0.0      0.0               Total Rate        5.6%
Interest Expense                           0.0      0.0        0.0        0.0      0.0               Term            5 years
Unused Credit Line Fee                    $0.0     $0.0       $0.0       $0.0     $0.0               Type              Bullet

Senior Debt - Term A                                                                                 Terms
Beginning Balance                        $34.8    $27.8      $20.9      $13.1     $2.3               Spread            5.5%
Mandatory Amortization                   20.0%    20.0%      20.0%      20.0%    20.0%               Total Rate        8.3%
Mandatory Repayment                       (7.0)    (7.0)      (7.0)      (7.0)    (2.3)              Term            5 years
Additional Repayment                       0.0      0.0       (0.8)      (3.8)     0.0               Type           Amortize
Ending Balance                            27.8     20.9       13.1        2.3      0.0
Net Cash Available                        (2.0)    (0.7)       0.0        0.0     10.6
Interest Expense                          $2.6     $2.0       $1.4       $0.6     $0.1

Senior Debt - Term B                                                                                 Terms
Beginning Balance                         $0.0     $0.0       $0.0       $0.0     $0.0               Spread            6.5%
Mandatory Amortization                    0.0%     0.0%       0.0%       0.0%     0.0%               Total Rate        9.3%
Mandatory Repayment                        0.0      0.0        0.0        0.0      0.0               Term            8 years
Additional Repayment                       0.0      0.0        0.0        0.0      0.0               Type              Bullet
Ending Balance                             0.0      0.0        0.0        0.0      0.0
Net Cash Available                        (2.0)    (0.7)       0.0        0.0     10.6
Interest Expense                          $0.0     $0.0       $0.0       $0.0     $0.0

Sub Debt                                                                                             Terms
Beginning Balance                         $0.0     $0.0       $0.0       $0.0     $0.0               Spread            9.0%
Additional Repayment                       0.0      0.0        0.0        0.0      0.0               Total Rate       11.8%
Ending Balance                             0.0      0.0        0.0        0.0      0.0               PIK Interest      0.0%
Interest Expense                           0.0      0.0        0.0        0.0      0.0               Term           10 years
PIK Interest Expense                      $0.0     $0.0       $0.0       $0.0     $0.0               Type              Bullet

Total Cumulative Interest Expense         $2.6     $4.6       $6.0       $6.7      $6.8
Cumulative Senior Debt Paydown           20.0%    40.0%      62.4%      93.2%    100.0%

Mais conteúdo relacionado

Mais procurados

MIC.CN Stock Pitch
MIC.CN Stock PitchMIC.CN Stock Pitch
MIC.CN Stock PitchR Young
 
fifth third bancorp Q2-07
fifth third bancorp  Q2-07fifth third bancorp  Q2-07
fifth third bancorp Q2-07finance28
 
NLC Stock Pitch - Full Version
NLC Stock Pitch - Full VersionNLC Stock Pitch - Full Version
NLC Stock Pitch - Full VersionR Young
 
leggett & platt 2006_fin_add
leggett & platt 2006_fin_addleggett & platt 2006_fin_add
leggett & platt 2006_fin_addfinance39
 
SLM Q408EarningsStatisticsFinal
SLM  Q408EarningsStatisticsFinalSLM  Q408EarningsStatisticsFinal
SLM Q408EarningsStatisticsFinalfinance42
 
Verizon 4Q 2008 earnings report
Verizon 4Q 2008 earnings reportVerizon 4Q 2008 earnings report
Verizon 4Q 2008 earnings reportearningsreport
 
goodrich 3DA9047D-E6F4-41B8-9EBB-5BC4170B5319_Goodrich2004AR_FINAL
goodrich 3DA9047D-E6F4-41B8-9EBB-5BC4170B5319_Goodrich2004AR_FINALgoodrich 3DA9047D-E6F4-41B8-9EBB-5BC4170B5319_Goodrich2004AR_FINAL
goodrich 3DA9047D-E6F4-41B8-9EBB-5BC4170B5319_Goodrich2004AR_FINALfinance44
 
Real Estate Finance 301: Raising Capital in Today’s Economy – Strategies and ...
Real Estate Finance 301: Raising Capital in Today’s Economy – Strategies and ...Real Estate Finance 301: Raising Capital in Today’s Economy – Strategies and ...
Real Estate Finance 301: Raising Capital in Today’s Economy – Strategies and ...Virtual ULI
 
regions library.corporate
regions library.corporateregions library.corporate
regions library.corporatefinance25
 
SLM Q108EarningsPresentation
SLM  Q108EarningsPresentationSLM  Q108EarningsPresentation
SLM Q108EarningsPresentationfinance42
 
InKnowVision October 2012 HNW Technical Webinar w/ Guest Presenter Bob Scarlata
InKnowVision October 2012 HNW Technical Webinar w/ Guest Presenter Bob ScarlataInKnowVision October 2012 HNW Technical Webinar w/ Guest Presenter Bob Scarlata
InKnowVision October 2012 HNW Technical Webinar w/ Guest Presenter Bob ScarlataInKnowVision
 
nationwide 2Q08 Sub-Prime/Alt-A Disclosure
nationwide 	2Q08 Sub-Prime/Alt-A Disclosurenationwide 	2Q08 Sub-Prime/Alt-A Disclosure
nationwide 2Q08 Sub-Prime/Alt-A Disclosurefinance11
 
williams 2008 AR Final
williams 2008 AR Finalwilliams 2008 AR Final
williams 2008 AR Finalfinance21
 

Mais procurados (13)

MIC.CN Stock Pitch
MIC.CN Stock PitchMIC.CN Stock Pitch
MIC.CN Stock Pitch
 
fifth third bancorp Q2-07
fifth third bancorp  Q2-07fifth third bancorp  Q2-07
fifth third bancorp Q2-07
 
NLC Stock Pitch - Full Version
NLC Stock Pitch - Full VersionNLC Stock Pitch - Full Version
NLC Stock Pitch - Full Version
 
leggett & platt 2006_fin_add
leggett & platt 2006_fin_addleggett & platt 2006_fin_add
leggett & platt 2006_fin_add
 
SLM Q408EarningsStatisticsFinal
SLM  Q408EarningsStatisticsFinalSLM  Q408EarningsStatisticsFinal
SLM Q408EarningsStatisticsFinal
 
Verizon 4Q 2008 earnings report
Verizon 4Q 2008 earnings reportVerizon 4Q 2008 earnings report
Verizon 4Q 2008 earnings report
 
goodrich 3DA9047D-E6F4-41B8-9EBB-5BC4170B5319_Goodrich2004AR_FINAL
goodrich 3DA9047D-E6F4-41B8-9EBB-5BC4170B5319_Goodrich2004AR_FINALgoodrich 3DA9047D-E6F4-41B8-9EBB-5BC4170B5319_Goodrich2004AR_FINAL
goodrich 3DA9047D-E6F4-41B8-9EBB-5BC4170B5319_Goodrich2004AR_FINAL
 
Real Estate Finance 301: Raising Capital in Today’s Economy – Strategies and ...
Real Estate Finance 301: Raising Capital in Today’s Economy – Strategies and ...Real Estate Finance 301: Raising Capital in Today’s Economy – Strategies and ...
Real Estate Finance 301: Raising Capital in Today’s Economy – Strategies and ...
 
regions library.corporate
regions library.corporateregions library.corporate
regions library.corporate
 
SLM Q108EarningsPresentation
SLM  Q108EarningsPresentationSLM  Q108EarningsPresentation
SLM Q108EarningsPresentation
 
InKnowVision October 2012 HNW Technical Webinar w/ Guest Presenter Bob Scarlata
InKnowVision October 2012 HNW Technical Webinar w/ Guest Presenter Bob ScarlataInKnowVision October 2012 HNW Technical Webinar w/ Guest Presenter Bob Scarlata
InKnowVision October 2012 HNW Technical Webinar w/ Guest Presenter Bob Scarlata
 
nationwide 2Q08 Sub-Prime/Alt-A Disclosure
nationwide 	2Q08 Sub-Prime/Alt-A Disclosurenationwide 	2Q08 Sub-Prime/Alt-A Disclosure
nationwide 2Q08 Sub-Prime/Alt-A Disclosure
 
williams 2008 AR Final
williams 2008 AR Finalwilliams 2008 AR Final
williams 2008 AR Final
 

Semelhante a LBO Transaction Summary and Financial Analysis

Mk version2
Mk version2Mk version2
Mk version2owlpics
 
Progressive 2008-AR no Art
Progressive 2008-AR no ArtProgressive 2008-AR no Art
Progressive 2008-AR no Artfinance18
 
leggett & platt 2006_fin_complete
leggett & platt 2006_fin_completeleggett & platt 2006_fin_complete
leggett & platt 2006_fin_completefinance39
 
leggett & platt 2006_fin_complete
leggett & platt 2006_fin_completeleggett & platt 2006_fin_complete
leggett & platt 2006_fin_completefinance39
 
Progressive 2008-3Q
Progressive 2008-3QProgressive 2008-3Q
Progressive 2008-3Qfinance18
 
Progressive 2008-3Q
Progressive 2008-3QProgressive 2008-3Q
Progressive 2008-3Qfinance18
 
Citigroup 2008 Earnings Review
Citigroup 2008 Earnings ReviewCitigroup 2008 Earnings Review
Citigroup 2008 Earnings Reviewearningsreport
 
Progressive 2008-2Q
Progressive 2008-2QProgressive 2008-2Q
Progressive 2008-2Qfinance18
 
omnicom group Q3 2007 Investor Presentation
omnicom group  Q3 2007 Investor Presentationomnicom group  Q3 2007 Investor Presentation
omnicom group Q3 2007 Investor Presentationfinance22
 
constellation energy 2001 Annual Report
constellation energy 2001 Annual Report constellation energy 2001 Annual Report
constellation energy 2001 Annual Report finance12
 
omnicom group Q2 2007 Investor Presentation
omnicom group  Q2 2007 Investor Presentationomnicom group  Q2 2007 Investor Presentation
omnicom group Q2 2007 Investor Presentationfinance22
 
leggett & platt 2006_11yr_data
leggett & platt 2006_11yr_dataleggett & platt 2006_11yr_data
leggett & platt 2006_11yr_datafinance39
 
leggett & platt 2006_11yr_data
leggett & platt 2006_11yr_dataleggett & platt 2006_11yr_data
leggett & platt 2006_11yr_datafinance39
 
Annual Report Bdc
Annual Report BdcAnnual Report Bdc
Annual Report Bdcgineva
 
omnicom group Q4 2008 Investor Presentation
omnicom group  Q4 2008 Investor Presentationomnicom group  Q4 2008 Investor Presentation
omnicom group Q4 2008 Investor Presentationfinance22
 
Progressive Waste Solutions Fourth-Quarter Supplemental Information Package
Progressive Waste Solutions Fourth-Quarter Supplemental Information PackageProgressive Waste Solutions Fourth-Quarter Supplemental Information Package
Progressive Waste Solutions Fourth-Quarter Supplemental Information PackageProgressiveWaste
 
omnicom group Q3 2006 Investor Presentation
omnicom group  Q3 2006 Investor Presentationomnicom group  Q3 2006 Investor Presentation
omnicom group Q3 2006 Investor Presentationfinance22
 
omnicom group Q4 2007 Investor Presentation
omnicom group  Q4 2007 Investor Presentationomnicom group  Q4 2007 Investor Presentation
omnicom group Q4 2007 Investor Presentationfinance22
 

Semelhante a LBO Transaction Summary and Financial Analysis (20)

Sample LBO Model Template
Sample LBO Model TemplateSample LBO Model Template
Sample LBO Model Template
 
Mk version2
Mk version2Mk version2
Mk version2
 
Progressive 2008-AR no Art
Progressive 2008-AR no ArtProgressive 2008-AR no Art
Progressive 2008-AR no Art
 
Financial Snapshot of IBM
Financial Snapshot of IBMFinancial Snapshot of IBM
Financial Snapshot of IBM
 
leggett & platt 2006_fin_complete
leggett & platt 2006_fin_completeleggett & platt 2006_fin_complete
leggett & platt 2006_fin_complete
 
leggett & platt 2006_fin_complete
leggett & platt 2006_fin_completeleggett & platt 2006_fin_complete
leggett & platt 2006_fin_complete
 
Progressive 2008-3Q
Progressive 2008-3QProgressive 2008-3Q
Progressive 2008-3Q
 
Progressive 2008-3Q
Progressive 2008-3QProgressive 2008-3Q
Progressive 2008-3Q
 
Citigroup 2008 Earnings Review
Citigroup 2008 Earnings ReviewCitigroup 2008 Earnings Review
Citigroup 2008 Earnings Review
 
Progressive 2008-2Q
Progressive 2008-2QProgressive 2008-2Q
Progressive 2008-2Q
 
omnicom group Q3 2007 Investor Presentation
omnicom group  Q3 2007 Investor Presentationomnicom group  Q3 2007 Investor Presentation
omnicom group Q3 2007 Investor Presentation
 
constellation energy 2001 Annual Report
constellation energy 2001 Annual Report constellation energy 2001 Annual Report
constellation energy 2001 Annual Report
 
omnicom group Q2 2007 Investor Presentation
omnicom group  Q2 2007 Investor Presentationomnicom group  Q2 2007 Investor Presentation
omnicom group Q2 2007 Investor Presentation
 
leggett & platt 2006_11yr_data
leggett & platt 2006_11yr_dataleggett & platt 2006_11yr_data
leggett & platt 2006_11yr_data
 
leggett & platt 2006_11yr_data
leggett & platt 2006_11yr_dataleggett & platt 2006_11yr_data
leggett & platt 2006_11yr_data
 
Annual Report Bdc
Annual Report BdcAnnual Report Bdc
Annual Report Bdc
 
omnicom group Q4 2008 Investor Presentation
omnicom group  Q4 2008 Investor Presentationomnicom group  Q4 2008 Investor Presentation
omnicom group Q4 2008 Investor Presentation
 
Progressive Waste Solutions Fourth-Quarter Supplemental Information Package
Progressive Waste Solutions Fourth-Quarter Supplemental Information PackageProgressive Waste Solutions Fourth-Quarter Supplemental Information Package
Progressive Waste Solutions Fourth-Quarter Supplemental Information Package
 
omnicom group Q3 2006 Investor Presentation
omnicom group  Q3 2006 Investor Presentationomnicom group  Q3 2006 Investor Presentation
omnicom group Q3 2006 Investor Presentation
 
omnicom group Q4 2007 Investor Presentation
omnicom group  Q4 2007 Investor Presentationomnicom group  Q4 2007 Investor Presentation
omnicom group Q4 2007 Investor Presentation
 

Mais de David Tracy

Presentation Development Primer: Storyboarding, Slide Design
Presentation Development Primer: Storyboarding, Slide DesignPresentation Development Primer: Storyboarding, Slide Design
Presentation Development Primer: Storyboarding, Slide DesignDavid Tracy
 
Building an Enduring Corporate Vision
Building an Enduring Corporate VisionBuilding an Enduring Corporate Vision
Building an Enduring Corporate VisionDavid Tracy
 
Henry Mintzberg's Ten Schools of Thought on Strategic Management
Henry Mintzberg's Ten Schools of Thought on Strategic ManagementHenry Mintzberg's Ten Schools of Thought on Strategic Management
Henry Mintzberg's Ten Schools of Thought on Strategic ManagementDavid Tracy
 
Psychology of Consumer Product Adoption
Psychology of Consumer Product AdoptionPsychology of Consumer Product Adoption
Psychology of Consumer Product AdoptionDavid Tracy
 
Transformation Maps
Transformation MapsTransformation Maps
Transformation MapsDavid Tracy
 
Strategic Analysis Framework
Strategic Analysis FrameworkStrategic Analysis Framework
Strategic Analysis FrameworkDavid Tracy
 
Balanced Scorecard
Balanced ScorecardBalanced Scorecard
Balanced ScorecardDavid Tracy
 
Pricing Curves Diagrams
Pricing Curves DiagramsPricing Curves Diagrams
Pricing Curves DiagramsDavid Tracy
 
Business Strategy and Management Models
Business Strategy and Management ModelsBusiness Strategy and Management Models
Business Strategy and Management ModelsDavid Tracy
 
New Technology Business Case
New Technology Business CaseNew Technology Business Case
New Technology Business CaseDavid Tracy
 
Flevy.com - World's First Research Report-cum-Financial Model
Flevy.com - World's First Research Report-cum-Financial ModelFlevy.com - World's First Research Report-cum-Financial Model
Flevy.com - World's First Research Report-cum-Financial ModelDavid Tracy
 
Flevy.com - Staff Demand and Shift Bidding
Flevy.com - Staff Demand and Shift BiddingFlevy.com - Staff Demand and Shift Bidding
Flevy.com - Staff Demand and Shift BiddingDavid Tracy
 
Flevy.com - Business Presentation Template
Flevy.com - Business Presentation TemplateFlevy.com - Business Presentation Template
Flevy.com - Business Presentation TemplateDavid Tracy
 
Flevy.com - Strategic Innovation Management Framework
Flevy.com - Strategic Innovation Management FrameworkFlevy.com - Strategic Innovation Management Framework
Flevy.com - Strategic Innovation Management FrameworkDavid Tracy
 
Flevy.com - Feasibility Study Template for Electronic Software Distribution
Flevy.com - Feasibility Study Template for Electronic Software DistributionFlevy.com - Feasibility Study Template for Electronic Software Distribution
Flevy.com - Feasibility Study Template for Electronic Software DistributionDavid Tracy
 
Flevy.com - Feasibility Study for an eMail Archiving solution
Flevy.com - Feasibility Study for an eMail Archiving solutionFlevy.com - Feasibility Study for an eMail Archiving solution
Flevy.com - Feasibility Study for an eMail Archiving solutionDavid Tracy
 
Flevy.com - Paycheck Stub Template
Flevy.com - Paycheck Stub TemplateFlevy.com - Paycheck Stub Template
Flevy.com - Paycheck Stub TemplateDavid Tracy
 
Flevy.com - Account Management Templates
Flevy.com - Account Management TemplatesFlevy.com - Account Management Templates
Flevy.com - Account Management TemplatesDavid Tracy
 
Flevy.com - Core Competencies Analysis
Flevy.com - Core Competencies AnalysisFlevy.com - Core Competencies Analysis
Flevy.com - Core Competencies AnalysisDavid Tracy
 
Flevy.com - Cost Drivers Analysis
Flevy.com - Cost Drivers AnalysisFlevy.com - Cost Drivers Analysis
Flevy.com - Cost Drivers AnalysisDavid Tracy
 

Mais de David Tracy (20)

Presentation Development Primer: Storyboarding, Slide Design
Presentation Development Primer: Storyboarding, Slide DesignPresentation Development Primer: Storyboarding, Slide Design
Presentation Development Primer: Storyboarding, Slide Design
 
Building an Enduring Corporate Vision
Building an Enduring Corporate VisionBuilding an Enduring Corporate Vision
Building an Enduring Corporate Vision
 
Henry Mintzberg's Ten Schools of Thought on Strategic Management
Henry Mintzberg's Ten Schools of Thought on Strategic ManagementHenry Mintzberg's Ten Schools of Thought on Strategic Management
Henry Mintzberg's Ten Schools of Thought on Strategic Management
 
Psychology of Consumer Product Adoption
Psychology of Consumer Product AdoptionPsychology of Consumer Product Adoption
Psychology of Consumer Product Adoption
 
Transformation Maps
Transformation MapsTransformation Maps
Transformation Maps
 
Strategic Analysis Framework
Strategic Analysis FrameworkStrategic Analysis Framework
Strategic Analysis Framework
 
Balanced Scorecard
Balanced ScorecardBalanced Scorecard
Balanced Scorecard
 
Pricing Curves Diagrams
Pricing Curves DiagramsPricing Curves Diagrams
Pricing Curves Diagrams
 
Business Strategy and Management Models
Business Strategy and Management ModelsBusiness Strategy and Management Models
Business Strategy and Management Models
 
New Technology Business Case
New Technology Business CaseNew Technology Business Case
New Technology Business Case
 
Flevy.com - World's First Research Report-cum-Financial Model
Flevy.com - World's First Research Report-cum-Financial ModelFlevy.com - World's First Research Report-cum-Financial Model
Flevy.com - World's First Research Report-cum-Financial Model
 
Flevy.com - Staff Demand and Shift Bidding
Flevy.com - Staff Demand and Shift BiddingFlevy.com - Staff Demand and Shift Bidding
Flevy.com - Staff Demand and Shift Bidding
 
Flevy.com - Business Presentation Template
Flevy.com - Business Presentation TemplateFlevy.com - Business Presentation Template
Flevy.com - Business Presentation Template
 
Flevy.com - Strategic Innovation Management Framework
Flevy.com - Strategic Innovation Management FrameworkFlevy.com - Strategic Innovation Management Framework
Flevy.com - Strategic Innovation Management Framework
 
Flevy.com - Feasibility Study Template for Electronic Software Distribution
Flevy.com - Feasibility Study Template for Electronic Software DistributionFlevy.com - Feasibility Study Template for Electronic Software Distribution
Flevy.com - Feasibility Study Template for Electronic Software Distribution
 
Flevy.com - Feasibility Study for an eMail Archiving solution
Flevy.com - Feasibility Study for an eMail Archiving solutionFlevy.com - Feasibility Study for an eMail Archiving solution
Flevy.com - Feasibility Study for an eMail Archiving solution
 
Flevy.com - Paycheck Stub Template
Flevy.com - Paycheck Stub TemplateFlevy.com - Paycheck Stub Template
Flevy.com - Paycheck Stub Template
 
Flevy.com - Account Management Templates
Flevy.com - Account Management TemplatesFlevy.com - Account Management Templates
Flevy.com - Account Management Templates
 
Flevy.com - Core Competencies Analysis
Flevy.com - Core Competencies AnalysisFlevy.com - Core Competencies Analysis
Flevy.com - Core Competencies Analysis
 
Flevy.com - Cost Drivers Analysis
Flevy.com - Cost Drivers AnalysisFlevy.com - Cost Drivers Analysis
Flevy.com - Cost Drivers Analysis
 

Último

GUIDELINES ON USEFUL FORMS IN FREIGHT FORWARDING (F) Danny Diep Toh MBA.pdf
GUIDELINES ON USEFUL FORMS IN FREIGHT FORWARDING (F) Danny Diep Toh MBA.pdfGUIDELINES ON USEFUL FORMS IN FREIGHT FORWARDING (F) Danny Diep Toh MBA.pdf
GUIDELINES ON USEFUL FORMS IN FREIGHT FORWARDING (F) Danny Diep Toh MBA.pdfDanny Diep To
 
Entrepreneurship lessons in Philippines
Entrepreneurship lessons in  PhilippinesEntrepreneurship lessons in  Philippines
Entrepreneurship lessons in PhilippinesDavidSamuel525586
 
Effective Strategies for Maximizing Your Profit When Selling Gold Jewelry
Effective Strategies for Maximizing Your Profit When Selling Gold JewelryEffective Strategies for Maximizing Your Profit When Selling Gold Jewelry
Effective Strategies for Maximizing Your Profit When Selling Gold JewelryWhittensFineJewelry1
 
Introducing the Analogic framework for business planning applications
Introducing the Analogic framework for business planning applicationsIntroducing the Analogic framework for business planning applications
Introducing the Analogic framework for business planning applicationsKnowledgeSeed
 
Fordham -How effective decision-making is within the IT department - Analysis...
Fordham -How effective decision-making is within the IT department - Analysis...Fordham -How effective decision-making is within the IT department - Analysis...
Fordham -How effective decision-making is within the IT department - Analysis...Peter Ward
 
trending-flavors-and-ingredients-in-salty-snacks-us-2024_Redacted-V2.pdf
trending-flavors-and-ingredients-in-salty-snacks-us-2024_Redacted-V2.pdftrending-flavors-and-ingredients-in-salty-snacks-us-2024_Redacted-V2.pdf
trending-flavors-and-ingredients-in-salty-snacks-us-2024_Redacted-V2.pdfMintel Group
 
APRIL2024_UKRAINE_xml_0000000000000 .pdf
APRIL2024_UKRAINE_xml_0000000000000 .pdfAPRIL2024_UKRAINE_xml_0000000000000 .pdf
APRIL2024_UKRAINE_xml_0000000000000 .pdfRbc Rbcua
 
Memorándum de Entendimiento (MoU) entre Codelco y SQM
Memorándum de Entendimiento (MoU) entre Codelco y SQMMemorándum de Entendimiento (MoU) entre Codelco y SQM
Memorándum de Entendimiento (MoU) entre Codelco y SQMVoces Mineras
 
Lucia Ferretti, Lead Business Designer; Matteo Meschini, Business Designer @T...
Lucia Ferretti, Lead Business Designer; Matteo Meschini, Business Designer @T...Lucia Ferretti, Lead Business Designer; Matteo Meschini, Business Designer @T...
Lucia Ferretti, Lead Business Designer; Matteo Meschini, Business Designer @T...Associazione Digital Days
 
Intermediate Accounting, Volume 2, 13th Canadian Edition by Donald E. Kieso t...
Intermediate Accounting, Volume 2, 13th Canadian Edition by Donald E. Kieso t...Intermediate Accounting, Volume 2, 13th Canadian Edition by Donald E. Kieso t...
Intermediate Accounting, Volume 2, 13th Canadian Edition by Donald E. Kieso t...ssuserf63bd7
 
Pitch Deck Teardown: Xpanceo's $40M Seed deck
Pitch Deck Teardown: Xpanceo's $40M Seed deckPitch Deck Teardown: Xpanceo's $40M Seed deck
Pitch Deck Teardown: Xpanceo's $40M Seed deckHajeJanKamps
 
Horngren’s Financial & Managerial Accounting, 7th edition by Miller-Nobles so...
Horngren’s Financial & Managerial Accounting, 7th edition by Miller-Nobles so...Horngren’s Financial & Managerial Accounting, 7th edition by Miller-Nobles so...
Horngren’s Financial & Managerial Accounting, 7th edition by Miller-Nobles so...ssuserf63bd7
 
20220816-EthicsGrade_Scorecard-JP_Morgan_Chase-Q2-63_57.pdf
20220816-EthicsGrade_Scorecard-JP_Morgan_Chase-Q2-63_57.pdf20220816-EthicsGrade_Scorecard-JP_Morgan_Chase-Q2-63_57.pdf
20220816-EthicsGrade_Scorecard-JP_Morgan_Chase-Q2-63_57.pdfChris Skinner
 
Onemonitar Android Spy App Features: Explore Advanced Monitoring Capabilities
Onemonitar Android Spy App Features: Explore Advanced Monitoring CapabilitiesOnemonitar Android Spy App Features: Explore Advanced Monitoring Capabilities
Onemonitar Android Spy App Features: Explore Advanced Monitoring CapabilitiesOne Monitar
 
PSCC - Capability Statement Presentation
PSCC - Capability Statement PresentationPSCC - Capability Statement Presentation
PSCC - Capability Statement PresentationAnamaria Contreras
 
Technical Leaders - Working with the Management Team
Technical Leaders - Working with the Management TeamTechnical Leaders - Working with the Management Team
Technical Leaders - Working with the Management TeamArik Fletcher
 
Guide Complete Set of Residential Architectural Drawings PDF
Guide Complete Set of Residential Architectural Drawings PDFGuide Complete Set of Residential Architectural Drawings PDF
Guide Complete Set of Residential Architectural Drawings PDFChandresh Chudasama
 
Go for Rakhi Bazaar and Pick the Latest Bhaiya Bhabhi Rakhi.pptx
Go for Rakhi Bazaar and Pick the Latest Bhaiya Bhabhi Rakhi.pptxGo for Rakhi Bazaar and Pick the Latest Bhaiya Bhabhi Rakhi.pptx
Go for Rakhi Bazaar and Pick the Latest Bhaiya Bhabhi Rakhi.pptxRakhi Bazaar
 

Último (20)

GUIDELINES ON USEFUL FORMS IN FREIGHT FORWARDING (F) Danny Diep Toh MBA.pdf
GUIDELINES ON USEFUL FORMS IN FREIGHT FORWARDING (F) Danny Diep Toh MBA.pdfGUIDELINES ON USEFUL FORMS IN FREIGHT FORWARDING (F) Danny Diep Toh MBA.pdf
GUIDELINES ON USEFUL FORMS IN FREIGHT FORWARDING (F) Danny Diep Toh MBA.pdf
 
The Bizz Quiz-E-Summit-E-Cell-IITPatna.pptx
The Bizz Quiz-E-Summit-E-Cell-IITPatna.pptxThe Bizz Quiz-E-Summit-E-Cell-IITPatna.pptx
The Bizz Quiz-E-Summit-E-Cell-IITPatna.pptx
 
Entrepreneurship lessons in Philippines
Entrepreneurship lessons in  PhilippinesEntrepreneurship lessons in  Philippines
Entrepreneurship lessons in Philippines
 
Effective Strategies for Maximizing Your Profit When Selling Gold Jewelry
Effective Strategies for Maximizing Your Profit When Selling Gold JewelryEffective Strategies for Maximizing Your Profit When Selling Gold Jewelry
Effective Strategies for Maximizing Your Profit When Selling Gold Jewelry
 
Introducing the Analogic framework for business planning applications
Introducing the Analogic framework for business planning applicationsIntroducing the Analogic framework for business planning applications
Introducing the Analogic framework for business planning applications
 
Fordham -How effective decision-making is within the IT department - Analysis...
Fordham -How effective decision-making is within the IT department - Analysis...Fordham -How effective decision-making is within the IT department - Analysis...
Fordham -How effective decision-making is within the IT department - Analysis...
 
trending-flavors-and-ingredients-in-salty-snacks-us-2024_Redacted-V2.pdf
trending-flavors-and-ingredients-in-salty-snacks-us-2024_Redacted-V2.pdftrending-flavors-and-ingredients-in-salty-snacks-us-2024_Redacted-V2.pdf
trending-flavors-and-ingredients-in-salty-snacks-us-2024_Redacted-V2.pdf
 
APRIL2024_UKRAINE_xml_0000000000000 .pdf
APRIL2024_UKRAINE_xml_0000000000000 .pdfAPRIL2024_UKRAINE_xml_0000000000000 .pdf
APRIL2024_UKRAINE_xml_0000000000000 .pdf
 
Memorándum de Entendimiento (MoU) entre Codelco y SQM
Memorándum de Entendimiento (MoU) entre Codelco y SQMMemorándum de Entendimiento (MoU) entre Codelco y SQM
Memorándum de Entendimiento (MoU) entre Codelco y SQM
 
Lucia Ferretti, Lead Business Designer; Matteo Meschini, Business Designer @T...
Lucia Ferretti, Lead Business Designer; Matteo Meschini, Business Designer @T...Lucia Ferretti, Lead Business Designer; Matteo Meschini, Business Designer @T...
Lucia Ferretti, Lead Business Designer; Matteo Meschini, Business Designer @T...
 
Intermediate Accounting, Volume 2, 13th Canadian Edition by Donald E. Kieso t...
Intermediate Accounting, Volume 2, 13th Canadian Edition by Donald E. Kieso t...Intermediate Accounting, Volume 2, 13th Canadian Edition by Donald E. Kieso t...
Intermediate Accounting, Volume 2, 13th Canadian Edition by Donald E. Kieso t...
 
WAM Corporate Presentation April 12 2024.pdf
WAM Corporate Presentation April 12 2024.pdfWAM Corporate Presentation April 12 2024.pdf
WAM Corporate Presentation April 12 2024.pdf
 
Pitch Deck Teardown: Xpanceo's $40M Seed deck
Pitch Deck Teardown: Xpanceo's $40M Seed deckPitch Deck Teardown: Xpanceo's $40M Seed deck
Pitch Deck Teardown: Xpanceo's $40M Seed deck
 
Horngren’s Financial & Managerial Accounting, 7th edition by Miller-Nobles so...
Horngren’s Financial & Managerial Accounting, 7th edition by Miller-Nobles so...Horngren’s Financial & Managerial Accounting, 7th edition by Miller-Nobles so...
Horngren’s Financial & Managerial Accounting, 7th edition by Miller-Nobles so...
 
20220816-EthicsGrade_Scorecard-JP_Morgan_Chase-Q2-63_57.pdf
20220816-EthicsGrade_Scorecard-JP_Morgan_Chase-Q2-63_57.pdf20220816-EthicsGrade_Scorecard-JP_Morgan_Chase-Q2-63_57.pdf
20220816-EthicsGrade_Scorecard-JP_Morgan_Chase-Q2-63_57.pdf
 
Onemonitar Android Spy App Features: Explore Advanced Monitoring Capabilities
Onemonitar Android Spy App Features: Explore Advanced Monitoring CapabilitiesOnemonitar Android Spy App Features: Explore Advanced Monitoring Capabilities
Onemonitar Android Spy App Features: Explore Advanced Monitoring Capabilities
 
PSCC - Capability Statement Presentation
PSCC - Capability Statement PresentationPSCC - Capability Statement Presentation
PSCC - Capability Statement Presentation
 
Technical Leaders - Working with the Management Team
Technical Leaders - Working with the Management TeamTechnical Leaders - Working with the Management Team
Technical Leaders - Working with the Management Team
 
Guide Complete Set of Residential Architectural Drawings PDF
Guide Complete Set of Residential Architectural Drawings PDFGuide Complete Set of Residential Architectural Drawings PDF
Guide Complete Set of Residential Architectural Drawings PDF
 
Go for Rakhi Bazaar and Pick the Latest Bhaiya Bhabhi Rakhi.pptx
Go for Rakhi Bazaar and Pick the Latest Bhaiya Bhabhi Rakhi.pptxGo for Rakhi Bazaar and Pick the Latest Bhaiya Bhabhi Rakhi.pptx
Go for Rakhi Bazaar and Pick the Latest Bhaiya Bhabhi Rakhi.pptx
 

LBO Transaction Summary and Financial Analysis

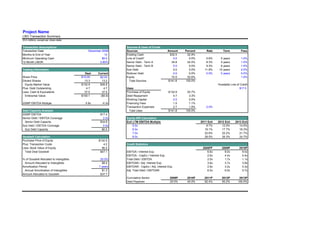
  • 1. Project Name LBO Transaction Summary ($ in millions, except per share data) Transaction Assumptions Sources & Uses of Funds Transaction Date December 2008 Sources Amount Percent Rate Term Fees Months to End of Year 12 Existing Cash $32.5 22.9% Minimum Operating Cash $5.0 Line of Credit* 0.0 0.0% 5.6% 5 years 1.5% 12 Month LIBOR 2.80% Senior Debt - Term A 34.8 24.5% 8.3% 5 years 1.5% Senior Debt - Term B 0.0 0.0% 9.3% 8 years 1.5% Trading Information Sub Debt 0.0 0.0% 11.8% 10 years 2.0% Deal Current Rollover Debt 0.0 0.0% 0.0% 0 years 0.0% Share Price $10.00 $2.03 Equity 74.5 52.6% 1.0% Diluted Shares 13.3 13.2 Total Sources $141.8 100.0% Equity Market Value $132.9 $26.9 *Available Line of Credit Plus: Debt Outstanding 4.7 4.7 Uses $17.5 Less: Cash & Equivalents 37.5 37.5 Purchase of Equity $132.9 93.7% Enterprise Value $100.1 ($5.9) Debt Repayment 4.7 3.3% Working Capital 0.0 0.0% 2008P EBITDA Multiple 5.8x -0.3x Financing Fees 1.5 1.1% Transaction Expenses 2.7 1.9% 2.0% Debt Capacity Analysis Total Uses $141.8 100.0% 2008P EBITDA $17.4 Senior Debt / EBITDA Coverage 2.0x Equity IRR Calculation Senior Debt Capacity $34.8 Exit LTM EBITDA Multiple 2011 Exit 2012 Exit 2013 Exit Sub Debt / EBITDA Coverage 0.0x 5.0x 8.7% 12.5% 14.5% Sub Debt Capacity $0.0 6.0x 16.1% 17.7% 18.3% 7.0x 22.6% 22.2% 21.7% Goodwill Calculation 8.0x 28.5% 26.3% 24.7% Purchase Price of Equity $132.9 Plus: Transaction Costs 4.2 Credit Statistics Less: Book Value of Equity 90.0 2008PF 2009P 2010P Total Deal Goodwill $47.1 EBITDA / Interest Exp. 6.6x 8.0x 9.0x EBITDA - CapEx / Interest Exp. 2.6x 4.4x 5.4x % of Goodwill Allocated to Intangibles 20.0% Total Debt / EBITDA 2.0x 1.7x 1.1x Amount Allocated to Intangibles $9.4 EBITDAR / Adj. Interest Exp. 3.6x 3.7x 3.9x Amortization Period 7 years EBITDAR - CapEx / Adj. Interest Exp. 2.9x 3.2x 3.3x Annual Amortization of Intangibles $1.3 Adj. Total Debt / EBITDAR 6.0x 6.0x 5.7x Amount Allocated to Goodwill $37.7 Cumulative Senior 2009P 2010P 2011P 2012P 2013P Debt Paydown 20.0% 40.0% 62.4% 93.2% 100.0%
  • 2. Project Name Returns Analysis ($ in millions, except per share data) 2011 Exit Analysis Sensitivity Analysis - 2011 Exit Years to Exit 3.0 Price LTM EBITDA Exit Multiple Premium Exit EBITDA Multiple 5.0x 6.0x 7.0x 8.0x 8.7% 5.0x 6.0x 7.0x Exit LTM EBITDA 20.6 20.6 20.6 20.6 $8.00 8.7% 8.7% 8.7% 294.1% Implied Enterprise Value $103.0 $123.6 $144.2 $164.7 $9.00 8.7% 8.7% 8.7% 343.3% $10.00 8.7% 8.7% 8.7% 392.6% Less: Debt Outstanding 13.1 13.1 13.1 13.1 $11.00 8.7% 8.7% 8.7% 441.9% Plus: Cash & Equivalents 5.0 5.0 5.0 5.0 $12.00 8.7% 8.7% 8.7% 491.1% Implied Equity Value $94.9 $115.5 $136.1 $156.7 Implied IRR 8.7% 16.1% 22.6% 28.5% Implied Return Multiple 1.3x 1.5x 1.8x 2.1x 2012 Exit Analysis Sensitivity Analysis - 2012 Exit Years to Exit 4.0 Price LTM EBITDA Exit Multiple Premium Exit EBITDA Multiple 5.0x 6.0x 7.0x 8.0x 12.5% 5.0x 6.0x 7.0x Exit LTM EBITDA 23.1 23.1 23.1 23.1 $8.00 12.5% 12.5% 12.5% 294.1% Implied Enterprise Value $115.7 $138.9 $162.0 $185.2 $9.00 12.5% 12.5% 12.5% 343.3% $10.00 12.5% 12.5% 12.5% 392.6% Less: Debt Outstanding 2.3 2.3 2.3 2.3 $11.00 12.5% 12.5% 12.5% 441.9% Plus: Cash & Equivalents 5.0 5.0 5.0 5.0 $12.00 12.5% 12.5% 12.5% 491.1% Implied Equity Value $118.4 $141.5 $164.7 $187.8 Implied IRR 12.5% 17.7% 22.2% 26.3% Implied Return Multiple 1.6x 1.9x 2.2x 2.5x 2013 Exit Analysis Sensitivity Analysis - 2013 Exit Years to Exit 5.0 Price LTM EBITDA Exit Multiple Premium Exit EBITDA Multiple 5.0x 6.0x 7.0x 8.0x 14.5% 5.0x 6.0x 7.0x Exit LTM EBITDA 25.9 25.9 25.9 25.9 $8.00 14.5% 14.5% 14.5% 294.1% Implied Enterprise Value $129.6 $155.5 $181.4 $207.3 $9.00 14.5% 14.5% 14.5% 343.3% $10.00 14.5% 14.5% 14.5% 392.6% Less: Debt Outstanding 0.0 0.0 0.0 0.0 $11.00 14.5% 14.5% 14.5% 441.9% Plus: Cash & Equivalents 15.6 15.6 15.6 15.6 $12.00 14.5% 14.5% 14.5% 491.1% Implied Equity Value $145.2 $171.1 $197.0 $222.9 Implied IRR 14.5% 18.3% 21.7% 24.7% Implied Return Multiple 1.9x 2.3x 2.6x 3.0x
  • 3. Project Name Summary Financials and Credit Analysis ($ in millions, except per share data) FY December 31, 2008PF 2009P 2010P 2011P 2012P 2013P Unadjusted Operating Statistics Revenue $274.0 $271.5 $276.9 $290.8 $305.3 $320.6 EBITDA 17.4 16.5 18.2 20.6 23.1 25.9 EBIT 5.4 3.2 4.5 6.1 7.7 9.5 Capital Expenditures 10.5 7.4 7.3 8.9 9.1 9.3 Interest Expense 2.6 2.1 2.0 1.4 0.6 0.1 Total Debt 34.8 27.8 20.9 13.1 2.3 0.0 Total Capitalization 109.3 102.7 97.3 92.5 86.2 89.8 Unadjusted Credit Statistics EBITDA / Interest Expense 6.6x 8.0x 9.0x 14.6x 36.2x 265.7x EBITDA - CapEx / Interest Expense 2.6x 4.4x 5.4x 0.5x 3.3x N.A. Total Debt / EBITDA 2.0x 1.7x 1.1x 0.6x 0.1x 0.0x Total Debt / Total Capitalization 31.8% 27.1% 21.4% 14.1% 2.7% 0.0% Cumulative Senior Debt Paydown 20.0% 40.0% 62.4% 93.2% 100.0% Adjusted Operating Statistics EBITDAR $53.3 $52.1 $54.5 $58.7 $63.2 $67.9 Adjusted Interest Expense 14.6 13.9 14.1 14.1 14.0 14.1 Adjusted Total Debt 322.1 312.5 311.2 317.9 322.5 336.1 Adjusted Total Capitalization 396.6 387.4 387.7 397.4 406.3 425.9 Adjusted Credit Statistics EBITDAR / Adj. Interest Exp. 3.6x 3.7x 3.9x 4.2x 4.5x 4.8x EBITDAR - CapEx / Adj. Interest Exp. 2.9x 3.2x 3.3x 3.5x 3.9x 4.2x Adj. Total Debt / EBITDAR 6.0x 6.0x 5.7x 5.4x 5.1x 4.9x Adj. Total Debt / Adj. Total Cap. 81.2% 80.7% 80.3% 80.0% 79.4% 78.9% Adjustment Calculations Rent Expense $35.9 $35.6 $36.3 $38.1 $40.0 $42.0 Rent Factor 8.0x 8.0x 8.0x 8.0x 8.0x 8.0x Adjustment to Total Debt $287.3 $284.7 $290.4 $304.9 $320.1 $336.1 Expense Attributable to Interest 33.3% 33.3% 33.3% 33.3% 33.3% 33.3% Adjustment to Interest Expense $12.0 $11.9 $12.1 $12.7 $13.3 $14.0
  • 4. Project Name Operating Assumptions ($ in millions, except per share data) FY December 31, FY December 31, 2006A 2007A 2008P 2009P 2010P 2011P 2012P 2013P Income Statement Revenue Growth 0.0% 3.2% (0.1%) (0.9%) 2.0% 5.0% 5.0% 5.0% EBITDA Growth (12.2%) (40.0%) (14.7%) (5.0%) 10.4% 13.0% 12.4% 11.9% Net Income Growth (13.6%) (53.7%) (47.9%) (90.0%) 324.5% 86.8% 51.7% 34.1% COGS (% of Revenue) 50.5% 53.7% 55.5% 56.0% 56.0% 56.0% 56.0% 56.0% SG&A (% of Revenue) 23.2% 25.7% 25.0% 24.8% 24.3% 23.8% 23.3% 22.8% Rent Expense (% of Revenue) 13.5% 13.1% 13.1% 13.1% 13.1% 13.1% 13.1% 13.1% Interest Income (% of Cash) 4.9% 1.6% 1.6% 1.6% 1.6% 1.6% 1.6% Other Income (% of Revenue) 0.0% (0.1%) (0.1%) 0.0% 0.0% 0.0% 0.0% 0.0% Effective Tax Rate 39.0% 34.6% 36.6% 37.5% 37.5% 37.5% 37.5% 37.5% Gross Margin 49.5% 46.3% 44.5% 44.0% 44.0% 44.0% 44.0% 44.0% EBITDA Margin 12.8% 7.4% 6.3% 6.1% 6.6% 7.1% 7.6% 8.1% Net Income Margin 5.8% 2.6% 1.3% 0.1% 0.6% 1.0% 1.5% 1.9% Balance Sheet Accounts Receivable Days 6.4 6.4 6.6 6.6 6.6 6.6 6.6 Inventory Turnover 4.5x 5.5x 5.5x 5.5x 5.5x 5.5x 5.5x Prepaid Expenses (% of Revenue) 2.7% 0.9% 2.0% 2.2% 2.2% 2.2% 2.2% 2.2% Other Current Assets (% of Revenue) 0.0% 0.0% 0.0% 0.0% 0.0% 0.0% 0.0% 0.0% Other Assets (% of Revenue) 0.1% 0.1% 0.1% 0.1% 0.1% 0.1% 0.1% 0.1% Accounts Payable Days 28.3 21.8 20.9 20.9 20.9 20.9 20.9 Accrued Expenses (% of Revenues) 0.6% 0.7% 1.0% 0.9% 0.9% 0.9% 0.9% 0.9% Other Current Liabilities (% of Revenue) 4.3% 5.2% 3.8% 3.8% 3.8% 3.8% 3.8% 3.8% Other Liabilities (% of Revenue) 6.7% 5.9% 6.0% 6.2% 6.2% 6.2% 6.2% 6.2% Store Buildout Beginning Number of Stores 306 296 297 295 292 297 307 317 New Stores 17 10 14 5 5 10 10 10 Closed Stores 27 9 16 8 0 0 0 0 Stores Opened, net (10) 1 (2) (3) 5 10 10 10 Ending Number of Stores 296 297 295 292 297 307 317 327 Net Store Growth -3.3% 0.3% -0.7% -1.0% 1.7% 3.4% 3.3% 3.2% New Store Capex $5.1 $3.0 $4.2 $1.5 $1.5 $3.0 $3.0 $3.0 Capex per New Store $0.3 $0.3 $0.3 $0.3 $0.3 $0.3 $0.3 $0.3 Maintenance Capex $7.2 $9.1 $6.3 $5.9 $5.8 $5.9 $6.1 $6.3 Maintenance Capex, per Existing Store $0.02 $0.03 $0.02 $0.02 $0.02 $0.02 $0.02 $0.02 Total Capex $12.3 $12.1 $10.5 $7.4 $7.3 $8.9 $9.1 $9.3
  • 5. Project Name Actual & Projected Income Statement ($ in millions, except per share data) FY December 31, FY December 31, 2006A 2007A 2008P 2009P 2010P 2011P 2012P 2013P Revenue $265.9 $274.5 $274.0 $271.5 $276.9 $290.8 $305.3 $320.6 COGS 134.2 147.5 152.2 152.1 155.2 162.9 171.1 179.6 Gross Profit 131.7 127.0 121.9 119.4 121.8 127.9 134.3 141.0 SG&A 61.8 70.7 68.6 67.3 67.3 69.2 71.1 73.1 EBITDAR $69.9 $56.3 $53.3 $52.1 $54.5 $58.7 $63.2 $67.9 Rent Expense 36.0 36.0 35.9 35.6 36.3 38.1 40.0 42.0 EBITDA $33.9 $20.4 $17.4 $16.5 $18.2 $20.6 $23.1 $25.9 Depreciation of Existing Assets 11.4 12.1 12.0 12.0 12.0 12.0 12.0 12.0 Depreciation of New CapEx 0.0 0.0 0.0 0.0 0.4 1.2 2.1 3.0 Amortization of Intangibles 0.0 0.0 0.0 1.3 1.3 1.3 1.3 1.3 Total D&A 11.4 12.1 12.0 13.3 13.7 14.5 15.4 16.4 EBIT $22.6 $8.2 $5.4 $3.2 $4.5 $6.1 $7.7 $9.5 Other Income 0.0 0.2 0.3 0.0 0.0 0.0 0.0 0.0 Interest Income (2.5) (2.8) (0.7) (0.1) (0.1) (0.1) (0.1) (0.2) Unused Credit Line Fee 0.0 0.0 0.0 0.0 0.0 0.0 0.0 0.0 Existing Debt Interest Expense 0.0 0.0 0.0 0.0 0.0 0.0 0.0 0.0 Line of Credit Interest Expense 0.0 0.0 0.0 0.0 0.0 0.0 0.0 0.0 Senior Debt - Term A Interest Expense 0.0 0.0 0.0 2.6 2.0 1.4 0.6 0.1 Senior Debt - Term B Interest Expense 0.0 0.0 0.0 0.0 0.0 0.0 0.0 0.0 Sub Debt Interest Expense 0.0 0.0 0.0 0.0 0.0 0.0 0.0 0.0 Total Other Expense (2.5) (2.6) (0.4) 2.6 2.0 1.4 0.6 (0.0) Pretax Income 25.1 10.8 5.8 0.6 2.5 4.7 7.1 9.5 Income Taxes 9.8 3.7 2.1 0.2 0.9 1.8 2.7 3.6 Net Income $15.3 $7.1 $3.7 $0.4 $1.6 $2.9 $4.4 $6.0
  • 6. Project Name Actual & Projected Balance Sheet ($ in millions, except per share data) FY December 31, Current FY December 31, 2006A 2007A 2008P Adjust. 2008PF 2009P 2010P 2011P 2012P 2013P Assets Cash & Equivalents $61.5 $50.1 $37.5 ($32.5) $5.0 $3.0 $4.3 $5.0 $5.0 $15.6 Accounts Receivable 4.8 4.8 4.8 4.8 5.0 5.0 5.3 5.5 5.8 Inventory 34.8 30.5 25.0 25.0 30.0 28.1 29.5 30.9 32.5 Prepaid Expenses 7.2 2.5 5.6 5.6 6.0 6.1 6.4 6.7 7.1 Other Current Assets 0.0 0.0 0.0 0.0 0.0 0.0 0.0 0.0 0.0 Total Current Assets 108.3 87.9 73.0 (32.5) 40.5 44.0 43.5 46.2 48.2 61.0 Net PP&E 50.5 49.3 46.4 46.4 41.8 36.8 32.5 27.6 21.9 Existing Goodwill & Intangibles 0.1 11.5 11.4 11.4 11.4 11.4 11.4 11.4 11.4 Acquisition Goodwill 0.0 0.0 0.0 37.7 37.7 37.7 37.7 37.7 37.7 37.7 Acquisition Intangibles 0.0 0.0 0.0 9.4 9.4 8.1 6.7 5.4 4.0 2.7 Other Assets 0.3 0.4 0.4 0.4 0.4 0.4 0.4 0.4 0.5 Total Assets $159.2 $149.1 $131.2 $14.6 $145.8 $143.4 $136.5 $133.6 $129.4 $135.2 Liabilities & Shareholders' Equity Accounts Payable $11.7 $10.5 $7.0 $7.0 $11.0 $8.9 $9.3 $9.8 $10.3 Accrued Expenses 1.7 1.9 2.7 2.7 2.5 2.6 2.7 2.8 3.0 Other Current Liabilities 11.5 14.3 10.4 10.4 10.4 10.6 11.1 11.7 12.2 Total Current Liabilities 24.9 26.7 20.0 0.0 20.0 23.9 22.0 23.1 24.3 25.5 Other Liabilities 17.8 16.3 16.5 16.5 16.8 17.2 18.0 18.9 19.9 Existing Debt 0.0 5.9 4.7 (4.7) 0.0 0.0 0.0 0.0 0.0 0.0 New Line of Credit 0.0 0.0 0.0 0.0 0.0 0.0 0.0 0.0 0.0 0.0 New Senior Debt - Term A 0.0 0.0 0.0 34.8 34.8 27.8 20.9 13.1 2.3 0.0 New Senior Debt - Term B 0.0 0.0 0.0 0.0 0.0 0.0 0.0 0.0 0.0 0.0 New Sub Debt 0.0 0.0 0.0 0.0 0.0 0.0 0.0 0.0 0.0 0.0 Accumulated PIK Interest 0.0 0.0 0.0 0.0 0.0 0.0 0.0 0.0 0.0 Total Liabilities 42.7 48.9 41.2 30.1 71.3 68.5 60.0 54.2 45.6 45.4 Existing Shareholders' Equity 116.5 100.3 90.0 (90.0) 0.0 0.0 0.0 0.0 0.0 0.0 New Common Stock 0.0 0.0 0.0 74.5 74.5 74.5 74.5 74.5 74.5 74.5 New Retained Earnings 0.0 0.0 0.0 0.0 0.0 0.4 1.9 4.9 9.3 15.3 Total Shareholders' Equity 116.5 100.3 90.0 (15.4) 74.5 74.9 76.5 79.4 83.9 89.8 Total Liabilities & Shlds. Equity $159.2 $149.1 $131.2 $14.6 $145.8 $143.4 $136.5 $133.6 $129.4 $135.2
  • 7. Project Name Projected Cash Flow Statement ($ in millions, except per share data) FY December 31, 2009P 2010P 2011P 2012P 2013P Net Income $0.4 $1.6 $2.9 $4.4 $6.0 Depreciation on Existing Assets 12.0 12.0 12.0 12.0 12.0 Depreciation on New CapEx 0.0 0.4 1.2 2.1 3.0 Amortization of Intangibles 1.3 1.3 1.3 1.3 1.3 Change in Accounts Receivable (0.2) (0.0) (0.3) (0.3) (0.3) Change in Inventory (5.0) 2.0 (1.4) (1.5) (1.5) Change in Prepaid Expenses (0.4) (0.1) (0.3) (0.3) (0.3) Change in Other Assets (0.0) (0.0) (0.0) (0.0) (0.0) Change in Accounts Payable 4.0 (2.1) 0.4 0.5 0.5 Change in Accrued Expenses (0.2) 0.0 0.1 0.1 0.1 Change in Other Liabilities 0.4 0.5 1.4 1.5 1.5 Cash Flow from Operations $12.4 $15.6 $17.4 $19.9 $22.3 Capital Expenditures ($7.4) ($7.3) ($8.9) ($9.1) ($9.3) Cash Flow from Investing ($7.4) ($7.3) ($8.9) ($9.1) ($9.3) Repayments of Line of Credit $0.0 $0.0 $0.0 $0.0 $0.0 Repayments of Senior Debt - Term A (7.0) (7.0) (7.8) (10.7) (2.3) Repayments of Senior Debt - Term B 0.0 0.0 0.0 0.0 0.0 Repayments of Sub Debt 0.0 0.0 0.0 0.0 0.0 Additions to PIK Interest 0.0 0.0 0.0 0.0 0.0 Cash Flow from Financing ($7.0) ($7.0) ($7.8) ($10.7) ($2.3) Net Cash Flow ($2.0) $1.3 $0.7 ($0.0) $10.6 Beginning Cash & Equivalents 5.0 3.0 4.3 5.0 5.0 Ending Cash & Equivalents $3.0 $4.3 $5.0 $5.0 $15.6
  • 8. Project Name Projected Debt Schedule ($ in millions, except per share data) FY December 31, 2009P 2010P 2011P 2012P 2013P 12 Month LIBOR 2.80% Cash Flow Available to Repay Debt $10.0 $11.2 $12.8 $15.7 $18.0 Minimum Cash Balance 5.0 5.0 5.0 5.0 5.0 Net Cash Available $5.0 $6.2 $7.8 $10.7 $13.0 Terms Line of Credit Availability $17.5 Beginning Balance $0.0 $0.0 $0.0 $0.0 $0.0 Unused Fee 0.25% Borrowings / (Repayment) 0.0 0.0 0.0 0.0 0.0 Spread 2.8% Ending Balance 0.0 0.0 0.0 0.0 0.0 Total Rate 5.6% Interest Expense 0.0 0.0 0.0 0.0 0.0 Term 5 years Unused Credit Line Fee $0.0 $0.0 $0.0 $0.0 $0.0 Type Bullet Senior Debt - Term A Terms Beginning Balance $34.8 $27.8 $20.9 $13.1 $2.3 Spread 5.5% Mandatory Amortization 20.0% 20.0% 20.0% 20.0% 20.0% Total Rate 8.3% Mandatory Repayment (7.0) (7.0) (7.0) (7.0) (2.3) Term 5 years Additional Repayment 0.0 0.0 (0.8) (3.8) 0.0 Type Amortize Ending Balance 27.8 20.9 13.1 2.3 0.0 Net Cash Available (2.0) (0.7) 0.0 0.0 10.6 Interest Expense $2.6 $2.0 $1.4 $0.6 $0.1 Senior Debt - Term B Terms Beginning Balance $0.0 $0.0 $0.0 $0.0 $0.0 Spread 6.5% Mandatory Amortization 0.0% 0.0% 0.0% 0.0% 0.0% Total Rate 9.3% Mandatory Repayment 0.0 0.0 0.0 0.0 0.0 Term 8 years Additional Repayment 0.0 0.0 0.0 0.0 0.0 Type Bullet Ending Balance 0.0 0.0 0.0 0.0 0.0 Net Cash Available (2.0) (0.7) 0.0 0.0 10.6 Interest Expense $0.0 $0.0 $0.0 $0.0 $0.0 Sub Debt Terms Beginning Balance $0.0 $0.0 $0.0 $0.0 $0.0 Spread 9.0% Additional Repayment 0.0 0.0 0.0 0.0 0.0 Total Rate 11.8% Ending Balance 0.0 0.0 0.0 0.0 0.0 PIK Interest 0.0% Interest Expense 0.0 0.0 0.0 0.0 0.0 Term 10 years PIK Interest Expense $0.0 $0.0 $0.0 $0.0 $0.0 Type Bullet Total Cumulative Interest Expense $2.6 $4.6 $6.0 $6.7 $6.8 Cumulative Senior Debt Paydown 20.0% 40.0% 62.4% 93.2% 100.0%