1. Excel Spreadsheet Activity Name: _______________
Date: ________________
Creating A Pictograph!!!
The following activity will guide you through creating a pictogram using Microsoft
Excel. A pictograph shows numerical information by using picture symbols to
represent data. The pictograph that we will make will represent the number of
student athletes in the Colonial League that play football, baseball, soccer, and
basketball.
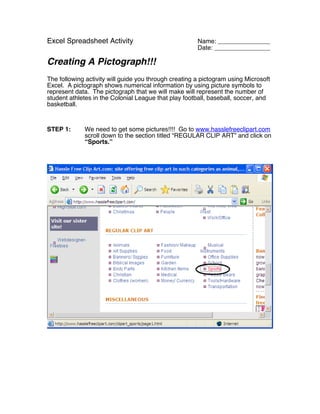
STEP 1: We need to get some pictures!!!! Go to www.hasslefreeclipart.com
scroll down to the section titled “REGULAR CLIP ART” and click on
“Sports.”