Pre-Cal 40S Slides September 20, 2007
•
0 gostou•387 visualizações

More on graphing trig functions.

Recomendados
Mais conteúdo relacionado
Mais de Darren Kuropatwa
Mais de Darren Kuropatwa (20)
Último
Último (20)
Pre-Cal 40S Slides September 20, 2007
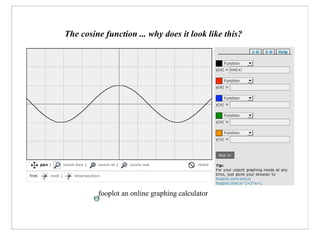
- 1. The cosine function ... why does it look like this? fooplot an online graphing calculator
- 2. Sketch each of the following graphs without using a calculator ...
- 3. Sketch each of the following graphs without using a calculator ...
- 4. Sketch each of the following graphs without using a calculator ...
- 5. Now, put what you've learned together, graph this function ...
- 6. Graphing Trig Functions ƒ(x) = AcosB(x - C) + D ƒ(x) = AsinB(x - C) + D The Role of Parameter A |A|is called the Amplitude A determines the distance of the maximum and minimum values from the Sinusoidal Axis continues ...
- 7. | A | > 1 The graph is stretched A units. 0 <| A | < 1 the graph is compressed by factor A. A < 0 the graph is reflected over the sinusoidal axis. The role of Parameter B. B is not the period. B determines the period according to this relation: or The period is the distance along the x-axis required to make one quot;wavequot;.
- 8. The role of parameter C. C is called the phase shift. (aka the horizontal shift) C > 0 the graph is shifted to the right C units C < 0 the graph is shifted left C units WARNING: watch the sign of C The role of parameter D. D is called the vertical shift, aka average value. D determines the sinusoidal axis. D > 0 the graph shifts up D units D < 0 the graph shifts down D units