
Recomendados
Recomendados
Mais conteúdo relacionado
Mais procurados
Mais procurados (16)
Destaque
Destaque (9)
Semelhante a Peter Ellis Umbagog Thesis Presentation
Semelhante a Peter Ellis Umbagog Thesis Presentation (20)
Peter Ellis Umbagog Thesis Presentation
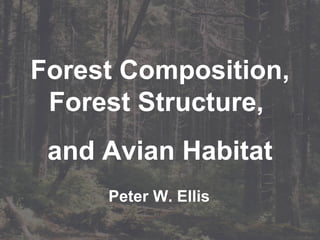
- 1. Forest Composition, Forest Structure, and Avian Habitat Peter W. Ellis
- 2. Research Questions 2) Forest Composition : How can ELU’s be used to assess and predict potential forest vegetation in the Androscoggin Watershed? 1) Forest Structure : What are the range of forest structures present in Lake Umbagog Wildlife Refuge? How can we best classify these into forest structure types? 3) Avian Habitat : Based on composition and structure, what is the distribution of habitat types for bird species of conservation concern in the Refuge?
- 4. Sampling Design 133 randomly-placed prism points stratified in to the 6 major current forest vegetation types 133 Total 1 Aspen-Balsam Fir Forest 20 Aspen-birch Forest 18 Red Maple-Yellow Birch Forest 21 Successional Spruce-Fir Forest 0 Rich Northern Hardwood Forest 19 Northern Hardwood Forest 1 Hemlock-Hardwood Forest 25 Lowland Spruce-Fir Forest 0 Dry Rocky Mixed Hardwood-Conifer Forest 27 Mixed Hardwood-Conifer Forest 1 Red Spruce Rocky Summit Number of Points Sampled Current Forest Vegetation
- 10. Step 1: Calculate Forest Structure Metrics (FSM’s). trees/hectare number of trees per unit area with a visible cavity CAVITY 20 percent percent of total log volume consisting of logs in decay classes 3 or 4 OLDLOG 19 meters 3 the average volume of a log for the given plot LOGVOL 18 meters 3 /hectare volume of downed woody debris per unit area DWD 17 percent percent of total shrub/pole density recorded as "conifer" CONIF 16 stems/hectare density of all live shrub and pole stems < 7.6 cm DBH SHRUB 15 percent percent of total ground cover recorded as "herbaceous plant" HERB 14 percent percent of total ground cover recorded as "fern" FERN 13 percent percent ground cover GROUND 12 percent percent of total canopy cover recorded as "multistrata" MULTI 11 percent percent canopy cover CANOPY 10 trees/hectare diameter distribution shape, expressed as the density of trees 9-17 inches DBH divided by the density of trees 3-9 inches DBH SHAPE 9 meters standard deviation of mid-canopy height for all live trees > 7.6 cm DBH, weighted by basal area QHTSTD 8 meters height to mid-canopy weighted by BA calculated from prism counts (all stems >7.6 cm DBH live only) QMNHT 7 meters 2 /hectare basal area of all dead stems > 30 cm DBH SNAGLG 6 meters 2 /hectare basal area of all dead stems > 7.6 cm DBH SNAGBA 5 meters 2 /hectare basal area of all live stems > 7.6 cm DBH LIVEBA 4 centimeters quadratic mean DBH, i.e. the DBH of the tree with average basal area (all live stems > 7.6 cm DBH) QMDBH 3 stems/ha density of all live stems > 7.6 cm DBH STEM 2 percent percent of live basal area > 7.5 cm DBH consisting of coniferous trees BACONI 1 Units Description Abbreviation
- 11. Step 1: Calculate Forest Structure Metrics (FSM’s). trees/hectare number of trees per unit area with a visible cavity CAVITY 20 percent percent of total log volume consisting of logs in decay classes 3 or 4 OLDLOG 19 meters 3 the average volume of a log for the given plot LOGVOL 18 meters 3 /hectare volume of downed woody debris per unit area DWD 17 percent percent of total shrub/pole density recorded as "conifer" CONIF 16 trees/hectare density of all live shrub and pole stems < 7.6 cm DBH SHRUB 15 percent percent of total ground cover recorded as "herbaceous plant" HERB 14 percent percent of total ground cover recorded as "fern" FERN 13 percent percent ground cover GROUND 12 percent percent of total canopy cover recorded as "multistrata" MULTI 11 percent percent canopy cover CANOPY 10 trees/hectare diameter distribution shape, expressed as the density of trees 9-17 inches DBH divided by the density of trees 3-9 inches DBH SHAPE 9 meters standard deviation of mid-canopy height for all live trees > 7.6 cm DBH, weighted by basal area QHTSTD 8 meters height to mid-canopy weighted by BA, calculated from prism counts (all stems >7.6 cm DBH live only) QMNHT 7 meters 2 /hectare basal area of all dead stems > 30 cm DBH SNAGLG 6 meters 2 /hectare basal area of all dead stems > 7.6 cm DBH SNAGBA 5 meters 2 /hectare basal area of all live stems > 7.6 cm DBH LIVEBA 4 centimeters quadratic mean DBH, i.e. the DBH of the tree with average basal area (all live stems > 7.6 cm DBH) QMDBH 3 stems/ha density of all live stems > 7.6 cm DBH STEM 2 percent percent of live basal area > 7.5 cm DBH consisting of coniferous trees BACONI 1 Units Description Abbreviation trees/ hectare diameter distribution shape, expressed as the density of trees 7.5-23 cm DBH divided by the density of trees 23-48 cm DBH SHAPE 9
- 12. Step 1: Calculate Forest Structure Metrics (FSM’s). trees/hectare number of trees per unit area with a visible cavity CAVITY 20 percent percent of total log volume consisting of logs in decay classes 3 or 4 OLDLOG 19 meters 3 the average volume of a log for the given plot LOGVOL 18 meters 3 /hectare volume of downed woody debris per unit area DWD 17 percent percent of total shrub/pole density recorded as "conifer" CONIF 16 trees/hectare density of all live shrub and pole stems < 7.6 cm DBH SHRUB 15 percent percent of total ground cover recorded as "herbaceous plant" HERB 14 percent percent of total ground cover recorded as "fern" FERN 13 percent percent ground cover GROUND 12 percent percent of total canopy cover recorded as "multistrata" MULTI 11 percent percent canopy cover CANOPY 10 trees/hectare diameter distribution shape, expressed as the density of trees 9-17 inches DBH divided by the density of trees 3-9 inches DBH SHAPE 9 meters standard deviation of mid-canopy height for all live trees > 7.6 cm DBH, weighted by basal area QHTSTD 8 meters height to mid-canopy weighted by BA, calculated from prism counts (all stems >7.6 cm DBH live only) QMNHT 7 meters 2 /hectare basal area of all dead stems > 30 cm DBH SNAGLG 6 meters 2 /hectare basal area of all dead stems > 7.6 cm DBH SNAGBA 5 meters 2 /hectare basal area of all live stems > 7.6 cm DBH LIVEBA 4 centimeters quadratic mean DBH, i.e. the DBH of the tree with average basal area (all live stems > 7.6 cm DBH) QMDBH 3 stems/ha density of all live stems > 7.6 cm DBH STEM 2 percent percent of live basal area > 7.5 cm DBH consisting of coniferous trees BACONI 1 Units Description Abbreviation meters standard deviation of mid-canopy height for all live trees > 7.6 cm DBH, weighted by basal area QHTSTD 8
- 13. Step 2: Use Ward’s Cluster Analysis to group points based on FSM’s. Cluster A Cluster D Cluster B Cluster E Cluster C
- 14. Step 3: Use 1-way ANOVA to identify 7 FSM’s with significant variability between clusters (p < 0.05) . stems/ hectare SHRUB: density of all live shrub and pole stems < 7.6 cm DBH C A B D E Cluster
- 15. Step 4: Create Structure-based Forest Types by describing differences in FSM’s between clusters. Management-induced Diversification E Natural Diversification D Suppression-induced Diversification C Biomass Accumulation/ Competitive Exclusion B Regenerating with Residuals A Name Cluster
- 16. Cluster A: Regenerating with Residuals Description : lowest stem density , higher proportion of large trees creating the most unbalanced size distribution (very high SHAPE value), most open canopy, lowest basal area , very dense understory, the largest trees have uniform canopy, some large snags, fewer cavity trees, most coniferous regeneration proportionally Interpretation: Perhaps managed as a shelterwood or seed tree cut—large residual trees have been left but dense regeneration was stimulated. Some biological legacy from previous generations is preserved.
- 17. Cluster A: Regenerating with Residuals
- 18. Description : most uniform canopy, highest basal area , most open understory, highest stem density, smallest trees, most coniferous site, more cavity trees, few old logs Interpretation: The youngest stand type. Density-dependent tree mortality is very high. Cluster B: Biomass Accumulation/Competitive Exclusion
- 19. Cluster B: Biomass Accumulation/Competitive Exclusion
- 20. Description : lowest quadratic mean diameter, high stem density, more small trees, average canopy closure, open understory, medium-high basal area, shortest trees, fewer cavity trees, least coniferous regeneration proportionally, largest average log size Interpretation: A young stand where suppression has generated distinct canopy strata, giving the appearance of an uneven-aged stand. Cluster C: Suppression-induced Diversification
- 21. Cluster C: Suppression-induced Diversification
- 22. Description : higher quadratic mean diameter, average stem density, average distribution, closed canopy, most diverse canopy strata, average basal area, average understory density, lowest conifer component, high hardwood component, many old logs Interpretation: Entering into a true stage of structural diversity. The canopy is beginning to diversify, the understory is regenerating, and density-dependent mortality is no longer dominant. Cluster D: Natural Diversification
- 23. Cluster D: Natural Diversification
- 24. Description : sparse ground cover, dense understory, low stem density, medium-low basal area, high quadratic mean DBH but average distribution, closed canopy, more canopy strata present, fewest snags Interpretation: Perhaps selection-harvested to low density and basal area, causing a premature arrival at a stage of structural diversification. Perhaps some biological legacy from previous generations present. Cluster E: Management-induced Diversification
- 25. Cluster E: Management-induced Diversification
- 27. Build structurally-defined habitat matrix. 14 12 8 9 15 Total species per cluster: Boreal Chickadee Gray Jay Least Flycatcher Eastern Wood Pewee Olive-sided Flycatcher Northern Flicker Black-backed Woodpecker Northern Three-toed Woodpecker Yellow-bellied Sapsucker American Woodcock Spruce Grouse Management-induced Diversification Natural Diversification Suppression-induced Diversification Biomass Accumulation/Competitive Exclusion Regenerating with Residuals Bird Species Cluster E Cluster D Cluster C Cluster B Cluster A
- 28. Estimated Structure Type Frequency
- 32. Study Area Sampling Area
- 33. ELU’s: The “Stage” 30-m pixel Landform Substrate Elevation zones ELU’s
- 34. What goes into an ELU? ELU_code = Elev class (ft) + Substrate class + Landform 1000 (0-800) 100 acidic sed/metased 4 steep slope 2000 (800-1700) 200 acidic shale 5 cliff 3000 (1700-2500) 300 calc sed/metased 11 flat summit/ridgetop 4000 (2500-4000) 400 mod. calc sed/metased 13 slope crest 5000 (4000+) 500 acidic granitic 21 hilltop (flat) 600 mafic/intermed granitic 22 hill (gentle slope) 700 ultramafic 23 north-facing sideslope 800 coarse sediments 24 south-facing sideslope 900 fine sediments 30 dry flat 31 wet flat 32 valley/toe slope 41 flat at bottom of steep slope 43 north-facing cove/draw 44 south-facing cove/draw = 5 Elevation Classes X 9 Substrates X 14 Landforms = 740 different ELU codes (142 in Study Area)
- 35. Too Many ELU’s: How to Make Sense of It?
- 36. The Answer Group ELU’s into ecologically meaningful categories.
- 37. Sampling Design Where are major compositional transitions occurring? (Where are “the players” changing?)
- 38. Sampling Design Place transects to cross over transitions.
- 39. Record Observations of Forest Type 1030 points total Sampling Design
- 40. Data Collected Who are the players? Who will replace the current players on the stage? All of the Above Plus: Successional Spruce-Fir Forest Successional Red Maple-Yellow Birch Forest Successional Aspen-Birch Forest Successional Aspen-Fir Forest Current Forest Type: Red Spruce Rocky Summit Mixed Hardwood-Conifer Forest Dry Hilltop Beech-Conifer Forest Lower Elevation Spruce-Fir Forest Hemlock-Hardwood Forest Northern Hardwood Forest Rich Northern Hardwood Forest Mixed Hardwood-Conifer Talus Woodland Potential Forest Type: Possible Categorical Values Assigned to Variable Type of Observation
- 42. Aspen - Birch Early-Successional Forest
- 43. Red Maple –Yellow Birch Early-Successional Forest What kind of forest will it grow up to be?
- 44. Regrouping ELU’s Step 1 : Reserve half of dataset for post-analysis accuracy assessment.
- 45. Regrouping ELU’s Step 1 : Reserve half of dataset for post-analysis accuracy assessment.
- 46. Regrouping ELU’s Step 2 : Group physiographically similar ELU’s that collectively contain fewer observed transitions in analysis set.
- 47. Regrouping ELU’s Step 3 : Assign the most commonly occurring potential forest type to each physiographic group.
- 48. Regrouping ELU’s Step 4 : Expand to the scale to the entire Upper Androscoggin Basin
- 50. Predicted Potential Forest Type
- 51. Compare Predicted Vegetation with Current Vegetation
- 53. Assessment Assess accuracy of forest type predictions using remaining half of data. Total Accuracy of Predictions = 51%
- 54. Assessment *Percent of observed points within this predicted community that agreed with the prediction. Some ELU Groupings predicted forest type better than others. 63% Lower Elevation Spruce Fir Forest 43% Mixed Hardwood-Conifer Forest Percent Correct * Community Type 51% Total: 18% Northern Hardwood Forest or Hemlock Hardwood Forest 43% Northern Hardwood Forest 57% Dry Hilltop Beech-Conifer Forest or Red Spruce Rocky Summit
- 56. Assign each bird species of conservation concern to a predicted potential forest type. Avian Habitat
- 57. Build composition-defined habitat matrix. Boreal Chickadee Gray Jay Least Flycatcher Eastern Wood Pewee Olive-sided Flycatcher Northern Flicker Black-backed Woodpecker Northern Three-toed Woodpecker Yellow-bellied Sapsucker American Woodcock Spruce Grouse Montane Spruce-Fir Forest Lower Elevation Spruce-Fir Forest Dry Hilltop Beech Conifer Forest Mixed Hardwood-Conifer Forest Rich Northern Hardwood Forest Northern Hardwood Forest
- 58. Map potential avian habitat in conjunction with predicted forest types.
Notas do Editor
- Forest Structure Parameters?
- Background
- Background
- Background
- Background
- Background
- Background
- Background
- Background
- Background
- Background
- Background
- Background
- Background
- Background
- Background
- Background
- Background
- Background
- Background
- Background
- Background
- Background
- Background
- Background
- Background
- Background
- Background
- Background
- Background
- Background
- Background
- Background
- Background
- Background
- Background
- Background
- Background
- Background
- Background
- Background
- Background
- Background
- Background
- Background
- Background
- Background
- Background
- Background
- Background
- Background
- Background
- Background
- Background
- Background
- Background