Mobile Action Codes in Magazines Grow to Over 8% of Ad Pages in Q1 2012
•
2 gostaram•390 visualizações

The document summarizes data from a study of mobile action codes, including QR codes, in the top 100 US magazines in Q1 2012. Some key findings: - The number of codes printed increased significantly year-over-year, with 1365 codes in Q1 2012 versus 352 in Q1 2011. - QR codes dominated the market, accounting for over 80% of all codes. - For the first time, the percentage of magazine pages containing a code exceeded 8% each month of the quarter. - Codes were primarily used for branding through video, e-commerce, opt-ins/sweepstakes, and social media engagement.

Recomendados
Mais conteúdo relacionado
Mais procurados
Mais procurados (17)
Destaque
Destaque (12)
Semelhante a Mobile Action Codes in Magazines Grow to Over 8% of Ad Pages in Q1 2012
Semelhante a Mobile Action Codes in Magazines Grow to Over 8% of Ad Pages in Q1 2012 (20)
Mais de 中文互联网数据研究资讯中心--199it
Mais de 中文互联网数据研究资讯中心--199it (20)
Último
Último (20)
Mobile Action Codes in Magazines Grow to Over 8% of Ad Pages in Q1 2012
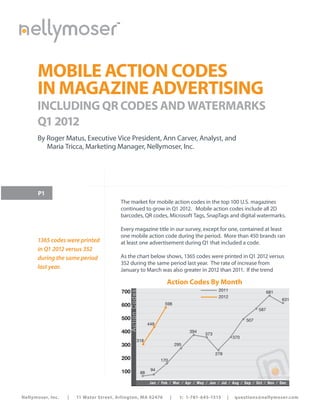
- 1. ™ MOBILE ACTION CODES IN MAGAZINE ADVERTISING INCLUDING QR CODES AND WATERMARKS Q1 2012 By Roger Matus, Executive Vice President, Ann Carver, Analyst, and Maria Tricca, Marketing Manager, Nellymoser, Inc. P1 The market for mobile action codes in the top 100 U.S. magazines continued to grow in Q1 2012. Mobile action codes include all 2D barcodes, QR codes, Microsoft Tags, SnapTags and digital watermarks. Every magazine title in our survey, except for one, contained at least one mobile action code during the period. More than 450 brands ran 1365 codes were printed at least one advertisement during Q1 that included a code. in Q1 2012 versus 352 during the same period As the chart below shows, 1365 codes were printed in Q1 2012 versus 352 during the same period last year. The rate of increase from last year. January to March was also greater in 2012 than 2011. If the trend Action Codes By Month 700 2011 Action Co des 681 2012 631 600 598 587 500 507 449 400 394 373 370 318 300 295 278 200 170 100 94 88 Source: Nellymoser Jan ⁄ Feb ⁄ Mar ⁄ Apr ⁄ May ⁄ Jun ⁄ Jul ⁄ Aug ⁄ Sep ⁄ Oct ⁄ Nov ⁄ Dec To p 100 M a g a zine s Nellymoser, Inc. | 11 Water Street, Arlington, MA 02476 | t: 1-781-645-1515 | questions@nellymoser.com
- 2. Percentage of Ad Pages With An Action Code 2011 2012 10 A ct i o n C o d es 9 8.30% 8.36% 8.90% 8 7.42% 8.05% 7.96% For the first 7 6.48% time, the 6 percentage 5.16% 5.02% 5.76% 5 of magazine 4.02% 4.96% pages 4 containing an 3 3.55% action code Source: Nellymoser exceeded 8% Mar ⁄ Apr ⁄ May ⁄ Jun ⁄ Jul ⁄ Aug ⁄ Sep ⁄ Oct ⁄ Nov ⁄ Dec ⁄ Jan ⁄ Feb ⁄ Mar each month continues, the overall adoption Top 1 0 0 of mobile Mactivatedievery campaign, ran every video a ga z n es in the quarter. action codes will grow at an even faster and visited every web page. rate during the year. Action Code Growth Action codes are popular with publishers and advertisers because they offer a Every magazine in our study, except for compelling way to activate print with Taste of Home, contained at least one code P2 mobile and social content that engages in Q1. The percentage of magazines with at readers, builds brand loyalty and captures least one code is up from 96% in Q4 2011. new business. Overall, the total number of action codes To understand how QR codes are being printed increased to 1365 in Q1 2012 from used in magazine advertising, Nellymoser 352 in the same period of 2011. Period- surveyed the top 100 U.S. magazines to-period comparisons are important by circulation. This study includes all to seasonally adjust the data. Some issues dated during Q1 2012 as well as magazines do not publish a January information from previous Nellymoser issue. Some others create a combined studies of magazines published in 2011. issue that spans December and January. (We count combined issues as being in The study is limited to national titles readily December. ) In addition, advertising pages available on newsstands. This eliminated increased around the holiday season in the regional publications and any that require magazines that did publish. a membership, such as AARP The Magazine. For the purposes of this study, we refer to The percentage of advertising pages with this list as the Top 100 magazines. an action code may provide the most accurate measurement of mobile action To compile the data, Nellymoser counted code adoption. and analyzed every page in the Top 100 magazines. We analyzed 38,719 pages in For the first time, the percentage of Q1, including 15,691 advertising pages. magazine pages containing an action code exceeded 8% each month in Q1 2012. Nellymoser scanned every QR code, Microsoft Tag, SpyderLynk SnapTag, The average and median number of action Digimarc watermark and all other codes codes per issue returned to the levels with an iPhone or Android phone. We found in Q3 2011, when there were no Nellymoser, Inc. | 11 Water Street, Arlington, MA 02476 | t: 1-781-645-1515 | questions@nellymoser.com
- 3. Number of Action Codes Per Issue Q1 2011 Q2 2011 Q3 2011 Q4 2011 Q1 2012 Average number of 2.33 4.23 4.83 6.50 4.88 codes per issue Median number of 2 3 4 5 4 codes per issue Greatest number of 12 29 54 70 32 codes in an issue Number of action codes per issue for issues that contained at least one action code. Each weekly QR codes issue of a weekly magazine counted as a separate issue. clearly holiday season promotions. There were All other codes combined had less than dominated the also fewer mega-promotions in Q1 versus 10% share. Digimarc watermarks and market at more Q4. The greatest number of codes in a SpyderLynk SnapTags had an impact with than 80% of all magazine issue during Q1 dropped to 32 major campaigns with multiple codes in from a holiday season high of 70. select issues. For example, 25 Digimarc action codes. watermarks appeared in the February QR Codes Lead Market Sports Illustrated swimsuit issue while 24 SpyderLynk Snaptags appeared in the QR codes clearly dominated the market March issue of Glamour. with more than 80% of all codes in the Top 100 magazines during Q1, up from 72% in How Action Codes Were Used Q4. This is a significant change from Q1 of last year when the market was closely split In contrast to last year, it is now unusual for P3 between QR codes and Microsoft Tags. a magazine reader to be sent to a desktop- Action Code Market Share By Month 2011 2012 QR Code % of Ac ti o n C o d e s 100 Microsoft Tag 90 Other 80% 80% 82% 80 77% 75% 74% 70 68% 65% 63% 60 53% 55% 55% 50 40 46% 45% 41% 30 32% 21% 33% 20 25% 25% 23% 13% 12% 10 17% 11% 0 5% 4% 4% 7% 6% 1% 0% 0% 2% 2% 1% Type of Code Apr ⁄ May ⁄ Jun ⁄ Jul ⁄ Aug ⁄ Sep ⁄ Oct ⁄ Nov ⁄ Dec ⁄ Jan ⁄ Feb ⁄ Mar BEE 1 Digimarc 5 29 8 JagTag 1 1 7 14 10 9 10 3 2 3 3 MSFT Tag 136 176 94 88 152 109 145 226 105 72 57 69 QR 157 217 279 175 202 343 433 440 502 244 359 493 SpyderLynk 7 1 40 5 14 1 24 WIMO 1 1 2 2 AR 3 1 Nellymoser, Inc. | 11 Water Street, Arlington, MA 02476 | t: 1-781-645-1515 | questions@nellymoser.com
- 4. Uses for Action Codes During Q1 Video: 35% E-Commerce: 21% Opt-in/Subscribe/Sweeps: 20% $ Social Media: 18% $ Store Locator: 11% It is now rare Coupon: 8% for a magazine Photo Gallery: 7% reader to be sent to a desktop-style Downloads: 7% web site after Recipes: 2% scanning a code. Voting: 0% Source: Nellymoser NOTE: Columns total more than 100% because each action code may lead to more than one engagement. For example, it may show a video and then offer to share the video. style web site after scanning a code. mobile campaigns. Our qualitative analysis Advertisers and editors are creating mobile is that most action codes were used for one P4 experiences designed to engage the reader or more of the following four purposes: while they are reading the magazine. • Branding and Demonstrations: By Video continues to be the top mobile far, the largest usage for action codes experience launched by an action code. was to showcase a video (35%). These E-commerce, sweepstakes and social media videos are often created specifically for are the next most common uses, with each mobile use. Examples include: being around 20%. The rankings remain • A behind-the-scenes look very similar to last quarter: • A product demonstration • A how-to video Engagement Q4 2011 Q1 2012 • An entertaining video Video 44% 35% Opt-in / 23% 20% • Data Capture and List Building (Opt- Sweeps ins / Subscriptions / Sweepstakes): Social Media 16% 18% Action codes are effective for building databases because readers can E-commerce 19% 21% respond immediately and wherever Store Locator 11% 11% they are reading the magazine. Coupon 9% 8% Sweepstakes were, by far, the largest Photo Gallery 8% 7% contributor in this category. While a Downloads 5% 7% sweeps can be run with just one action Recipes 4% 2% code, there is a growing trend towards Voting 0% 0% sweepstakes that us multiple codes and span an entire issue with multiple Nellymoser scanned every code, activated advertisers and editorial sections each campaign, watched each video and participating. completed actions requested for the Nellymoser, Inc. | 11 Water Street, Arlington, MA 02476 | t: 1-781-645-1515 | questions@nellymoser.com
- 5. “Smart Sweepstakes” are also used has a social sharing feature. These to increase scan rates. After a user were not counted.) scans and enters information, the smart sweepstakes retains the user’s Top Industries and Brands entry data from one scan to the next, enabling instant entry and reducing About 45% of all action codes used in the obstacles to form submission. magazines (619) came from companies in just four industries: beauty, health, home • Commerce (On-line Store, Brick- and fashion. These were the same top in- and-Mortar Store Locator / Coupon): dustries as during Q4 2011. We also found Readers can immediately scan and in our Retail Study that companies in these About 45% of all industries led the action code use in stores. act on a desire to purchase. Links to a action codes used corporate e-commerce store led the category at 21% followed by in-app Specific brands, however, have changed. in magazines store locators at 11%. Some store None of the top 10 brands during Q1 (619) came from appeared on the top 10 list in Q4. This locators used the phone’s built-in GPS companies in just to find the nearest location. quarter, the top brand was TurboTax tax four industries: preparation software. Perhaps this is not • Social Media: Action codes were surprising given that most of their business beauty, health, also used to enable Facebook, Twitter is during tax season. home and and to connect to email. In Q1, 18% of fashion. codes enabled readers to share a video The number two brand was Tyson, which link or product information via social in one of their campaigns, used QR codes media. (NOTE: Only social sharing that to directly link to their Facebook page. Q4 was part of the mobile campaign was leaders L’Oreal and Bose did advertise in included. Some video campaigns led Q1, but did not make the top 10 list. P5 to a YouTube Channel, which in turn Top 10 Industries and Brands Action Codes A cti on C odes 1 Beauty 1 Turbo Tax 214 21 ⁄ ⁄ 2 Health 2 Tyson 174 19 ⁄ ⁄ Home 3 3 O’Keeffe’s Working Hands 141 19 To p I n d u s t r i e s ⁄ ⁄ Fashion To p B r a n d s 4 90 4 Pandora 18 Automotive ⁄ ⁄ 5 81 5 Restart Fitness 17 Financial ⁄ ⁄ 6 63 6 Blue Buffalo 15 Food/Bev ⁄ ⁄ 58 7 7 It’s a 10 Haircare Television 15 ⁄ ⁄ 52 8 8 UPS Jewlery 14 ⁄ ⁄ 52 9 9 Swanson Pharmaceutical 13 48 ⁄ ⁄ Luden’s, Jenny Craig, Miss Me, 10 Travel 10 Gorilla Glue, Bill Levkov Dresses 47 Source: Nellymoser 12 Source: Nellymoser Nellymoser, Inc. | 11 Water Street, Arlington, MA 02476 | t: 1-781-645-1515 | questions@nellymoser.com
- 6. Top 10 Magazine Titles Top Magazines By Number of Codes Per Issue The best way to determine the Top 10 Ac tion C odes P er Issu e Magazines with action codes is to calculate them by the number of codes per issue. 1 InStyle 18.7 ⁄ This puts weeklies, momthlies and those that skipped an issue on the same basis. 2 Brides 17.7 ⁄ As in 2011, the Top 10 Magazines were 3 Teen Vogue primarily women’s magazines and home 15.0 ⁄ magazine titles. 4 This Old House The Top 10 15.0 ⁄ Magazines Action Code Text 5 Car and Driver were primarily 12.0 ⁄ In Q1, 64% of all action codes were 6 Cooking Light women’s accompanied by information that 12.0 ⁄ magazines and described what happens after the scan. 7 Traditional Home home magazine This is considered by many to be a best 12.0 ⁄ titles practice and follows the pattern of many 8 Glamour other calls to action. 11.7 ⁄ 9 Every Day With Rachel Ray There is a clear trend moving away from 11.5 having other content around the QR code, ⁄ which is an indication of wider acceptance. 10 Shape 11.3 Source: Nellymoser Only 17% of codes were customized and P6 only 6% were accompanied by an icon. Few codes were accompanied by an SMS indicate that a code crossed quadrant campaign. boundaries. Action Code Page Location Conclusion and Key Findings More than 85% of action codes are placed During Q1 2012, Nellymoser reached these on the bottom half of the page, the key conclusions based on this study: traditional location for a call to action. • QR codes and other types of action The diagram on the next page divides a codes have become established in magazine page into quadrants and shows magazine advertising. For five straight by percentage where the action codes months, 8% to 9% of magazine ad appeared. Numbers that overlap quadrants pages contained a code. This is up Action Codes In Print 64% 17% describes destination are customized Scan to Shop 6% Get the Free App 28% have icon From Nellymoser use color Go To: ScanNow.mobi Or text SCAN to 800-555-1234 3% 1.6% have choice to use SMS have instructions to get app Source: Nellymoser, Inc. Nellymoser, Inc. | 11 Water Street, Arlington, MA 02476 | t: 1-781-645-1515 | questions@nellymoser.com
- 7. significantly from March 2011, when 3.55% of ad pages contained an action code. 0.2% 8.9% • QR codes are the clear market leader. 2.9% Digimarc watermarks and SpyderLynk SnapTags entered the market with large 1.2% campaigns in single issues. 0% 0.1% • Almost all action code experiences 44.4% have been mobile-optimized. 39.9% 1.8% More than • Four types of campaigns dominate the 85% of action use of action codes: Source: Nellymoser, Inc. codes are • Video demonstrations and placed on the branding in just four industries: beauty, health, bottom half of home and fashion. • Data capture and list building. the page • More than 85% of action codes are • Links to e-commerce sites and placed on the bottom half of the page. store locators for brick-and-mortar locations. Nellymoser intends to update this report on a regular basis to identify trends. • Social media sharing with links to Facebook and Twitter. Get notifications of future updates by • About 45% of all action codes used in following Nellymoser on Facebook at P7 magazines (619) came from companies http://www.facebook.com/nellymoser. About Nellymoser NFC. Nellymoser’s customers include leading publishers, advertisers, retailers Nellymoser, a mobile marketing and and consumer packaged goods companies. technology company, creates instant, interactive consumer “engagements” and Nellymoser was founded in 2000 and is rich media apps on mobile devices, such as headquartered in Arlington, MA. tablets and smartphones. Scan To See Nellymoser In Action: These engagements and apps range from contests and product videos to interactive multimedia engagements that can be shared on social media (e.g., Facebook, and Twitter) and include e-commerce for instant product purchases. Many clients use Nellymoser for responding to action codes, such as 2D barcodes, QR codes, Microsoft Tags, Digimarc watermarks and Copyright 2012 by Nellymoser, Inc. All Rights Reserved. Not responsible for errors and all information is subject to change without notice. Nellymoser and the Nellymoser logo are trademarks of Nellymoser, Inc. All other marks are the property of their respective owners. Nellymoser, Inc. | 11 Water Street, Arlington, MA 02476 | t: 1-781-645-1515 | questions@nellymoser.com
- 8. Mobile As Powerful As Your Brand Nellymoser builds and delivers highly effective and complete print-to- mobile and print-to-social campaigns for advertisers, publishers and brands. Our campaigns are extremely effective because we know what has achieved the best results in hundreds of mobile campaigns for lead- ing brands. We are mobile user experience (UX) experts. Our high impact mobile experiences are dynamic and immediately accessible. Videos look better. Nellymoser HQ Videos are configured and optimized in real-time to deliver the best for any phone type, display size and network. The Nellymoser Cloud Delivery System increases mobile performance, provides high availability and instantly expands to handle peak loads. Social network integration enables instant Likes and social sharing anytime and anywhere for all major social networks. Detailed analytics provide a complete understanding regard- ing the effectiveness of your mobile campaign. Each mobile campaign can be as simple as a video shot with a hand-held camera. Or, a campaign can be detailed, interactive and multi-purpose. We’ll use your existing assets to create a compelling mobile experience. Typical campaigns include: Video and audio playlists Opt-in list building App downloads Mobile e-commerce Sweepstakes Directions to and contests nearest store Nellymoser, Inc., 11 Water Street, Arlington, Massachusetts 02476 USA +1.781.645.1515 www.nellymoser.com Copyright 2012 Nellymoser, Inc. All Rights Reserved. Not responsible for errors and all information is subject to change without notice. NELLYMOSER is a trademark of Nellymoser, Inc. All other marks are the property of their respective owners.