SlideShare uma empresa Scribd logo
1 de 16
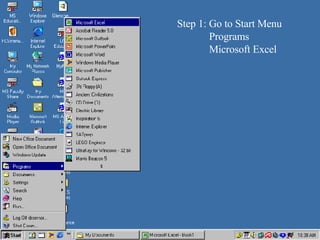
Step 1: Go to Start Menu Programs Microsoft Excel
Step 2: Enter the X axis information in Row 1 Enter the Y axis information in Row 2 See the next slide for an example
 
The text and numbers can be centered in each box by clicking on the box as shown This highlights the box  (see A1 Light). Then click on centering (see red arrow)
You can adjust the box grid Lines by placing the cursor at the edge of the grid line  At the top of the letter box and then drag the grid line.
 
 
Now click on one of the boxes which contains data. Then click on Chart Wizard.
Remember you need to click on a box that contains Data prior to clicking on chart Wizard. Do not click on an empty box such as this one:
Double click on picture Choose Your Graph Design And  Click  “Next”
Choose “Rows” And Click “Next”.
Enter the titles for the chart and the axis’ then click “Next”
Select “As a new Sheet” and click “Finish”
To change column colors double click on a column


Mais conteúdo relacionado

Mais procurados

Creating & Editing Charts In Microsoft Excel 2003
Creating & Editing Charts In Microsoft Excel 2003Creating & Editing Charts In Microsoft Excel 2003
Creating & Editing Charts In Microsoft Excel 2003
bud_00
 
Witing DE materials
Witing DE materialsWiting DE materials
Witing DE materials
No Limit
 
MIS 226: Chapter 3
MIS 226: Chapter 3MIS 226: Chapter 3
MIS 226: Chapter 3
macrob14
 
Lesson 16 Working With Charts
Lesson 16   Working With ChartsLesson 16   Working With Charts
Lesson 16 Working With Charts
guevarra_2000
 
Lesson11 working with charts
Lesson11 working with chartsLesson11 working with charts
Lesson11 working with charts
ricsanmae
 
Lesson 10 working with charts
Lesson 10   working with chartsLesson 10   working with charts
Lesson 10 working with charts
guevarra_2000
 
Lesson 11 working with charts
Lesson 11   working with chartsLesson 11   working with charts
Lesson 11 working with charts
guevarra_2000
 

Mais procurados (20)

Creating graphs in excel
Creating graphs in excelCreating graphs in excel
Creating graphs in excel
 
Creating & Editing Charts In Microsoft Excel 2003
Creating & Editing Charts In Microsoft Excel 2003Creating & Editing Charts In Microsoft Excel 2003
Creating & Editing Charts In Microsoft Excel 2003
 
Witing DE materials
Witing DE materialsWiting DE materials
Witing DE materials
 
MIS 226: Chapter 3
MIS 226: Chapter 3MIS 226: Chapter 3
MIS 226: Chapter 3
 
Print16
Print16Print16
Print16
 
Lesson 16 Working With Charts
Lesson 16   Working With ChartsLesson 16   Working With Charts
Lesson 16 Working With Charts
 
Creating a graph in excel
Creating a graph in excelCreating a graph in excel
Creating a graph in excel
 
Lesson11 working with charts
Lesson11 working with chartsLesson11 working with charts
Lesson11 working with charts
 
Spreadsheets 2
Spreadsheets 2Spreadsheets 2
Spreadsheets 2
 
How To Use Excel
How To Use ExcelHow To Use Excel
How To Use Excel
 
MS Excel - Charts
MS Excel - ChartsMS Excel - Charts
MS Excel - Charts
 
excel charts
excel chartsexcel charts
excel charts
 
Computer skills excel2010 5
Computer skills excel2010 5Computer skills excel2010 5
Computer skills excel2010 5
 
Column charts
Column chartsColumn charts
Column charts
 
Lesson 10 working with charts
Lesson 10   working with chartsLesson 10   working with charts
Lesson 10 working with charts
 
Working with Charts - R.D.Sivakumar
Working with Charts - R.D.SivakumarWorking with Charts - R.D.Sivakumar
Working with Charts - R.D.Sivakumar
 
Lesson 11 working with charts
Lesson 11   working with chartsLesson 11   working with charts
Lesson 11 working with charts
 
MS-Excel Working with Pivot Table
MS-Excel Working with Pivot TableMS-Excel Working with Pivot Table
MS-Excel Working with Pivot Table
 
MS Excel Pivot Table Reports & Charts
MS Excel Pivot Table Reports & ChartsMS Excel Pivot Table Reports & Charts
MS Excel Pivot Table Reports & Charts
 
Designstorm How-to: Dot Plots
Designstorm How-to: Dot PlotsDesignstorm How-to: Dot Plots
Designstorm How-to: Dot Plots
 

Destaque

Decision tree powerpoint ppt slides.
Decision tree powerpoint ppt slides.Decision tree powerpoint ppt slides.
Decision tree powerpoint ppt slides.
SlideTeam.net
 
Choosing the Right Graph
Choosing the Right GraphChoosing the Right Graph
Choosing the Right Graph
blumkhhs
 
20160727 - How to Create a Stacked-Cluster Graph in Excel
20160727 - How to Create a Stacked-Cluster Graph in Excel20160727 - How to Create a Stacked-Cluster Graph in Excel
20160727 - How to Create a Stacked-Cluster Graph in Excel
Zaid Kadwa
 
How to draw a climate graph???
How to draw a climate graph???How to draw a climate graph???
How to draw a climate graph???
chintanmehta007
 

Destaque (20)

Excel Graph Steps
Excel Graph StepsExcel Graph Steps
Excel Graph Steps
 
05 Excel Charts
05 Excel Charts05 Excel Charts
05 Excel Charts
 
Creating Graphs in Excel
Creating Graphs in ExcelCreating Graphs in Excel
Creating Graphs in Excel
 
Graphical representation of data in excel
Graphical representation of data in excelGraphical representation of data in excel
Graphical representation of data in excel
 
Tally
TallyTally
Tally
 
Overview of Tally presentation
Overview of Tally presentationOverview of Tally presentation
Overview of Tally presentation
 
Decision tree powerpoint ppt slides.
Decision tree powerpoint ppt slides.Decision tree powerpoint ppt slides.
Decision tree powerpoint ppt slides.
 
Sample (1)learn how to steps powerpoint
Sample (1)learn how to steps powerpointSample (1)learn how to steps powerpoint
Sample (1)learn how to steps powerpoint
 
Learn excel
Learn excelLearn excel
Learn excel
 
Choosing the Right Graph
Choosing the Right GraphChoosing the Right Graph
Choosing the Right Graph
 
Excel
ExcelExcel
Excel
 
20160727 - How to Create a Stacked-Cluster Graph in Excel
20160727 - How to Create a Stacked-Cluster Graph in Excel20160727 - How to Create a Stacked-Cluster Graph in Excel
20160727 - How to Create a Stacked-Cluster Graph in Excel
 
Learn powerpoint
Learn powerpointLearn powerpoint
Learn powerpoint
 
Mlm business demo
Mlm business demoMlm business demo
Mlm business demo
 
How to draw a climate graph???
How to draw a climate graph???How to draw a climate graph???
How to draw a climate graph???
 
MIS In Tally 9
MIS In Tally 9MIS In Tally 9
MIS In Tally 9
 
How to draw a climate graph
How to draw a climate graphHow to draw a climate graph
How to draw a climate graph
 
9 1 Points, Lines, And Planes
9 1 Points, Lines, And Planes9 1 Points, Lines, And Planes
9 1 Points, Lines, And Planes
 
Data management and analysis
Data management and analysisData management and analysis
Data management and analysis
 
How to draw a graph
How to draw a graphHow to draw a graph
How to draw a graph
 

Semelhante a Graph In Excel

Module 6 component of excel chart
Module 6 component of excel chartModule 6 component of excel chart
Module 6 component of excel chart
Dr. Shalini Pandey
 
Creating an excel chart
Creating an excel chartCreating an excel chart
Creating an excel chart
meeker1987
 
Excel Graphs Charts
Excel Graphs ChartsExcel Graphs Charts
Excel Graphs Charts
simply_coool
 
Making an xy scatter plot
Making an xy scatter plotMaking an xy scatter plot
Making an xy scatter plot
ilanasaxe
 
A Skills Approach Excel 2016 Chapter 7 Exploring Advanced C.docx
A Skills Approach Excel 2016  Chapter 7 Exploring Advanced C.docxA Skills Approach Excel 2016  Chapter 7 Exploring Advanced C.docx
A Skills Approach Excel 2016 Chapter 7 Exploring Advanced C.docx
daniahendric
 
Excel 2003 tutorial 4 graphs
Excel 2003 tutorial 4 graphsExcel 2003 tutorial 4 graphs
Excel 2003 tutorial 4 graphs
catacata1976
 
Microsoft excel tutorial06
Microsoft excel tutorial06Microsoft excel tutorial06
Microsoft excel tutorial06
Alam Khan
 

Semelhante a Graph In Excel (20)

How to make_a_line_graph_using_excel_2007
How to make_a_line_graph_using_excel_2007How to make_a_line_graph_using_excel_2007
How to make_a_line_graph_using_excel_2007
 
Module 6 component of excel chart
Module 6 component of excel chartModule 6 component of excel chart
Module 6 component of excel chart
 
Creating an excel chart
Creating an excel chartCreating an excel chart
Creating an excel chart
 
Advanced excel
Advanced excelAdvanced excel
Advanced excel
 
microsoft ecexl
microsoft ecexlmicrosoft ecexl
microsoft ecexl
 
Excel Graphs Charts
Excel Graphs ChartsExcel Graphs Charts
Excel Graphs Charts
 
Making an xy scatter plot
Making an xy scatter plotMaking an xy scatter plot
Making an xy scatter plot
 
Microsoft 2007 Basics
Microsoft 2007 BasicsMicrosoft 2007 Basics
Microsoft 2007 Basics
 
A Skills Approach Excel 2016 Chapter 7 Exploring Advanced C.docx
A Skills Approach Excel 2016  Chapter 7 Exploring Advanced C.docxA Skills Approach Excel 2016  Chapter 7 Exploring Advanced C.docx
A Skills Approach Excel 2016 Chapter 7 Exploring Advanced C.docx
 
CVE 156 lecture 3.pdf
CVE 156 lecture 3.pdfCVE 156 lecture 3.pdf
CVE 156 lecture 3.pdf
 
Excel for beginners class 1
Excel for beginners class 1Excel for beginners class 1
Excel for beginners class 1
 
Excel 2003 tutorial 4 graphs
Excel 2003 tutorial 4 graphsExcel 2003 tutorial 4 graphs
Excel 2003 tutorial 4 graphs
 
Basics of Creating Graphs / Charts using Microsoft Excel
Basics of Creating Graphs / Charts using Microsoft ExcelBasics of Creating Graphs / Charts using Microsoft Excel
Basics of Creating Graphs / Charts using Microsoft Excel
 
Microsoft excel tutorial06
Microsoft excel tutorial06Microsoft excel tutorial06
Microsoft excel tutorial06
 
Microsoft excel tutorial06
Microsoft excel tutorial06Microsoft excel tutorial06
Microsoft excel tutorial06
 
Making Charts in Excel
Making Charts in ExcelMaking Charts in Excel
Making Charts in Excel
 
Excel booklet
Excel bookletExcel booklet
Excel booklet
 
How to plot a scatterplot
How to plot a scatterplotHow to plot a scatterplot
How to plot a scatterplot
 
Excel2002
Excel2002Excel2002
Excel2002
 
04.ms excel
04.ms excel04.ms excel
04.ms excel
 

Último

Why Teams call analytics are critical to your entire business
Why Teams call analytics are critical to your entire businessWhy Teams call analytics are critical to your entire business
Why Teams call analytics are critical to your entire business
panagenda
 

Último (20)

Partners Life - Insurer Innovation Award 2024
Partners Life - Insurer Innovation Award 2024Partners Life - Insurer Innovation Award 2024
Partners Life - Insurer Innovation Award 2024
 
Top 5 Benefits OF Using Muvi Live Paywall For Live Streams
Top 5 Benefits OF Using Muvi Live Paywall For Live StreamsTop 5 Benefits OF Using Muvi Live Paywall For Live Streams
Top 5 Benefits OF Using Muvi Live Paywall For Live Streams
 
Connector Corner: Accelerate revenue generation using UiPath API-centric busi...
Connector Corner: Accelerate revenue generation using UiPath API-centric busi...Connector Corner: Accelerate revenue generation using UiPath API-centric busi...
Connector Corner: Accelerate revenue generation using UiPath API-centric busi...
 
ProductAnonymous-April2024-WinProductDiscovery-MelissaKlemke
ProductAnonymous-April2024-WinProductDiscovery-MelissaKlemkeProductAnonymous-April2024-WinProductDiscovery-MelissaKlemke
ProductAnonymous-April2024-WinProductDiscovery-MelissaKlemke
 
Repurposing LNG terminals for Hydrogen Ammonia: Feasibility and Cost Saving
Repurposing LNG terminals for Hydrogen Ammonia: Feasibility and Cost SavingRepurposing LNG terminals for Hydrogen Ammonia: Feasibility and Cost Saving
Repurposing LNG terminals for Hydrogen Ammonia: Feasibility and Cost Saving
 
Why Teams call analytics are critical to your entire business
Why Teams call analytics are critical to your entire businessWhy Teams call analytics are critical to your entire business
Why Teams call analytics are critical to your entire business
 
Artificial Intelligence Chap.5 : Uncertainty
Artificial Intelligence Chap.5 : UncertaintyArtificial Intelligence Chap.5 : Uncertainty
Artificial Intelligence Chap.5 : Uncertainty
 
Apidays New York 2024 - The value of a flexible API Management solution for O...
Apidays New York 2024 - The value of a flexible API Management solution for O...Apidays New York 2024 - The value of a flexible API Management solution for O...
Apidays New York 2024 - The value of a flexible API Management solution for O...
 
TrustArc Webinar - Stay Ahead of US State Data Privacy Law Developments
TrustArc Webinar - Stay Ahead of US State Data Privacy Law DevelopmentsTrustArc Webinar - Stay Ahead of US State Data Privacy Law Developments
TrustArc Webinar - Stay Ahead of US State Data Privacy Law Developments
 
Bajaj Allianz Life Insurance Company - Insurer Innovation Award 2024
Bajaj Allianz Life Insurance Company - Insurer Innovation Award 2024Bajaj Allianz Life Insurance Company - Insurer Innovation Award 2024
Bajaj Allianz Life Insurance Company - Insurer Innovation Award 2024
 
GenAI Risks & Security Meetup 01052024.pdf
GenAI Risks & Security Meetup 01052024.pdfGenAI Risks & Security Meetup 01052024.pdf
GenAI Risks & Security Meetup 01052024.pdf
 
Strategies for Unlocking Knowledge Management in Microsoft 365 in the Copilot...
Strategies for Unlocking Knowledge Management in Microsoft 365 in the Copilot...Strategies for Unlocking Knowledge Management in Microsoft 365 in the Copilot...
Strategies for Unlocking Knowledge Management in Microsoft 365 in the Copilot...
 
Powerful Google developer tools for immediate impact! (2023-24 C)
Powerful Google developer tools for immediate impact! (2023-24 C)Powerful Google developer tools for immediate impact! (2023-24 C)
Powerful Google developer tools for immediate impact! (2023-24 C)
 
Apidays New York 2024 - The Good, the Bad and the Governed by David O'Neill, ...
Apidays New York 2024 - The Good, the Bad and the Governed by David O'Neill, ...Apidays New York 2024 - The Good, the Bad and the Governed by David O'Neill, ...
Apidays New York 2024 - The Good, the Bad and the Governed by David O'Neill, ...
 
How to Troubleshoot Apps for the Modern Connected Worker
How to Troubleshoot Apps for the Modern Connected WorkerHow to Troubleshoot Apps for the Modern Connected Worker
How to Troubleshoot Apps for the Modern Connected Worker
 
Automating Google Workspace (GWS) & more with Apps Script
Automating Google Workspace (GWS) & more with Apps ScriptAutomating Google Workspace (GWS) & more with Apps Script
Automating Google Workspace (GWS) & more with Apps Script
 
Boost Fertility New Invention Ups Success Rates.pdf
Boost Fertility New Invention Ups Success Rates.pdfBoost Fertility New Invention Ups Success Rates.pdf
Boost Fertility New Invention Ups Success Rates.pdf
 
Workshop - Best of Both Worlds_ Combine KG and Vector search for enhanced R...
Workshop - Best of Both Worlds_ Combine  KG and Vector search for  enhanced R...Workshop - Best of Both Worlds_ Combine  KG and Vector search for  enhanced R...
Workshop - Best of Both Worlds_ Combine KG and Vector search for enhanced R...
 
Exploring the Future Potential of AI-Enabled Smartphone Processors
Exploring the Future Potential of AI-Enabled Smartphone ProcessorsExploring the Future Potential of AI-Enabled Smartphone Processors
Exploring the Future Potential of AI-Enabled Smartphone Processors
 
Tata AIG General Insurance Company - Insurer Innovation Award 2024
Tata AIG General Insurance Company - Insurer Innovation Award 2024Tata AIG General Insurance Company - Insurer Innovation Award 2024
Tata AIG General Insurance Company - Insurer Innovation Award 2024
 

Graph In Excel

  • 1. Step 1: Go to Start Menu Programs Microsoft Excel
  • 2. Step 2: Enter the X axis information in Row 1 Enter the Y axis information in Row 2 See the next slide for an example
  • 3.  
  • 4. The text and numbers can be centered in each box by clicking on the box as shown This highlights the box (see A1 Light). Then click on centering (see red arrow)
  • 5. You can adjust the box grid Lines by placing the cursor at the edge of the grid line At the top of the letter box and then drag the grid line.
  • 6.  
  • 7.  
  • 8. Now click on one of the boxes which contains data. Then click on Chart Wizard.
  • 9. Remember you need to click on a box that contains Data prior to clicking on chart Wizard. Do not click on an empty box such as this one:
  • 10. Double click on picture Choose Your Graph Design And Click “Next”
  • 11. Choose “Rows” And Click “Next”.
  • 12. Enter the titles for the chart and the axis’ then click “Next”
  • 13. Select “As a new Sheet” and click “Finish”
  • 14. To change column colors double click on a column
  • 15.  
  • 16.