
Recomendados
Mais conteúdo relacionado
Semelhante a ITA USA
Semelhante a ITA USA (20)
ITA USA
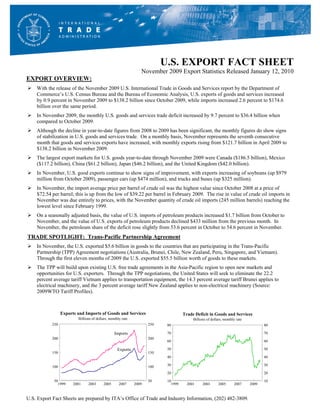
- 1. U.S. EXPORT FACT SHEET November 2009 Export Statistics Released January 12, 2010 EXPORT OVERVIEW: With the release of the November 2009 U.S. International Trade in Goods and Services report by the Department of Commerce’s U.S. Census Bureau and the Bureau of Economic Analysis, U.S. exports of goods and services increased by 0.9 percent in November 2009 to $138.2 billion since October 2009, while imports increased 2.6 percent to $174.6 billion over the same period. In November 2009, the monthly U.S. goods and services trade deficit increased by 9.7 percent to $36.4 billion when compared to October 2009. Although the decline in year-to-date figures from 2008 to 2009 has been significant, the monthly figures do show signs of stabilization in U.S. goods and services trade. On a monthly basis, November represents the seventh consecutive month that goods and services exports have increased, with monthly exports rising from $121.7 billion in April 2009 to $138.2 billion in November 2009. The largest export markets for U.S. goods year-to-date through November 2009 were Canada ($186.5 billion), Mexico ($117.2 billion), China ($61.2 billion), Japan ($46.2 billion), and the United Kingdom ($42.0 billion). In November, U.S. good exports continue to show signs of improvement, with exports increasing of soybeans (up $979 million from October 2009), passenger cars (up $474 million), and trucks and buses (up $325 million). In November, the import average price per barrel of crude oil was the highest value since October 2008 at a price of $72.54 per barrel; this is up from the low of $39.22 per barrel in February 2009. The rise in value of crude oil imports in November was due entirely to prices, with the November quantity of crude oil imports (245 million barrels) reaching the lowest level since February 1999. On a seasonally adjusted basis, the value of U.S. imports of petroleum products increased $1.7 billion from October to November, and the value of U.S. exports of petroleum products declined $433 million from the previous month. In November, the petroleum share of the deficit rose slightly from 53.6 percent in October to 54.6 percent in November. TRADE SPOTLIGHT: Trans-Pacific Partnership Agreement In November, the U.S. exported $5.6 billion in goods to the countries that are participating in the Trans-Pacific Partnership (TPP) Agreement negotiations (Australia, Brunei, Chile, New Zealand, Peru, Singapore, and Vietnam). Through the first eleven months of 2009 the U.S. exported $55.5 billion worth of goods to these markets. The TPP will build upon existing U.S. free trade agreements in the Asia-Pacific region to open new markets and opportunities for U.S. exporters. Through the TPP negotiations, the United States will seek to eliminate the 22.2 percent average tariff Vietnam applies to transportation equipment, the 14.3 percent average tariff Brunei applies to electrical machinery, and the 3 percent average tariff New Zealand applies to non-electrical machinery (Source: 2009WTO Tariff Profiles). Exports and Imports of Goods and Services Trade Deficit in Goods and Services Billions of dollars, monthly rate Billions of dollars, monthly rate 250 250 80 80 Imports 70 70 200 200 60 60 Exports 50 50 150 150 40 40 100 100 30 30 20 20 50 50 10 10 1999 2001 2003 2005 2007 2009 1999 2001 2003 2005 2007 2009 U.S. Export Fact Sheets are prepared by ITA’s Office of Trade and Industry Information, (202) 482-3809.