Mais conteúdo relacionado
Semelhante a Bluechipstockclub (20)
Mais de deborah canning (20)
Bluechipstockclub
- 1. FIT 1020-9:20 D. Canning March 5, 2008
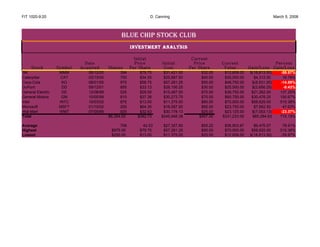
Blue ChIp stoCk CluB
Investment AnAlysIs
Initial Current
Date Price Initial Price Current Percent
Stock Symbol Acquired Shares Per Share Cost Per Share Value Gain/Loss Gain/Loss
3M MMM 06/12/00 394 $79.75 $31,421.50 $32.00 $12,608.00 $(18,813.50) -59.87%
Caterpillar CAT 03/15/00 750 $34.25 $25,687.50 $40.00 $30,000.00 $4,312.50 16.79%
Coca-Cola KO 08/01/00 975 $58.75 $57,281.25 $50.00 $48,750.00 $(8,531.25) -14.89%
DuPont DD 09/12/01 850 $33.13 $28,156.25 $30.00 $25,500.00 $(2,656.25) -9.43%
General Electric GE 12/08/99 525 $29.50 $15,487.50 $70.00 $36,750.00 $21,262.50 137.29%
General Motors GM 10/05/99 810 $37.38 $30,273.75 $75.00 $60,750.00 $30,476.25 100.67%
Intel INTC 10/03/02 875 $13.00 $11,375.00 $80.00 $70,000.00 $58,625.00 515.38%
Microsoft MSFT 01/15/02 250 $64.35 $16,087.50 $95.00 $23,750.00 $7,662.50 47.63%
Wal-Mart WMT 07/09/99 925 $32.63 $30,178.13 $25.00 $23,125.00 $(7,053.13) -23.37%
Total $6,354.00 $382.73 $245,948.38 $497.00 $331,233.00 $85,284.63 710.19%
Average 706 42.53 $27,327.60 $55.22 $36,803.67 $9,476.07 78.91%
Highest $975.00 $79.75 $57,281.25 $95.00 $70,000.00 $58,625.00 515.38%
Lowest $250.00 $13.00 $11,375.00 $25.00 $12,608.00 $(18,813.50) -59.87%
- 2. Stock Quotes Provided by MSN Money
Click here to visit MSN Money
Previous
Last Close High Low
3M Company Chart News 82.09 81.96 82.55 81.95
Caterpillar Inc. Chart News 83.39 84.17 84.51 82.67
The Coca-Cola Company Chart News 50 50.04 50.25 49.85
E.I. DuPont de Nemours Chart News 42.93 42.72 43.04 42.58
General Electric Company Chart News 33.74 33.21 33.74 33.42
General Motors Corporation Chart News 53.38 53.74 53.84 53.19
Intel Corporation Chart News 31.9 31.75 32.02 31.7
Microsoft Corporation Chart News 28.46 28.48 28.73 28.32
Wal-Mart Stores, Inc. Chart News 54.05 54.21 54.5 53.77
Symbol Lookup MSN Money Home Microsoft Office Tools on the W
Find stocks, mutual funds, options, Discover MSN Money's tools, Get the latest from Microsoft Offic
indices, and currencies. columns, and more!
Terms of Use. © 2002 Microsoft Corporation and/or its suppliers. All rights reserved.
Quotes supplied by Standard & Poor's ComStock, Inc. and are delayed at least 20 minutes. NYSE, AMEX, and NASDAQ inde
Fund data provided by Morningstar, Inc. © 2002. All rights reserved.
Canadian investment fund pricing (c) 2002 CANNEX Financial Exchanges Limited
- 3. Volume Change % Change 52 Wk High 52 Wk Low Market Cap EPS P/E Ratio
1,805,400 0.13 0.16% 86.2 59.73 64,431,042,596 3.02 27.1
917,300 -0.78 -0.93% 85.16 41.24 28,956,343,388 3.02 27.9
2,079,600 -0.04 -0.08% 50.99 37.01 122,575,600,000 1.68 29.8
1,470,600 0.21 0.49% 46.17 34.71 42,791,636,914 0.7 61
9,997,600 0.53 1.60% 34.05 21.3 338,778,633,253 1.49 22.3
2,069,900 -0.36 -0.67% 55.55 29.75 30,134,752,000 6.8 7.9
20,768,512 0.15 0.47% 34.6 14.88 208,370,797,508 0.69 46
31,664,302 -0.02 -0.07% 30 22.55 307,510,290,108 0.92 31
5,437,600 -0.16 -0.30% 60.2 46.25 233,916,559,748 2.01 27
Microsoft Office Tools on the Web
Get the latest from Microsoft Office
NYSE, AMEX, and NASDAQ index data are provided real time.
- 4. # Shares Out
784,883,000
347,240,000
2,451,512,000
996,777,000
10,040,860,000
1,669,654,000
6,532,000,000
10,805,000,000
4,327,781,000