SlideShare uma empresa Scribd logo
1 de 25
Baixar para ler offline
SOFTWARE & SERVICES                                                                                                                                                                                                                          2 JUNE 2009
                                                                                                                                                                                        DAVID SHORE, CFA, MBA 416.860.6784
WEB 2.O WEEKLY                                                                                                                                                                                          david.shore@researchcapital.com
                                                                                                                                                                                                   Arun Thomas (Associate) 416.860.7666

 SOCIAL NETWORKS LEAD ACTIVITY – DIGITAL SKY TECHNOLOGIES INVESTS IN FACEBOOK
 MA Y CL O S E S AT H IG H E S T L E V EL I N OV E R T W EL V E MO NT H S
 The month of May saw 20 financings totalling $327.1 million, buoyed by Digital Sky Technologies’ $200 million
 investment in Facebook. W ithout this transaction, May would have been the lowest month for financing year-to-date at
 $127.1 million in 2009. From a sector perspective, excluding the Facebook transaction, Ad Network saw the highest
 level of activity over the last three months, with Media, Gaming, Video, and Social Network attracting the most level
 of interest. The other transaction of size that gained much real estate on business news was Disney’s investment in
 Hulu. Both transactions highlight traditional companies marrying into new business models that are testing the
 frontiers of how consumers choose and use media.


                                                                                                             Financing by Month

                800.0                                                                                                                                                                                                                             40
                                                                                                                                                                                750.6


                700.0                                                                                                                                                                                                                             35
                                                                                                                                                    653.9


                600.0                                                                                                                                                                                                                             30


                500.0                                                                                                                                                                                                                             25
                                                                                                                                                                                    461.7
      (U $m )
        S m


                                                                                                                                                                                                                                                       (#)
                400.0                                                                                                                                                                                                                             20
                                                                                                                                                                           361.3
                                                                                                                                                                  351.4
                                                                                                                                                                                                                                          327.1
                                                                                                                                                                                                      308.3
                300.0                                                                                                                                                                                                                             15

                                                                                                                                                              244.0
                                                                                                                                                                                                                        225.8
                                                                                                                                     192.6                                                   198.0
                200.0                                                                                                                                                                                                        185.5                10
                                                                                                                                                                                                                                162.5
                                                                                                                                                                       144.9                                                       149.5
                                                                                                                                          129.0                                         132.3              127.4 125.6
                                                          111.0
                                                                                                                                                                                                              101.1
                100.0                                                                              87.3              88.5       84.9                       79.7                                                                                   5
                                                                66.3                                                                                                                               73.6
                                                                         57.7                                                                    57.1
                                                                   40.5              48.0
                                                                                  43.4                     47.5            47.6
                                                                      38.8     32.3                           38.8
                             21.4     24.4
                                   23.9                                     21.5                                        30.0
                          9.4   12.5        15.4
                                         13.2
                  0.0                                                                                                                                                                                                                             0
                                                                   6


                                                                                                                           7


                                                                                                                                                                                    8


                                                                                                                                                                                                                                          9
                               5


                                        5


                                                          6


                                                                                     6


                                                                                              6


                                                                                                                 7


                                                                                                                                             7


                                                                                                                                                       7


                                                                                                                                                                           8


                                                                                                                                                                                                      8


                                                                                                                                                                                                               8


                                                                                                                                                                                                                                 9
                                                06


                                                                                                      07


                                                                                                                                                                 08


                                                                                                                                                                                                                       09
                      5


                                                                            6


                                                                                                                                    7


                                                                                                                                                                                             8
                                                                 -0


                                                                                                                         -0


                                                                                                                                                                                  -0


                                                                                                                                                                                                                                        -0
                             -0


                                      -0


                                                                                   -0


                                                                                            -0


                                                                                                                                           -0


                                                                                                                                                     -0


                                                                                                                                                                                                    -0


                                                                                                                                                                                                             -0
                                                        -0


                                                                                                               -0


                                                                                                                                                                         -0


                                                                                                                                                                                                                               -0
                   l-0


                                                                         l-0


                                                                                                                                 l-0


                                                                                                                                                                                          l-0
                                              n-


                                                                                                    n-


                                                                                                                                                               n-


                                                                                                                                                                                                                     n-
                                    ov


                                                               ay


                                                                                          ov


                                                                                                                       ay


                                                                                                                                                   ov


                                                                                                                                                                                ay


                                                                                                                                                                                                           ov


                                                                                                                                                                                                                                      ay
                           ep


                                                                                 ep


                                                                                                                                         ep


                                                                                                                                                                                                  ep
                                                      ar


                                                                                                             ar


                                                                                                                                                                       ar


                                                                                                                                                                                                                             ar
                 Ju


                                                                       Ju


                                                                                                                               Ju


                                                                                                                                                                                        Ju
                                            Ja


                                                                                                  Ja


                                                                                                                                                             Ja


                                                                                                                                                                                                                   Ja
                                                     M


                                                                                                            M


                                                                                                                                                                      M


                                                                                                                                                                                                                            M
                                                              M


                                                                                                                      M


                                                                                                                                                                               M


                                                                                                                                                                                                                                     M
                                   N


                                                                                         N


                                                                                                                                                  N


                                                                                                                                                                                                          N
                          S


                                                                                S


                                                                                                                                        S


                                                                                                                                                                                                 S


  Capital Market Activity: The month of May closed with 20 financings totalling $327.1 million led by the $200 million
  investment by Digital Sky Technologies in Facebook. Excluding the Facebook transaction, May would have been the
  lowest month in CY2009. The Facebook transaction aside, four transactions (One Net Ent., Cyberplex, Peer39, and
  OpenX) were greater than or equal to $10 million. The average value in May is $15.6 million (and $6.4 million
  excluding the Facebook transaction), greater than the average value for April of $6.2 million on 21 financings. The
  March average was $6.5 million on 24 financings.
  Price Performance: Most of the companies in our universe had positive stock price performances over the past
  week (for stocks with prices greater than $1) (Figure 12), with 29 companies showing positive returns on the week.
  GameOn co. Ltd (3812-TSE) led the group with a 28.2% return, while eolith Co. Ltd. (A041060-KOSE) had the worst
  return, dropping 13.7% in the week.


  This report has been created b y Anal ysts that are emplo yed b y Research Capital Corporation, a Canadian Investment Dealer.
                                   For further disclosures, please see last page of this report.
                                                                                                              w w w . r e s e a rc h c a p i t a l . c o m
T o ro n t o 4 1 6 . 8 6 0 . 7 6 0 0                    Montreal 514.399.1500                                 Vancouver 604.662.1800                                      Calgary 403.265.7400                                   Regina 306.566.7550
Page 2


THE WEB 2.0 UNIVERSE
 Ninety-three public Web 2.0 companies identified: Our W eb 2.0 universe contains 93 companies, with a combined
 market cap of ~$53 billion (Figure 1). The average market cap for the group is ~$577 million (but a median of only $50.9
 million), with average trailing revenue of $152.1 million (median $54.3 million). The companies are also generally
 profitable, with a median EBITDA margin of 14.2%. On a valuation basis, the overall average is 4.9x trailing revenue
 (median 2.0x) and 10.0x trailing EBITDA (median 9.6x). Fourteen of the companies have more than 500 employees.
 C omparable C o mpany A nalys is > W eb 2.0
                                                                                                  Trading                     Current        U S D Market   U S D LT M To tal   US D L TM T otal   E BITDA   TE V/LT M   T E V/LT M
 C om pan y Nam e                                 L TM as of T icker              E xc hange     Cu rrency H Q                 P rice         C ap ($m)         R ev ($m)        E B ITDA ($m)        %      R evenu e    E B IT DA   E mployees
 Acce le rize N ew Me dia, Inc.                    3 /31 /200 9   AC LZ           OT C B B         USD     U nited S ta tes          0 .35         9 .7              4.1              (4 .4)          NM        3.5 x         -             11
 Actoz S of t C o., L td.                          3 /31 /200 9   A0 527 90       K OS E           KR W    S outh K orea           26, 300       18 2.2            93. 7              2 0.4         21 .7%      1.6 x       7.5x           NA
 AQ Inte ractive , Inc.                           1 2/31 /200 8   38 38           TSE              JPY     J apan              80 ,000 .00        4 5.0            62. 4               5 .0         8 .0%      0.2 x        3.0x           NA
 As s o cia ted Media H oldings Inc.               6 /30 /200 7   AS MH           OT C P K         USD     U nited S ta tes              0         0 .1             0.1               (2 .3)          NM       8.1 x          -             3
 B igstring Co rp.                                 3 /31 /200 9   BS GC           OT C B B         USD     U nited S ta tes          0 .02         1 .0              0.1              (2 .0)          NM       30.7 x         -              4
 B e tawave Corpora tion                           3 /31 /200 9   B W AV          OT C B B         USD     U nited S ta tes              0         2 .3             8.4              (1 2.6)          NM          -           -             53
 B e yo nd Commerce, In c.                         3 /31 /200 9   B Y OC          OT C B B         USD     U nited S ta tes          1 .01        4 4.8             7.1               (9 .5)          NM       7.0 x          -             69
 B right T hings plc                               9 /30 /200 8   AIM:B G T       AIM              GBP     U nited K ingdom              0         4 .8             0.3               (1 .9)          NM       17.6 x         -              9
 B roa dW ebAs ia Inc.                             9 /30 /200 8   BW BA           OT C P K         USD     U nited S ta tes          0 .30        2 5.3              0.0              (4 .6)          NM          -           -             46
 C DC C orp.                                       3 /31 /200 9   C HIN .A        N as da qG S     USD     H ong K on g                  2       18 0.4           389 .9              3 0.8         7 .9%      0.5 x        6.3x           NA
 C ha ngyou. com Limite d                          3 /31 /200 9   C Y OU          N as da qG S     USD     C hina                   35 .77      1,9 67.4          222 .5             13 5.1         60 .7%      8.0 x      1 3.2 x        628
 C hina G ate wa y C orpo ra tion                  9 /30 /200 8   C GW Y          OT C P K         USD     U nited S ta tes              0         0 .0              6.7              (6 .6)       -9 8.9%      0.0 x         -             37
 C hine s e G amer International                   3 /31 /200 9   G T S M:308 3   GTSM             TWD     T aiwan                 376 .50       98 0.3             57. 2             3 2.0         56 .0%     16.0 x      2 8.5 x         NA
 C ornerW orld C orporation                        1 /31 /200 9   C WR L          OT C B B         USD     U nited S ta tes              0         5 .8             1.3                NM             NM        5.5 x         -            NA
 C yberplex Inc.                                   3 /31 /200 9   T S X:C X       TSX              C AD    C ana da                  1 .57        7 7.4            74. 9               7 .7         10 .3%      1.0 x       9.5x           NA
 DADA S pA                                         9 /30 /200 8   C M:D A         CM               EUR     Ita ly                        6       13 6.7           240 .4              3 8.4         16 .0%      0.8 x       4.9x          578
 DXN Holdings B hd                                 2 /28 /200 9   DXN             KLSE             MY R    Ma la ys ia               0 .40        2 6.2             79. 7             1 0.9         13 .7%      0.5 x       3.9x           NA
 Dibz Inte rnational, Inc.                             NA         DIB Z           OT C P K         USD     U nited S ta tes              0         0 .0             NA                 NM             NM          -           -            NA
 DigitalP ost Inte ra ctive , Inc.                 3 /31 /200 9   DG LP           OT C B B         USD     U nited S ta tes          0 .02         1 .1             0.7               (2 .6)          NM        3.8 x         -              7
 DigitalT own, In c.                               2 /28 /200 9   DG T W          OT C B B         USD     U nited S ta tes              2        5 4.2             NM                (3 .0)          NM          -           -              3
 Dolphin D igital Me dia, Inc.                     3 /31 /200 9   DP DM           OT C B B         USD     U nited S ta tes          0 .53        2 7.4              0.8              (3 .7)          NM       36.7 x         -            NA
 E o lith C o. L td.                              1 2/31 /200 8   A0 410 60       K OS E           KR W    S outh K orea               725        4 2.8            14. 9              (3 .5)       -2 3.6%     3.0 x          -            NA
 E xte ns ions , Inc.                              3 /31 /200 9   E XT I          OT C P K         USD     U nited S ta tes          0 .15        1 4.2             NM                 NM             NM          -           -              2
 F inancia l Media G roup, Inc.                    2 /28 /200 9   F NG P          OT C B B         USD     U nited S ta tes              0         0 .2             7.2                2 .4         34 .1%        -           -             22
 F luid Mus ic Ca nada, In c.                      3 /31 /200 9   T S X:F MN      TSX              C AD    U nited S ta tes          0 .75        3 6.2              5.0              (6 .9)          NM        5.2 x         -            NA
 F rogs te r Interactive P ictu re s AG            6 /30 /200 8   FRG             XT R A           EUR     G ermany                      7        2 4.8              5.7              (3 .5)       -6 0.6%      4.3 x         -            NA
 G a ma nia Digital E ntertainmen t C o., L td.    3 /31 /200 9   61 80           GTSM             TWD     T aiwan                  58 .60       27 5.6           128 .3              2 1.3         16 .6%      2.0 x      1 1.8 x         NA
 G a me On C o L td.                               3 /31 /200 9   38 12           TSE              JPY     J apan                1 24, 000       12 4.0             76. 1             1 8.0         23 .7%      0.8 x       3.5x           NA
 G e oS e ntric O yj                               3 /31 /200 9   G E O1 V        H LS E           EUR     F inland                  0 .05        6 3.7              6.0             (1 5.5)          NM        9.9 x         -           108
 G ian t Intera ctive G roup, Inc.                 3 /31 /200 9   GA              NYS E            USD     C hina                        8      1,7 86.7          219 .1               NM             NM          -           -            NA
 G iga Media Ltd.                                 1 2/31 /200 8   G IG M          N as da qG S     USD     T aiwan                   6 .19       33 4.4           190 .4              4 6.0         24 .2%      1.4 x       5.6x           NA
 G ravity C o., L td                               9 /30 /200 8   GR VY           N as da qG M     USD     S outh K orea                 1        3 0.6             39. 7              7 .6         19 .2%        -           -           636
 G ree, Inc.                                       6 /30 /200 8   T S E : 363 2   TSE              JPY     J apan               5 ,630 .00      1,3 00.4            30. 4             1 0.9         36 .0%     40.1 x         -            NA
 G u ngH o O nline E ntertainment, Inc.           1 2/31 /200 8   37 65           OS E             JPY     J apan                2 48, 000       29 3.8           116 .3              2 0.7         17 .8%      2.3 x      1 3.1 x         NA
 H anbitS of t, Inc.                               3 /31 /200 9   A0 470 80       K OS E           KR W    S outh K orea        5 ,290 .00        9 4.0            56. 0             (1 5.0)       -2 6.8%     1.4 x          -            NA
 IAC /InterActiveC orp.                            3 /31 /200 9   IAC I           N as da qG S     USD     U nited S ta tes             17      2,5 00.7         1 ,40 6.4            4 2.6         3 .0%       0.4 x      1 4.4 x       3 ,20 0
 IAS E n ergy, Inc.                                1 /31 /200 9   IAS C.A         OT C B B         USD     C ana da                  0 .23        1 6.1              0.0              (0 .8)          NM          -           -            NA
 is ee media Inc.                                 1 2/31 /200 8   IE E            T S XV           C AD    C ana da                      0         3 .8              1.4              (5 .5)          NM        1.4 x         -            NA
 J umbuck E ntertainment P ty Ltd.                1 2/31 /200 8   AS X:J MB       AS X             AU D    Aus tra lia               0 .45        1 8.0             14. 5              5 .4         37 .2%      0.9 x       2.4x            72
 J umpT V Inc.                                    1 2/31 /200 8   T S X:J T V     TSX              C AD    C ana da                      1        8 3.7            13. 4              (8 .4)       -6 2.6%      4.7 x         -           237
 K a boos e Inc.                                   3 /31 /200 9   T S X:K AB      TSX              C AD    C ana da                  0 .61        7 8.5             75. 7              9 .0         11 .9%      1.1 x       9.3x           NA
 K ings oft Co. Ltd.                               3 /31 /200 9   38 88           S E HK           HKD     C hina                        5       73 1.5           129 .2              5 2.0         40 .3%      5.2 x      1 2.9 x       2 ,27 1
 Lin go M edia Corporation                        1 2/31 /200 8   T S XV : LM     T S XV           C AD    C ana da                  1 .05        1 2.4             0.9               (1 .5)          NM       11.6 x         -            NA
 Live Wo rld Inc.                                  3 /31 /200 9   LV WD           OT C P K         USD     U nited S ta tes              0         2 .6             11. 4             (0 .0)        -0 .4%      0.1 x         -            NA
 Lo okS mart, Ltd.                                 3 /31 /200 9   LOOK            N as da qG M     USD     U nited S ta tes          1 .30        2 2.2            60. 7              (3 .8)        -6 .3%        -           -             90
 Magnitu de Information S ys tems Inc.             3 /31 /200 9   MA G Y          OT C B B         USD     U nited S ta tes              0         6 .8              0.1              (3 .1)          NM          -           -             14
 Mixi, In c.                                       3 /31 /200 9   21 21           TSE              JPY     J apan             458 ,000 .00       72 8.2           124 .7              4 4.2         35 .4%      4.9 x      1 3.8 x         NA
 Mode rn Times G rou p Mtg AB                      3 /31 /200 9   MT G B          OM               S EK    S weden                     233      2,0 68.2         1 ,81 7.2           27 8.4         15 .3%      1.5 x       9.5x         2 ,96 9
 Moggle , Inc                                      3 /31 /200 9   MMOG            OT C B B         USD     U nited S ta tes          2 .30        8 3.5             NM                 NM             NM          -           -              3
 MOK O.mobi L imited                              1 2/31 /200 8   MK B            AS X             AU D    Aus tra lia                   0         4 .6              1.2              (2 .4)          NM        3.0 x         -            NA
 Myriad G rou p AG                                1 2/31 /200 8   MY R N          SWX              C HF    S witzerla nd             5 .75       11 4.5            40. 0               0 .8         1 .9%       3.1 x         -           405
 N E OW IZ G ames C orpora tion                   1 2/31 /200 8   A0 956 60       K OS E           KR W    S outh K orea           77, 100       60 2.0           200 .9              5 3.9         26 .8%     2.9 x       1 1.0 x         NA
 N etD rago n W ebS oft, Inc.                      3 /31 /200 9   77 7            S E HK           HKD     C hina                    5 .42       36 9.6            87. 0              3 4.4        39 .5%      2.7 x        6.8x         2 ,42 6
 N ete as e.com I nc.                              3 /31 /200 9   NT E S          N as da qG S     USD     C hina                       36      4,4 06.5          470 .9             30 6.0         65 .0%        -           -            NA
 N eXplo re Co rpora tion                          9 /30 /200 7   N XP C          OT C P K         USD     U nited S ta tes          0 .70        3 9.0             NM                (4 .9)          NM          -           -             19
 N gi G roup Inc.                                 1 2/31 /200 8   24 97           TSE              JPY     J apan                  34, 700        4 4.3           101 .7              3 1.3         30 .8%        -           -            NA
 N orthgate Te chno lo gies L imited               3 /31 /200 9   59 005 7        BS E              INR    India                    47 .05        3 5.0           119 .4             (2 8.0)       -2 3.5%      0.3 x         -            NA
 Open T e xt Corp.                                 3 /31 /200 9   OT E X          N as da qG S     USD     C ana da                     36      1,8 77.1          782 .6             19 9.2         25 .5%      2.5 x       9.8x         3 ,40 0
 Openwave S ys tems Inc.                           3 /31 /200 9   OP W V          N as da qG S     USD     U nited S ta tes          1 .86       15 4.5           197 .2              (2 .1)        -1 .0%      0.3 x         -           630
 P e rf ect W orld C o., Ltd.                      3 /31 /200 9   PW R D          N as da qG S     USD     C hina                       23      1,1 89.7          228 .3             12 4.7         54 .6%      0.1 x       0.1x           NA
 P h otoChann el N etwork s Inc.                   3 /31 /200 9   T S XV : P N    T S XV           C AD    C ana da                  1 .54        4 8.5            19. 9               0 .5         2 .3%      2.4 x          -            NA
 Qu epa s a C orp.                                 3 /31 /200 9   QP S A          N as da qC M     USD     U nited S ta tes              1        1 3.0              0.1             (1 0.8)          NM          -           -             74
 OA O R B C Information S ys tems                 1 2/31 /200 7   R BCI           R TS             USD     R us s ia                 1 .35       18 7.3           154 .7              2 0.2         13 .1%      0.0 x       0.3x           NA
 S h anda In teractive E ntertainme nt L td.      1 2/31 /200 8   S N DA          N as da qG S     USD     C hina                       60      4,1 78.9          522 .6             24 0.1         46 .0%      0.4 x       0.8x           NA
 S h utte rf ly, In c.                             3 /31 /200 9   S F LY          N as da qG S     USD     U nited S ta tes         15 .13       38 0.9           215 .2              2 8.3         13 .2%      1.5 x      1 1.1 x        514
 S K C ommun ications Co., Ltd.                   1 2/31 /200 8   A0 662 70       K OS E           KR W    S outh K orea           12, 000       40 0.2           186 .7              1 2.1         6 .5%       2.1 x      3 3.0 x         NA
 S N AP Inte ra ctive , Inc.                       3 /31 /200 9   S T VI          OT C B B         USD     U nited S ta tes          0 .79         8 .5              3.3               0 .9         28 .0%      2.2 x       7.7x            11
 S N M G lobal H oldings                           9 /30 /200 8   S N MN          OT C P K         USD     U nited S ta tes              0         0 .0             2.0               (0 .7)       -3 4.8%      1.1 x         -             33
 S o cia l Media V e nures , In c.                1 2/31 /200 8   S MV I          OT C P K         USD     U nited S ta tes          0 .01         0 .0             0.1               (0 .1)       -6 0.5%     0.0 x          -            NA
 S o cia lwis e, Inc.                              3 /31 /200 9   S C LW          OT C B B         USD     U nited S ta tes              1        3 0.3              0.0              (4 .8)          NM          -           -            NA
 S o hu. com Inc.                                  3 /31 /200 9   S OH U          N as da qG S     USD     C hina                   66 .25      2,5 35.0          460 .0             20 0.5         43 .6%      4.7 x      1 0.8 x       3 ,19 7
 S ite s earch C orpo ration                       1 /31 /200 9   S T PC          OT C B B         USD     U nited S ta tes              3        2 8.2             NM                (1 .1)          NM          -           -             15
 S park N etworks , Inc.                           3 /31 /200 9   LOV             AME X            USD     U nited S ta tes          2 .29        4 7.1            54. 3              1 1.8         21 .7%      0.9 x       4.0x          183
 S pectrumDN A, Inc.                               3 /31 /200 9   S P XA          OT C B B         USD     U nited S ta tes              0        1 8.0              0.1              (2 .6)          NM          -           -              7
 T encent Holdin gs L td.                          3 /31 /200 9   70 0            S E HK           HKD     C hina                   85 .60     19,9 07. 1        1 ,20 4.5           57 7.1         47 .9%     18.0 x      3 7.5 x       6 ,19 4
 T he P aren t C ompan y                            8/2/2008      K IDS .Q        OT C P K         USD     U nited S ta tes              0         0 .4           112 .0             (1 3.5)       -1 2.0%      0.2 x         -           347
 T he 9 L imited                                  1 2/31 /200 8   N CT Y          N as da qG S     USD     C hina                    9 .27       24 8.6           250 .1              8 4.2         33 .7%        -           -            NA
 T he S treet.com, Inc.                            3 /31 /200 9   TSCM            N as da qG M     USD     U nited S ta tes              2        6 0.0             67. 0              1 .9         2 .9%         -           -           310
 T otal S po rt Online A S                         3 /31 /200 6   T OS O          OT C NO          NOK     N orwa y                  0 .03         0 .1              2.2              (1 .1)       -5 0.6%      4.6 x         -             16
 T ree.C om, Inc.                                  3 /31 /200 9   TR EE           N as da qG M     USD     U nited S ta tes             11       11 5.8           215 .6             (1 3.3)        -6 .2%      0.5 x         -           700
 U nis erve C ommu nication s Co rp.               2 /28 /200 9   T S XV : US S   T S XV           C AD    C ana da                  0 .06         1 .2             24. 0              0 .1         0 .2%       0.2 x         -            NA
 U nited Online Inc.                               3 /31 /200 9   U NT D          N as da qG S     USD     U nited S ta tes              7       58 1.7           811 .2             17 7.3         21 .9%      1.1 x       4.9x         1 ,46 9
 U OMO Media , Inc                                 1 /31 /200 9   U OMO           OT C B B         USD     C ana da                  0 .16        1 3.7              0.6              (0 .5)       -7 8.2%     22.1 x         -            NA
 V a lueC lick Inc.                                3 /31 /200 9   V C LK          N as da qG S     USD     U nited S ta tes             11       98 0.1           591 .7             10 5.5         17 .8%      1.5 x       8.3x         1 ,18 9
 V O IS , Inc.                                     3 /31 /200 9   V OIS           OT C B B         USD     U nited S ta tes          0 .35         2 .9              0.0              (1 .1)          NM          -           -              4
 W ebze n Inc.                                     3 /31 /200 9   W ZE N          N as da qG M     USD     S outh K orea                 5        5 3.4             23. 3             (0 .4)        -1 .9%        -           -           314
 W izza rd S of twa re Corpora tion                3 /31 /200 9   W ZE            AME X            USD     U nited S ta tes          0 .55        2 6.3              5.6              (5 .1)       -9 1.5%      4.9 x         -           110
 W orlds .com In c.                                3 /31 /200 9   W DD D          OT C B B         USD     U nited S ta tes              0         5 .2             0.0               (0 .8)          NM          -           -              1
 W ynds torm C orporatio n                             NA         W YND           OT C B B         USD     U nited S ta tes          0 .51         9 .2             NA                 NM             NM          -           -            NA
 XIN G AG                                          3 /31 /200 9   O1B C           XT R A           EUR     G ermany                     34       25 1.6            53. 7              1 6.8         31 .2%      3.7 x      1 1.9 x        239
 Y e dangOnline Co rp.                            1 2/31 /200 7   A0 527 70       K OS E           KR W    S outh K orea       10 ,200 .00       12 9.8             55. 6             1 2.4         22 .4%      2.3 x      1 0.4 x         NA
 Y n k K orea Inc.                                1 2/31 /200 7   A0 237 70       K OS E           KR W    S outh K orea            7, 700        1 5.3             15. 8             (1 .2)        -7 .6%      0.9 x         -            NA
 ZipLocal Inc.                                     3 /31 /200 9   T S XV : ZIP    T S XV           C AD    C ana da                  0 .01         0 .4             2.8               (2 .2)       -7 8.3%     0.6 x          -            NA
 H igh                                                                                                                                         19,9 07. 1        1 ,817 .2           57 7.1         65 .0%     40.1 x      3 7.5 x       6 ,194
 Lo w                                                                                                                                             0 .0              0.0              -28.0         -9 8.9%     0.0 x        0.1x            1
 A vera ge                                                                                                                                      577.0             152 .1             32.9           6 .0%      4.9x        10.0x          671
 Median                                                                                                                                          5 0.9             54. 3              0 .6          14 .2%      2.0 x       9.6x          237


Figure 1. Web 2.0 Universe Summary
Source. Capital IQ
Page 3


C A P I T A L M A R K E T S A C T I V I T Y (M & A A N D F I N A N C I N G )
Activit y peaks in May – the highest in last 12 months and YTD CY2009: The month of May closed with 20 financings
totalling $327.1 million led by the $200 million investment by Digital Sky Technologies in Facebook. The Facebook
transaction aside, four transactions (One Net Ent., Cyberplex, Peer39, and OpenX) were greater than or equal to $10
million. The average value in May is $15.6 million (and $6.4 million excluding the Facebook transaction), greater than the
average value for April of $6.2 million on 21 financings. The March average was $6.5 million on 24 financings. For the last
three months, except for four deals (Kaixin001.com, Collective Media, One Net Entertainment, and Facebook), all were
below $20 million and a total of six deals were greater than or equal to $15 million.


                                                Financing Activity Last Three Months

             350.0                                                                                                 18.0


                                                                                                                   16.0
             300.0                                                                 15.6


                                                                                                                   14.0

             250.0

                                                                                                                   12.0


             200.0
                                                                                                                   10.0
    (US$m)


                                                                                                                          (US$m)
                                                                                                                   8.0
             150.0
                                          6.5
                                                      6.2                                               6.4
                                                                                                                   6.0

             100.0

                                                                                                                   4.0


              50.0
                                                                                                                   2.0


               0.0                                                                                                 0.0
                                    Mar-09        Apr-09                       May-09          May-09 (excl FB)

                                                             Total   Average


Figure 2. Financings, Last Three Months
Source. Company reports

Facebook largest deal in April: Digital Sky Technologies announced a $200 million investment in Facebook last week,
the largest deal so far in the last 12 months. The Facebook transaction aside, 14 of the 20 deals in the month are equal to
or greater than $5 million. For additional details, see Figures 29 and 30 (at end of note). Also note that the spin-off of
StumbleUpon from E-bay on a $29 million valuation occurred in May. E-bay had bought StumbleUpon for $75 million.
Page 4


                                                       Financing & M/A Summary - Last Three Months

              250.0


              200.0


              150.0

                                                                                                                       May-09
     (US$m)


                                                                                                                       Apr-09
                                                                                                                       Mar-09

              100.0


               50.0


                0.0

                                       Pixazza
                                     Mixercast
                            Collective Media


                              Marin Software


                                           Miva


                                    EveryZing


                          AnySource Media


                                       VoxPop


                                        Myngle
                                    Cyberplex
                                       Buzznet


                                        OpenX


                                           OLX


                                     Socialtext


                                   TubeMogul
                                GOOM Radio
                                          Vidyo


                                    Greystripe

                                        Viximo


                                  IMShopping


                                   Tribal Nova
                             I Love Rewards


                                     Medialets


                                         Topsy


                         Resonate Networks


                                          Bit.ly

                                      Mo'Minis

                                  Brandtology
                              Kaixin001.com


                                 SendMe Inc.


                                    OMGPOP


                                 DoubleTwist


                                           Tynt
                                       GoViral
                                 LendingClub

                                        Peer39
                                      Auditude


                                      Cellufun
                                 Glam Media


                                      Batanga


                                     DocuSign


                                         Apture


                                 SoundCloud


                                      Tripbase


                                         Hunch


                                   AdultSpace

                                      Jodange


                                      Foodista
                                     Facebook


                           Visible Measures


                              Azuki Systems


                             Loop'd Network
                                     33Across
                               Three Melons
                        The Rubicon Project


                                 SuperSecret
                              Conductor Inc.


                                   ScanScout

                                 BlogHer Inc.
                                           Gist
                                     Fuhu Inc.


                       Sports Composite DE


                                    Socialcast

                               Scan & Target
                                StumbleUpon


                                   TimeBridge
                      One Net Entertainment


                                  Simulmedia
                                        Imeem
                                   FreeWheel


Figure 3. Capital Market Activity, Last Three Months
Source. Company reports

 Social Network remains the most active sector: Activity over the last three months was busiest in the Social Network
 sector, with eight companies raising over $249.3 million (Figure 4). The Ad Network sector has the next highest totals,
 with 12 companies raising $99.2 million. W e would note that the Facebook transaction at $200 million has skewed the
 results significantly in favour of Social Networks. Nevertheless, the following sectors continue to generate the most capital
 activity over the last few months: Ad Network, Media, Gaming, Video, and Social Networks.
Page 5


                                                                                                                      Capital Market Activity by Sector - Last Three Months

             300.0


             250.0


             200.0
    (US$m)


             150.0

                     249.3

             100.0


              50.0                      99.2
                                                      63.4
                                                               50.6      49.5
                                                                                  30.2                  21.3      14.4         12.0       12.0      10.4      8.9              7.5             7.0    6.8           5.9          5.5
               0.0                                                                                                                                                                                                                           5.0             4.7               4.1          3.1                 2.0          2.0         2.0      1.3   1.3               0.6
                                                                                   Comment/Reputation


                                                                                                                                                                                                                                                             Social Commerce
                                                                Gaming


                                                                                                                                                                                                                                                                                            Visual Commerce


                                                                                                                                                                                                                                                                                                                                         Travel


                                                                                                                                                                                                                                                                                                                                                                          Wiki
                                                       Media


                                                                                                                                           Mobile


                                                                                                                                                                                                                    Enterprise


                                                                                                                                                                                                                                             Collaboration


                                                                                                                                                                                                                                                                               Publishing


                                                                                                                                                                                                                                                                                                                             Microblog


                                                                                                                                                                                                                                                                                                                                                        Online Learning
                                                                                                                                                                                                                                 Mobile Ad
                                                                                                                                                     Widget
                                                                                                         Search


                                                                                                                                Lending


                                                                                                                                                              Infrastructure


                                                                                                                                                                                               Blog
                      Social Networks


                                                                                                                                                                                                                                                                                                                                                  SAS
                                                                          Video


                                                                                                                                                                               Virtual World


                                                                                                                                                                                                      Aggregation


                                                                                                                                                                                                                                                                                                              Crowdsourced
                                         Ad Network


                                                                                                                   Analytics


                                                                                                                                                                                                                                                                                                                 Content
  # companies

                         8              12              8        9         5          2                   3         3            1          1         2         2                2             1        1             1           1            1                1                1             1                  1           1           1       1        1              1


Figure 4. Capital Market Activity, by Sector, Last Three Months
Source. Company reports

 Average round size decreases: On a trailing 12-month basis, total financing dollars fell as of May 2009, with average
 round sizes decreasing slightly (Figure 5).
Page 6


                                                                                                                 LTM Financing

             4,000.0                                                                                                                                                                                                                                    18.0


                                                                                                                                                                                                                                                        16.0
             3,500.0


                                                                                                                                                                                                                                                        14.0
             3,000.0


                                                                                                                                                                                                                                                        12.0
             2,500.0


                                                                                                                                                                                                                                                        10.0
    (US$m)


                                                                                                                                                                                                                                                               (US$m)
             2,000.0
                                                                                                                                     `
                                                                                                                                                                                                                                                        8.0


             1,500.0
                                                                                                                                                                                                                                                        6.0


             1,000.0
                                                                                                                                                                                                                                                        4.0


              500.0
                                                                                                                                                                                                                                                        2.0


                 0.0                                                                                                                                                                                                                                    0.0
                                                                    May-06


                                                                                                                            May-07


                                                                                                                                                                                         May-08


                                                                                                                                                                                                                                               May-09
                                         Nov-05


                                                           Mar-06


                                                                                               Nov-06


                                                                                                                 Mar-07


                                                                                                                                                              Nov-07


                                                                                                                                                                                Mar-08


                                                                                                                                                                                                                    Nov-08


                                                                                                                                                                                                                                      Mar-09
                       Jul-05


                                Sep-05


                                                  Jan-06


                                                                             Jul-06


                                                                                      Sep-06


                                                                                                        Jan-07


                                                                                                                                         Jul-07


                                                                                                                                                     Sep-07


                                                                                                                                                                       Jan-08


                                                                                                                                                                                                  Jul-08


                                                                                                                                                                                                           Sep-08


                                                                                                                                                                                                                             Jan-09
                                                                                                                          Total                   Average


Figure 5. Financings, Last 12 Months
Source. Company reports

 Cumulative total nears $6.8 billion: Overall, on a cumulative basis, W eb 2.0 financings have totalled nearly $6.8 billion,
 with the majority of the financing coming in late 2007 and the first three quarters of 2008 (Figure 6). Financing for the first
 quarter of 2009 passed that raised in the fourth quarter of 2008 – reversing the downtrend since the second quarter last
 year. However, for the period ended Q1/CY09, total capital raised was below the Q1/CY08 level (at $748.2 million). The
 total capital raise in Q2-to-date was $477.1 million, buoyed by the $200 million Facebook transaction, and is well below
 Q2/CY08 totals ($1.3 billion). It does not seem likely the Q2/CY09 will be better on a Y/Y basis.
Page 7


                                                                                               Web 2.0 Financing (cumulative)


               1,600.0                                                                                                                                                                               8,000.0


               1,400.0                                                                                                                            1,344.6                                            7,000.0


               1,200.0                                                                                                                                                                               6,000.0


                                                                                                                                      977.6
               1,000.0                                                                                                                                                                               5,000.0
                                                                                                                                          857.6
      (US$m)


                                                                                                                                                                                                               (US$m)
                800.0                                                                                                                                                                                4,000.0


                                                                                                                                                           579.9             573.8
                600.0                                                                                                                                                                                3,000.0
                                                                                                                                                                                      477.1

                                                                                                                                378.6
                400.0                                                                                                                                               354.1                            2,000.0


                                                                                                               178.7174.8162.4
                200.0                                                                                                                                                                                1,000.0
                                                                                                126.4145.6111.5
                                         88.3
                                                  47.5 33.5           61.5
                         38.8 24.7                          22.2 43.3
                   0.0                                                                                                                                                                               0.0
                         Qtr1 Qtr2 Qtr3 Qtr4 Qtr1 Qtr2 Qtr3 Qtr4 Qtr1 Qtr2 Qtr3 Qtr4 Qtr1 Qtr2 Qtr3 Qtr4 Qtr1 Qtr2 Qtr3 Qtr4 Qtr1 Qtr2
                                    2004                                   2005                                         2006   2007                     2008                       2009


Figure 6. Financing, Cumulative
Source. Company reports

 U.S. remains dominant: U.S. companies continue to dominate capital market activity – with 70.0% of financings/M&A
 involving U.S. companies (based on dollars) (Figure 7). Based on number of transactions, the U.S. leads with 73.6% of
 deals, while Canada and UK each took 4.8% share of the total number of financings (Figure 8).

                                       Fi nancin g/M &A by Country - LTM ($)                                                                  Financing/M&A by Country - LTM (#)
                                                                   China                                                                            UK                  Canada
                                                                   14.6%                                                                                                           Israel
                                                                                                                                                   4.8%                  4.8%      3.1%
                                                                               Russia                                                                                                       France
                                                                                3.4%                                                                                                         3.1%
                                                                                        UK
                                                                                        2.3%     Fr ance
                                                                                                  1.9%


                                                                                                 Canada                                                                                               ROW
                                                                                                  1.7%                                                                                                10.6%

                                                                                                      Israe l
                                                                                                      1 .6%


                                                                                                                ROW
                                                                                                                4.5 %


                                         USA                                                                                               USA
                                        70.0%
                                                                                                                                          73.6%


Figures 7 & 8. Financing/M&A, by Country (LTM, $, #)
Source. Company reports
Page 8


 Larger volume of early-stage funding (by count): Almost half of financings in the last 12 months are for early-stage
 companies (Angel/Seed or Series A) (Figure 9). Series B rounds are 29.3% of the total, with later-stage (Series D, E and
 PIPE) deals accounting for just 7.5%.


                                                             Financing by Type - LTM


                                                                                       Series C
                                                                                        14.7%

                                                  Series B
                                                   29.3%


                                                                                                           Series D
                                                                                                            4.5%


                                                                                                              Series E
                                                                                                               1.1%


                                                                                                              Angel/Seed
                                                                                                                11.3%


                                                                                                     Debt financing
                                       Series A                                                          3.0%
                                        34.2%                                                     PIPE
                                                                                                  1.9%


Figure 9 Financing, by Type (LTM, #)
Source. Company reports

 Equity financings smaller over last 12 months: In the last 12 months, the average size of Series A, C, and D rounds
 has all been lower than the overall average (Figure 10).
Page 9


                                                                 Average financing round size

             40.0


                                                                                                                                36.0

             35.0

                                     32.0


             30.0


                                            26.3
                                                                                                                  25.1
             25.0

                                                                                                                         21.6
    (US$m)


             20.0
                                                                                                           18.3


             15.0

                                                                                          11.4 11.4
                                                                                                                                       10.8 10.8

             10.0
                                                     7.9
                                                           6.5                6.9
                                                                        5.4
              5.0
                    3.3
                          2.6


              0.0
                    Angel/Seed      Debt financing    PIPE              Series A           Series B        Series C      Series D      Series E

                                                                      LTM Average Size   Overall Average


Figure 10. Average Size per Round
Source. Company reports
Page 10


C A P I T A L M A R K E T S A C T I V I T Y (P R I C E P E R F O R M A N C E )
 Price Performance: Our W eb 2.0 index (market-cap weighted) underperformed the NASDAQ composite index from mid-
 2008 until recently when it has moved sharply higher than the NASDAQ index (Figure 11).


                                       Web 2.0 Index Price Performance
    103.63


     93.63


     83.63


     73.63


     63.63


     53.63


     43.63


                                                Index: Web 2.0 X (Market Cap Weights)   ^COMP - Share Pricing


Figure 11. Web 2.0 Price Performance
Source. Capital IQ

 GameOn Co. Ltd. leads; eolith Co. Ltd. falls: Most of the companies in our universe had positive stock price
 performances over the past week (for stocks with prices greater than $1) (Figure 12), with 29 companies showing positive
 returns on the week. GameOn Co. Ltd (3812-TSE) led the group with a 28.2% return, while eolith Co. Ltd. (A041060-
 KOSE) had the worst return, dropping 13.7% in the week.
Page 11


                                                                                 1 Week P rice P erformance
                           G ameOn Co Ltd.                                                                                                                             28.2%
          Northgate Technologies Limited                                                                                                                             27.2%
                    Changy ou.com Limited                                                                                                                    23.3%
                               S ohu.com Inc.                                                                                                             22.1%
                       A ctoz S of t Co., Ltd.                                                                                                         20.9%
                        A Q Interactiv e, Inc.                                                                                                     19.4%
                                   CDC Corp.                                                                                                      18.9%
            S K Communications Co., Ltd.                                                                                                       17.6%
                    Perfect World Co., Ltd.                                                                                                  16.6%
                           Open Tex t Corp.                                                                                          13.2%
                              V alueClick Inc.                                                                                     12.4%
       Gamania Digital Entertainment Co.,                                                                                       11.0%
    S handa Interactive Entertainment Ltd.                                                                                   9.6%
                     Tencent Holdings Ltd.                                                                                  9.4%
                          Neteas e.com Inc.                                                                                 9.3%
                      IA C/InterA ctiveCorp.                                                                         7.1%
                             Quepas a Corp.                                                                       6.3%
                                     G ree, Inc.                                                                  6.2%
                          United Online Inc.                                                                      6.1%
                              S hutterf ly , Inc.                                                                5.9%
            Modern Times G roup Mtg A B                                                                         5.4%
                              G igaMedia Ltd.                                                                4.0%
                 Openw ave S y s tems Inc.                                                                  3.6%
                                      XING A G                                                             3.3%
                                 The9 Limited                                                              3.3%
                        TheS treet.com, Inc.                                                               3.2%
                               Ngi G roup Inc.                                                          2.1%
                            LookS mart, Ltd.                                                           1.6%
                                  DA DA S pA                                                        0.3%
                  Lingo Media Corporation                                                          0.0%
             Chines e Gamer International                                                  -0.4%
             NEOWIZ Games Corporation                                                     -0.5%
                 NetDragon WebS of t, Inc.                                                -0.6%
                                 Webz en Inc.                                            -0.7%
                                      Mix i, Inc.                                    -2.6%
                              Y nk K orea Inc.                                       -2.7%
             Giant Interactive G roup, Inc.                                      -4.1%
                             HanbitS of t, Inc.                                  -4.2%
                       Y edangOnline Corp.                                   -5.6%
         Frogs ter Interactiv e Pictures A G                               -6.3%
                           K ings of t Co. Ltd.                           -6.6%
                            G ravity Co., Ltd                             -6.8%
             PhotoChannel Netw orks Inc.                          -9.9%
                              Cy berplex Inc.                   -10.3%
                              Tree.Com, Inc.                -12.0%
                  B ey ond Commerc e, Inc.                 -12.2%
                                Eolith Co. Ltd.        -13.7%
                                              -20.0%    -15.0%      -10.0%        -5.0%        0.0%         5.0%       10.0%         15.0%       20.0%      25.0%      30.0%     35.0%


Figure 12. 1-Week Price Performance
Source. Capital IQ
Social networks lead activity as Digital Sky invests in Facebook

Mais conteúdo relacionado

Semelhante a Social networks lead activity as Digital Sky invests in Facebook

09-03-31 Web 2.0 Weekly
09-03-31 Web 2.0 Weekly09-03-31 Web 2.0 Weekly
09-03-31 Web 2.0 WeeklyDavid Shore
 
09 10 27 Web 2.0 Weekly
09 10 27 Web 2.0 Weekly09 10 27 Web 2.0 Weekly
09 10 27 Web 2.0 WeeklyDavid Shore
 
09 08 18 Web 2.0 Weekly
09 08 18 Web 2.0 Weekly09 08 18 Web 2.0 Weekly
09 08 18 Web 2.0 WeeklyDavid Shore
 
Web 2.0 Weekly - 09-05-12
Web 2.0 Weekly - 09-05-12Web 2.0 Weekly - 09-05-12
Web 2.0 Weekly - 09-05-12David Shore
 
09 03 10 Web 2.0 Weekly
09 03 10 Web 2.0 Weekly09 03 10 Web 2.0 Weekly
09 03 10 Web 2.0 WeeklyDavid Shore
 
09 07 14 Web 2.0 Weekly
09 07 14 Web 2.0 Weekly09 07 14 Web 2.0 Weekly
09 07 14 Web 2.0 WeeklyDavid Shore
 
09 08 25 Web 2.0 Weekly
09 08 25 Web 2.0 Weekly09 08 25 Web 2.0 Weekly
09 08 25 Web 2.0 WeeklyDavid Shore
 
09 02 03 Web 2.0 Weekly
09 02 03 Web 2.0 Weekly09 02 03 Web 2.0 Weekly
09 02 03 Web 2.0 WeeklyDavid Shore
 
09 05 19 Web 2.0 Weekly
09 05 19 Web 2.0 Weekly09 05 19 Web 2.0 Weekly
09 05 19 Web 2.0 WeeklyDavid Shore
 
ES el. komercijos statistiniai duomenys, 2011 m.
ES el. komercijos statistiniai duomenys, 2011 m.ES el. komercijos statistiniai duomenys, 2011 m.
ES el. komercijos statistiniai duomenys, 2011 m.Saulius Dackys
 
09 11 17 Web 2.0 Weekly
09 11 17 Web 2.0 Weekly09 11 17 Web 2.0 Weekly
09 11 17 Web 2.0 WeeklyDavid Shore
 
09-04-28 Web 2.0 Weekly
09-04-28 Web 2.0 Weekly09-04-28 Web 2.0 Weekly
09-04-28 Web 2.0 WeeklyDavid Shore
 
09 08 11 Web 2.0 Weekly
09 08 11 Web 2.0 Weekly09 08 11 Web 2.0 Weekly
09 08 11 Web 2.0 WeeklyDavid Shore
 
09 12 08 Web 2.0 Weekly
09 12 08 Web 2.0 Weekly09 12 08 Web 2.0 Weekly
09 12 08 Web 2.0 WeeklyDavid Shore
 
09 07 07 Web 2.0 Weekly
09 07 07 Web 2.0 Weekly09 07 07 Web 2.0 Weekly
09 07 07 Web 2.0 WeeklyDavid Shore
 
Global SNCF Mobility Index Presentation at SPREAD
Global SNCF Mobility Index Presentation at SPREAD Global SNCF Mobility Index Presentation at SPREAD
Global SNCF Mobility Index Presentation at SPREAD André Schneider
 
Quepasa Corporation (NYSE Amex: QPSA) Q1 2012 Financial Results
Quepasa Corporation (NYSE Amex: QPSA) Q1 2012 Financial ResultsQuepasa Corporation (NYSE Amex: QPSA) Q1 2012 Financial Results
Quepasa Corporation (NYSE Amex: QPSA) Q1 2012 Financial ResultsMeetMe, Inc
 
Web 2.0 Weekly - 09-05-26
Web 2.0 Weekly - 09-05-26Web 2.0 Weekly - 09-05-26
Web 2.0 Weekly - 09-05-26David Shore
 
Accomplishments 2008
Accomplishments 2008Accomplishments 2008
Accomplishments 2008danielkhom
 
Stryker 2003_Stryker_AR
Stryker 2003_Stryker_ARStryker 2003_Stryker_AR
Stryker 2003_Stryker_ARfinance34
 

Semelhante a Social networks lead activity as Digital Sky invests in Facebook (20)

09-03-31 Web 2.0 Weekly
09-03-31 Web 2.0 Weekly09-03-31 Web 2.0 Weekly
09-03-31 Web 2.0 Weekly
 
09 10 27 Web 2.0 Weekly
09 10 27 Web 2.0 Weekly09 10 27 Web 2.0 Weekly
09 10 27 Web 2.0 Weekly
 
09 08 18 Web 2.0 Weekly
09 08 18 Web 2.0 Weekly09 08 18 Web 2.0 Weekly
09 08 18 Web 2.0 Weekly
 
Web 2.0 Weekly - 09-05-12
Web 2.0 Weekly - 09-05-12Web 2.0 Weekly - 09-05-12
Web 2.0 Weekly - 09-05-12
 
09 03 10 Web 2.0 Weekly
09 03 10 Web 2.0 Weekly09 03 10 Web 2.0 Weekly
09 03 10 Web 2.0 Weekly
 
09 07 14 Web 2.0 Weekly
09 07 14 Web 2.0 Weekly09 07 14 Web 2.0 Weekly
09 07 14 Web 2.0 Weekly
 
09 08 25 Web 2.0 Weekly
09 08 25 Web 2.0 Weekly09 08 25 Web 2.0 Weekly
09 08 25 Web 2.0 Weekly
 
09 02 03 Web 2.0 Weekly
09 02 03 Web 2.0 Weekly09 02 03 Web 2.0 Weekly
09 02 03 Web 2.0 Weekly
 
09 05 19 Web 2.0 Weekly
09 05 19 Web 2.0 Weekly09 05 19 Web 2.0 Weekly
09 05 19 Web 2.0 Weekly
 
ES el. komercijos statistiniai duomenys, 2011 m.
ES el. komercijos statistiniai duomenys, 2011 m.ES el. komercijos statistiniai duomenys, 2011 m.
ES el. komercijos statistiniai duomenys, 2011 m.
 
09 11 17 Web 2.0 Weekly
09 11 17 Web 2.0 Weekly09 11 17 Web 2.0 Weekly
09 11 17 Web 2.0 Weekly
 
09-04-28 Web 2.0 Weekly
09-04-28 Web 2.0 Weekly09-04-28 Web 2.0 Weekly
09-04-28 Web 2.0 Weekly
 
09 08 11 Web 2.0 Weekly
09 08 11 Web 2.0 Weekly09 08 11 Web 2.0 Weekly
09 08 11 Web 2.0 Weekly
 
09 12 08 Web 2.0 Weekly
09 12 08 Web 2.0 Weekly09 12 08 Web 2.0 Weekly
09 12 08 Web 2.0 Weekly
 
09 07 07 Web 2.0 Weekly
09 07 07 Web 2.0 Weekly09 07 07 Web 2.0 Weekly
09 07 07 Web 2.0 Weekly
 
Global SNCF Mobility Index Presentation at SPREAD
Global SNCF Mobility Index Presentation at SPREAD Global SNCF Mobility Index Presentation at SPREAD
Global SNCF Mobility Index Presentation at SPREAD
 
Quepasa Corporation (NYSE Amex: QPSA) Q1 2012 Financial Results
Quepasa Corporation (NYSE Amex: QPSA) Q1 2012 Financial ResultsQuepasa Corporation (NYSE Amex: QPSA) Q1 2012 Financial Results
Quepasa Corporation (NYSE Amex: QPSA) Q1 2012 Financial Results
 
Web 2.0 Weekly - 09-05-26
Web 2.0 Weekly - 09-05-26Web 2.0 Weekly - 09-05-26
Web 2.0 Weekly - 09-05-26
 
Accomplishments 2008
Accomplishments 2008Accomplishments 2008
Accomplishments 2008
 
Stryker 2003_Stryker_AR
Stryker 2003_Stryker_ARStryker 2003_Stryker_AR
Stryker 2003_Stryker_AR
 

Mais de David Shore

Web 2.0 Weekly - Aug. 10, 2010: "Consolidation by Google"
Web 2.0 Weekly -  Aug. 10, 2010: "Consolidation by Google"Web 2.0 Weekly -  Aug. 10, 2010: "Consolidation by Google"
Web 2.0 Weekly - Aug. 10, 2010: "Consolidation by Google"David Shore
 
Web 2.0 Weekly - Aug. 4, 2010: "Playdom is going to Disney World"
Web 2.0 Weekly - Aug. 4, 2010: "Playdom is going to Disney World"Web 2.0 Weekly - Aug. 4, 2010: "Playdom is going to Disney World"
Web 2.0 Weekly - Aug. 4, 2010: "Playdom is going to Disney World"David Shore
 
Web 2.0 Weekly - July 27, 2010: "July Financings - Approaching High for 2010"
Web 2.0 Weekly - July 27, 2010: "July Financings - Approaching High for 2010"Web 2.0 Weekly - July 27, 2010: "July Financings - Approaching High for 2010"
Web 2.0 Weekly - July 27, 2010: "July Financings - Approaching High for 2010"David Shore
 
Web 2.0 Weekly - July 20, 2010: "DST Cashing Up"
Web 2.0 Weekly - July 20, 2010: "DST Cashing Up"Web 2.0 Weekly - July 20, 2010: "DST Cashing Up"
Web 2.0 Weekly - July 20, 2010: "DST Cashing Up"David Shore
 
Web 2.0 Weekly - July 13, 2010
Web 2.0 Weekly - July 13, 2010Web 2.0 Weekly - July 13, 2010
Web 2.0 Weekly - July 13, 2010David Shore
 
10 07-08 web 2.0 weekly
10 07-08 web 2.0 weekly10 07-08 web 2.0 weekly
10 07-08 web 2.0 weeklyDavid Shore
 
10 06-29 web 2.0 weekly
10 06-29 web 2.0 weekly10 06-29 web 2.0 weekly
10 06-29 web 2.0 weeklyDavid Shore
 
Web 2.0 Weekly - June 22, 2010: "AOL Sells Bebo for Massive Loss"
Web 2.0 Weekly - June 22, 2010: "AOL Sells Bebo for Massive Loss"Web 2.0 Weekly - June 22, 2010: "AOL Sells Bebo for Massive Loss"
Web 2.0 Weekly - June 22, 2010: "AOL Sells Bebo for Massive Loss"David Shore
 
10 06-08 web 2.0 weekly
10 06-08 web 2.0 weekly10 06-08 web 2.0 weekly
10 06-08 web 2.0 weeklyDavid Shore
 
Web 2.0 Weekly - May 26, 2010: "Market Declines Impact Web 2.0 Universe Valua...
Web 2.0 Weekly - May 26, 2010: "Market Declines Impact Web 2.0 Universe Valua...Web 2.0 Weekly - May 26, 2010: "Market Declines Impact Web 2.0 Universe Valua...
Web 2.0 Weekly - May 26, 2010: "Market Declines Impact Web 2.0 Universe Valua...David Shore
 
10 05-18 web 2.0 weekly
10 05-18 web 2.0 weekly10 05-18 web 2.0 weekly
10 05-18 web 2.0 weeklyDavid Shore
 
Web 2.0 Weekly - May 11, 2010
Web 2.0 Weekly - May 11, 2010Web 2.0 Weekly - May 11, 2010
Web 2.0 Weekly - May 11, 2010David Shore
 
10 04-27 web 2.0 weekly
10 04-27 web 2.0 weekly10 04-27 web 2.0 weekly
10 04-27 web 2.0 weeklyDavid Shore
 
Web 2.0 Weekly - Apr. 20, 2010
Web 2.0 Weekly - Apr. 20, 2010Web 2.0 Weekly - Apr. 20, 2010
Web 2.0 Weekly - Apr. 20, 2010David Shore
 
10 01 05 Web 2.0 Weekly Special Edition
10 01 05 Web 2.0 Weekly   Special Edition10 01 05 Web 2.0 Weekly   Special Edition
10 01 05 Web 2.0 Weekly Special EditionDavid Shore
 
09 11 24 Web 2.0 Weekly
09 11 24 Web 2.0 Weekly09 11 24 Web 2.0 Weekly
09 11 24 Web 2.0 WeeklyDavid Shore
 
09 11 03 Web 2.0 Weekly
09 11 03 Web 2.0 Weekly09 11 03 Web 2.0 Weekly
09 11 03 Web 2.0 WeeklyDavid Shore
 
09 11 10 Web 2.0 Weekly
09 11 10 Web 2.0 Weekly09 11 10 Web 2.0 Weekly
09 11 10 Web 2.0 WeeklyDavid Shore
 
09 09 22 Web 2.0 Weekly
09 09 22 Web 2.0 Weekly09 09 22 Web 2.0 Weekly
09 09 22 Web 2.0 WeeklyDavid Shore
 
09 06 16 Web 2.0 Weekly
09 06 16 Web 2.0 Weekly09 06 16 Web 2.0 Weekly
09 06 16 Web 2.0 WeeklyDavid Shore
 

Mais de David Shore (20)

Web 2.0 Weekly - Aug. 10, 2010: "Consolidation by Google"
Web 2.0 Weekly -  Aug. 10, 2010: "Consolidation by Google"Web 2.0 Weekly -  Aug. 10, 2010: "Consolidation by Google"
Web 2.0 Weekly - Aug. 10, 2010: "Consolidation by Google"
 
Web 2.0 Weekly - Aug. 4, 2010: "Playdom is going to Disney World"
Web 2.0 Weekly - Aug. 4, 2010: "Playdom is going to Disney World"Web 2.0 Weekly - Aug. 4, 2010: "Playdom is going to Disney World"
Web 2.0 Weekly - Aug. 4, 2010: "Playdom is going to Disney World"
 
Web 2.0 Weekly - July 27, 2010: "July Financings - Approaching High for 2010"
Web 2.0 Weekly - July 27, 2010: "July Financings - Approaching High for 2010"Web 2.0 Weekly - July 27, 2010: "July Financings - Approaching High for 2010"
Web 2.0 Weekly - July 27, 2010: "July Financings - Approaching High for 2010"
 
Web 2.0 Weekly - July 20, 2010: "DST Cashing Up"
Web 2.0 Weekly - July 20, 2010: "DST Cashing Up"Web 2.0 Weekly - July 20, 2010: "DST Cashing Up"
Web 2.0 Weekly - July 20, 2010: "DST Cashing Up"
 
Web 2.0 Weekly - July 13, 2010
Web 2.0 Weekly - July 13, 2010Web 2.0 Weekly - July 13, 2010
Web 2.0 Weekly - July 13, 2010
 
10 07-08 web 2.0 weekly
10 07-08 web 2.0 weekly10 07-08 web 2.0 weekly
10 07-08 web 2.0 weekly
 
10 06-29 web 2.0 weekly
10 06-29 web 2.0 weekly10 06-29 web 2.0 weekly
10 06-29 web 2.0 weekly
 
Web 2.0 Weekly - June 22, 2010: "AOL Sells Bebo for Massive Loss"
Web 2.0 Weekly - June 22, 2010: "AOL Sells Bebo for Massive Loss"Web 2.0 Weekly - June 22, 2010: "AOL Sells Bebo for Massive Loss"
Web 2.0 Weekly - June 22, 2010: "AOL Sells Bebo for Massive Loss"
 
10 06-08 web 2.0 weekly
10 06-08 web 2.0 weekly10 06-08 web 2.0 weekly
10 06-08 web 2.0 weekly
 
Web 2.0 Weekly - May 26, 2010: "Market Declines Impact Web 2.0 Universe Valua...
Web 2.0 Weekly - May 26, 2010: "Market Declines Impact Web 2.0 Universe Valua...Web 2.0 Weekly - May 26, 2010: "Market Declines Impact Web 2.0 Universe Valua...
Web 2.0 Weekly - May 26, 2010: "Market Declines Impact Web 2.0 Universe Valua...
 
10 05-18 web 2.0 weekly
10 05-18 web 2.0 weekly10 05-18 web 2.0 weekly
10 05-18 web 2.0 weekly
 
Web 2.0 Weekly - May 11, 2010
Web 2.0 Weekly - May 11, 2010Web 2.0 Weekly - May 11, 2010
Web 2.0 Weekly - May 11, 2010
 
10 04-27 web 2.0 weekly
10 04-27 web 2.0 weekly10 04-27 web 2.0 weekly
10 04-27 web 2.0 weekly
 
Web 2.0 Weekly - Apr. 20, 2010
Web 2.0 Weekly - Apr. 20, 2010Web 2.0 Weekly - Apr. 20, 2010
Web 2.0 Weekly - Apr. 20, 2010
 
10 01 05 Web 2.0 Weekly Special Edition
10 01 05 Web 2.0 Weekly   Special Edition10 01 05 Web 2.0 Weekly   Special Edition
10 01 05 Web 2.0 Weekly Special Edition
 
09 11 24 Web 2.0 Weekly
09 11 24 Web 2.0 Weekly09 11 24 Web 2.0 Weekly
09 11 24 Web 2.0 Weekly
 
09 11 03 Web 2.0 Weekly
09 11 03 Web 2.0 Weekly09 11 03 Web 2.0 Weekly
09 11 03 Web 2.0 Weekly
 
09 11 10 Web 2.0 Weekly
09 11 10 Web 2.0 Weekly09 11 10 Web 2.0 Weekly
09 11 10 Web 2.0 Weekly
 
09 09 22 Web 2.0 Weekly
09 09 22 Web 2.0 Weekly09 09 22 Web 2.0 Weekly
09 09 22 Web 2.0 Weekly
 
09 06 16 Web 2.0 Weekly
09 06 16 Web 2.0 Weekly09 06 16 Web 2.0 Weekly
09 06 16 Web 2.0 Weekly
 

Último

The Economic History of the U.S. Lecture 30.pdf
The Economic History of the U.S. Lecture 30.pdfThe Economic History of the U.S. Lecture 30.pdf
The Economic History of the U.S. Lecture 30.pdfGale Pooley
 
The Economic History of the U.S. Lecture 17.pdf
The Economic History of the U.S. Lecture 17.pdfThe Economic History of the U.S. Lecture 17.pdf
The Economic History of the U.S. Lecture 17.pdfGale Pooley
 
Basic concepts related to Financial modelling
Basic concepts related to Financial modellingBasic concepts related to Financial modelling
Basic concepts related to Financial modellingbaijup5
 
The Economic History of the U.S. Lecture 20.pdf
The Economic History of the U.S. Lecture 20.pdfThe Economic History of the U.S. Lecture 20.pdf
The Economic History of the U.S. Lecture 20.pdfGale Pooley
 
Booking open Available Pune Call Girls Wadgaon Sheri 6297143586 Call Hot Ind...
Booking open Available Pune Call Girls Wadgaon Sheri  6297143586 Call Hot Ind...Booking open Available Pune Call Girls Wadgaon Sheri  6297143586 Call Hot Ind...
Booking open Available Pune Call Girls Wadgaon Sheri 6297143586 Call Hot Ind...Call Girls in Nagpur High Profile
 
Solution Manual for Financial Accounting, 11th Edition by Robert Libby, Patri...
Solution Manual for Financial Accounting, 11th Edition by Robert Libby, Patri...Solution Manual for Financial Accounting, 11th Edition by Robert Libby, Patri...
Solution Manual for Financial Accounting, 11th Edition by Robert Libby, Patri...ssifa0344
 
The Economic History of the U.S. Lecture 25.pdf
The Economic History of the U.S. Lecture 25.pdfThe Economic History of the U.S. Lecture 25.pdf
The Economic History of the U.S. Lecture 25.pdfGale Pooley
 
High Class Call Girls Nashik Maya 7001305949 Independent Escort Service Nashik
High Class Call Girls Nashik Maya 7001305949 Independent Escort Service NashikHigh Class Call Girls Nashik Maya 7001305949 Independent Escort Service Nashik
High Class Call Girls Nashik Maya 7001305949 Independent Escort Service NashikCall Girls in Nagpur High Profile
 
Call Girls Service Nagpur Maya Call 7001035870 Meet With Nagpur Escorts
Call Girls Service Nagpur Maya Call 7001035870 Meet With Nagpur EscortsCall Girls Service Nagpur Maya Call 7001035870 Meet With Nagpur Escorts
Call Girls Service Nagpur Maya Call 7001035870 Meet With Nagpur Escortsranjana rawat
 
Stock Market Brief Deck (Under Pressure).pdf
Stock Market Brief Deck (Under Pressure).pdfStock Market Brief Deck (Under Pressure).pdf
Stock Market Brief Deck (Under Pressure).pdfMichael Silva
 
Pooja 9892124323 : Call Girl in Juhu Escorts Service Free Home Delivery
Pooja 9892124323 : Call Girl in Juhu Escorts Service Free Home DeliveryPooja 9892124323 : Call Girl in Juhu Escorts Service Free Home Delivery
Pooja 9892124323 : Call Girl in Juhu Escorts Service Free Home DeliveryPooja Nehwal
 
The Economic History of the U.S. Lecture 19.pdf
The Economic History of the U.S. Lecture 19.pdfThe Economic History of the U.S. Lecture 19.pdf
The Economic History of the U.S. Lecture 19.pdfGale Pooley
 
WhatsApp 📞 Call : 9892124323 ✅Call Girls In Chembur ( Mumbai ) secure service
WhatsApp 📞 Call : 9892124323  ✅Call Girls In Chembur ( Mumbai ) secure serviceWhatsApp 📞 Call : 9892124323  ✅Call Girls In Chembur ( Mumbai ) secure service
WhatsApp 📞 Call : 9892124323 ✅Call Girls In Chembur ( Mumbai ) secure servicePooja Nehwal
 
Gurley shaw Theory of Monetary Economics.
Gurley shaw Theory of Monetary Economics.Gurley shaw Theory of Monetary Economics.
Gurley shaw Theory of Monetary Economics.Vinodha Devi
 
02_Fabio Colombo_Accenture_MeetupDora&Cybersecurity.pptx
02_Fabio Colombo_Accenture_MeetupDora&Cybersecurity.pptx02_Fabio Colombo_Accenture_MeetupDora&Cybersecurity.pptx
02_Fabio Colombo_Accenture_MeetupDora&Cybersecurity.pptxFinTech Belgium
 

Último (20)

VIP Independent Call Girls in Andheri 🌹 9920725232 ( Call Me ) Mumbai Escorts...
VIP Independent Call Girls in Andheri 🌹 9920725232 ( Call Me ) Mumbai Escorts...VIP Independent Call Girls in Andheri 🌹 9920725232 ( Call Me ) Mumbai Escorts...
VIP Independent Call Girls in Andheri 🌹 9920725232 ( Call Me ) Mumbai Escorts...
 
The Economic History of the U.S. Lecture 30.pdf
The Economic History of the U.S. Lecture 30.pdfThe Economic History of the U.S. Lecture 30.pdf
The Economic History of the U.S. Lecture 30.pdf
 
Veritas Interim Report 1 January–31 March 2024
Veritas Interim Report 1 January–31 March 2024Veritas Interim Report 1 January–31 March 2024
Veritas Interim Report 1 January–31 March 2024
 
The Economic History of the U.S. Lecture 17.pdf
The Economic History of the U.S. Lecture 17.pdfThe Economic History of the U.S. Lecture 17.pdf
The Economic History of the U.S. Lecture 17.pdf
 
Basic concepts related to Financial modelling
Basic concepts related to Financial modellingBasic concepts related to Financial modelling
Basic concepts related to Financial modelling
 
The Economic History of the U.S. Lecture 20.pdf
The Economic History of the U.S. Lecture 20.pdfThe Economic History of the U.S. Lecture 20.pdf
The Economic History of the U.S. Lecture 20.pdf
 
(INDIRA) Call Girl Mumbai Call Now 8250077686 Mumbai Escorts 24x7
(INDIRA) Call Girl Mumbai Call Now 8250077686 Mumbai Escorts 24x7(INDIRA) Call Girl Mumbai Call Now 8250077686 Mumbai Escorts 24x7
(INDIRA) Call Girl Mumbai Call Now 8250077686 Mumbai Escorts 24x7
 
Booking open Available Pune Call Girls Wadgaon Sheri 6297143586 Call Hot Ind...
Booking open Available Pune Call Girls Wadgaon Sheri  6297143586 Call Hot Ind...Booking open Available Pune Call Girls Wadgaon Sheri  6297143586 Call Hot Ind...
Booking open Available Pune Call Girls Wadgaon Sheri 6297143586 Call Hot Ind...
 
Solution Manual for Financial Accounting, 11th Edition by Robert Libby, Patri...
Solution Manual for Financial Accounting, 11th Edition by Robert Libby, Patri...Solution Manual for Financial Accounting, 11th Edition by Robert Libby, Patri...
Solution Manual for Financial Accounting, 11th Edition by Robert Libby, Patri...
 
The Economic History of the U.S. Lecture 25.pdf
The Economic History of the U.S. Lecture 25.pdfThe Economic History of the U.S. Lecture 25.pdf
The Economic History of the U.S. Lecture 25.pdf
 
High Class Call Girls Nashik Maya 7001305949 Independent Escort Service Nashik
High Class Call Girls Nashik Maya 7001305949 Independent Escort Service NashikHigh Class Call Girls Nashik Maya 7001305949 Independent Escort Service Nashik
High Class Call Girls Nashik Maya 7001305949 Independent Escort Service Nashik
 
Call Girls Service Nagpur Maya Call 7001035870 Meet With Nagpur Escorts
Call Girls Service Nagpur Maya Call 7001035870 Meet With Nagpur EscortsCall Girls Service Nagpur Maya Call 7001035870 Meet With Nagpur Escorts
Call Girls Service Nagpur Maya Call 7001035870 Meet With Nagpur Escorts
 
(Vedika) Low Rate Call Girls in Pune Call Now 8250077686 Pune Escorts 24x7
(Vedika) Low Rate Call Girls in Pune Call Now 8250077686 Pune Escorts 24x7(Vedika) Low Rate Call Girls in Pune Call Now 8250077686 Pune Escorts 24x7
(Vedika) Low Rate Call Girls in Pune Call Now 8250077686 Pune Escorts 24x7
 
Stock Market Brief Deck (Under Pressure).pdf
Stock Market Brief Deck (Under Pressure).pdfStock Market Brief Deck (Under Pressure).pdf
Stock Market Brief Deck (Under Pressure).pdf
 
Pooja 9892124323 : Call Girl in Juhu Escorts Service Free Home Delivery
Pooja 9892124323 : Call Girl in Juhu Escorts Service Free Home DeliveryPooja 9892124323 : Call Girl in Juhu Escorts Service Free Home Delivery
Pooja 9892124323 : Call Girl in Juhu Escorts Service Free Home Delivery
 
The Economic History of the U.S. Lecture 19.pdf
The Economic History of the U.S. Lecture 19.pdfThe Economic History of the U.S. Lecture 19.pdf
The Economic History of the U.S. Lecture 19.pdf
 
WhatsApp 📞 Call : 9892124323 ✅Call Girls In Chembur ( Mumbai ) secure service
WhatsApp 📞 Call : 9892124323  ✅Call Girls In Chembur ( Mumbai ) secure serviceWhatsApp 📞 Call : 9892124323  ✅Call Girls In Chembur ( Mumbai ) secure service
WhatsApp 📞 Call : 9892124323 ✅Call Girls In Chembur ( Mumbai ) secure service
 
Gurley shaw Theory of Monetary Economics.
Gurley shaw Theory of Monetary Economics.Gurley shaw Theory of Monetary Economics.
Gurley shaw Theory of Monetary Economics.
 
VIP Call Girl Service Andheri West ⚡ 9920725232 What It Takes To Be The Best ...
VIP Call Girl Service Andheri West ⚡ 9920725232 What It Takes To Be The Best ...VIP Call Girl Service Andheri West ⚡ 9920725232 What It Takes To Be The Best ...
VIP Call Girl Service Andheri West ⚡ 9920725232 What It Takes To Be The Best ...
 
02_Fabio Colombo_Accenture_MeetupDora&Cybersecurity.pptx
02_Fabio Colombo_Accenture_MeetupDora&Cybersecurity.pptx02_Fabio Colombo_Accenture_MeetupDora&Cybersecurity.pptx
02_Fabio Colombo_Accenture_MeetupDora&Cybersecurity.pptx
 

Social networks lead activity as Digital Sky invests in Facebook

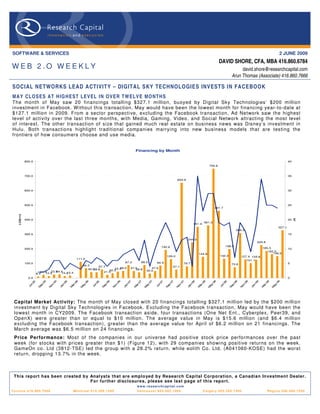
  • 1. SOFTWARE & SERVICES 2 JUNE 2009 DAVID SHORE, CFA, MBA 416.860.6784 WEB 2.O WEEKLY david.shore@researchcapital.com Arun Thomas (Associate) 416.860.7666 SOCIAL NETWORKS LEAD ACTIVITY – DIGITAL SKY TECHNOLOGIES INVESTS IN FACEBOOK MA Y CL O S E S AT H IG H E S T L E V EL I N OV E R T W EL V E MO NT H S The month of May saw 20 financings totalling $327.1 million, buoyed by Digital Sky Technologies’ $200 million investment in Facebook. W ithout this transaction, May would have been the lowest month for financing year-to-date at $127.1 million in 2009. From a sector perspective, excluding the Facebook transaction, Ad Network saw the highest level of activity over the last three months, with Media, Gaming, Video, and Social Network attracting the most level of interest. The other transaction of size that gained much real estate on business news was Disney’s investment in Hulu. Both transactions highlight traditional companies marrying into new business models that are testing the frontiers of how consumers choose and use media. Financing by Month 800.0 40 750.6 700.0 35 653.9 600.0 30 500.0 25 461.7 (U $m ) S m (#) 400.0 20 361.3 351.4 327.1 308.3 300.0 15 244.0 225.8 192.6 198.0 200.0 185.5 10 162.5 144.9 149.5 129.0 132.3 127.4 125.6 111.0 101.1 100.0 87.3 88.5 84.9 79.7 5 66.3 73.6 57.7 57.1 40.5 48.0 43.4 47.5 47.6 38.8 32.3 38.8 21.4 24.4 23.9 21.5 30.0 9.4 12.5 15.4 13.2 0.0 0 6 7 8 9 5 5 6 6 6 7 7 7 8 8 8 9 06 07 08 09 5 6 7 8 -0 -0 -0 -0 -0 -0 -0 -0 -0 -0 -0 -0 -0 -0 -0 -0 l-0 l-0 l-0 l-0 n- n- n- n- ov ay ov ay ov ay ov ay ep ep ep ep ar ar ar ar Ju Ju Ju Ju Ja Ja Ja Ja M M M M M M M M N N N N S S S S Capital Market Activity: The month of May closed with 20 financings totalling $327.1 million led by the $200 million investment by Digital Sky Technologies in Facebook. Excluding the Facebook transaction, May would have been the lowest month in CY2009. The Facebook transaction aside, four transactions (One Net Ent., Cyberplex, Peer39, and OpenX) were greater than or equal to $10 million. The average value in May is $15.6 million (and $6.4 million excluding the Facebook transaction), greater than the average value for April of $6.2 million on 21 financings. The March average was $6.5 million on 24 financings. Price Performance: Most of the companies in our universe had positive stock price performances over the past week (for stocks with prices greater than $1) (Figure 12), with 29 companies showing positive returns on the week. GameOn co. Ltd (3812-TSE) led the group with a 28.2% return, while eolith Co. Ltd. (A041060-KOSE) had the worst return, dropping 13.7% in the week. This report has been created b y Anal ysts that are emplo yed b y Research Capital Corporation, a Canadian Investment Dealer. For further disclosures, please see last page of this report. w w w . r e s e a rc h c a p i t a l . c o m T o ro n t o 4 1 6 . 8 6 0 . 7 6 0 0 Montreal 514.399.1500 Vancouver 604.662.1800 Calgary 403.265.7400 Regina 306.566.7550
  • 2. Page 2 THE WEB 2.0 UNIVERSE Ninety-three public Web 2.0 companies identified: Our W eb 2.0 universe contains 93 companies, with a combined market cap of ~$53 billion (Figure 1). The average market cap for the group is ~$577 million (but a median of only $50.9 million), with average trailing revenue of $152.1 million (median $54.3 million). The companies are also generally profitable, with a median EBITDA margin of 14.2%. On a valuation basis, the overall average is 4.9x trailing revenue (median 2.0x) and 10.0x trailing EBITDA (median 9.6x). Fourteen of the companies have more than 500 employees. C omparable C o mpany A nalys is > W eb 2.0 Trading Current U S D Market U S D LT M To tal US D L TM T otal E BITDA TE V/LT M T E V/LT M C om pan y Nam e L TM as of T icker E xc hange Cu rrency H Q P rice C ap ($m) R ev ($m) E B ITDA ($m) % R evenu e E B IT DA E mployees Acce le rize N ew Me dia, Inc. 3 /31 /200 9 AC LZ OT C B B USD U nited S ta tes 0 .35 9 .7 4.1 (4 .4) NM 3.5 x - 11 Actoz S of t C o., L td. 3 /31 /200 9 A0 527 90 K OS E KR W S outh K orea 26, 300 18 2.2 93. 7 2 0.4 21 .7% 1.6 x 7.5x NA AQ Inte ractive , Inc. 1 2/31 /200 8 38 38 TSE JPY J apan 80 ,000 .00 4 5.0 62. 4 5 .0 8 .0% 0.2 x 3.0x NA As s o cia ted Media H oldings Inc. 6 /30 /200 7 AS MH OT C P K USD U nited S ta tes 0 0 .1 0.1 (2 .3) NM 8.1 x - 3 B igstring Co rp. 3 /31 /200 9 BS GC OT C B B USD U nited S ta tes 0 .02 1 .0 0.1 (2 .0) NM 30.7 x - 4 B e tawave Corpora tion 3 /31 /200 9 B W AV OT C B B USD U nited S ta tes 0 2 .3 8.4 (1 2.6) NM - - 53 B e yo nd Commerce, In c. 3 /31 /200 9 B Y OC OT C B B USD U nited S ta tes 1 .01 4 4.8 7.1 (9 .5) NM 7.0 x - 69 B right T hings plc 9 /30 /200 8 AIM:B G T AIM GBP U nited K ingdom 0 4 .8 0.3 (1 .9) NM 17.6 x - 9 B roa dW ebAs ia Inc. 9 /30 /200 8 BW BA OT C P K USD U nited S ta tes 0 .30 2 5.3 0.0 (4 .6) NM - - 46 C DC C orp. 3 /31 /200 9 C HIN .A N as da qG S USD H ong K on g 2 18 0.4 389 .9 3 0.8 7 .9% 0.5 x 6.3x NA C ha ngyou. com Limite d 3 /31 /200 9 C Y OU N as da qG S USD C hina 35 .77 1,9 67.4 222 .5 13 5.1 60 .7% 8.0 x 1 3.2 x 628 C hina G ate wa y C orpo ra tion 9 /30 /200 8 C GW Y OT C P K USD U nited S ta tes 0 0 .0 6.7 (6 .6) -9 8.9% 0.0 x - 37 C hine s e G amer International 3 /31 /200 9 G T S M:308 3 GTSM TWD T aiwan 376 .50 98 0.3 57. 2 3 2.0 56 .0% 16.0 x 2 8.5 x NA C ornerW orld C orporation 1 /31 /200 9 C WR L OT C B B USD U nited S ta tes 0 5 .8 1.3 NM NM 5.5 x - NA C yberplex Inc. 3 /31 /200 9 T S X:C X TSX C AD C ana da 1 .57 7 7.4 74. 9 7 .7 10 .3% 1.0 x 9.5x NA DADA S pA 9 /30 /200 8 C M:D A CM EUR Ita ly 6 13 6.7 240 .4 3 8.4 16 .0% 0.8 x 4.9x 578 DXN Holdings B hd 2 /28 /200 9 DXN KLSE MY R Ma la ys ia 0 .40 2 6.2 79. 7 1 0.9 13 .7% 0.5 x 3.9x NA Dibz Inte rnational, Inc. NA DIB Z OT C P K USD U nited S ta tes 0 0 .0 NA NM NM - - NA DigitalP ost Inte ra ctive , Inc. 3 /31 /200 9 DG LP OT C B B USD U nited S ta tes 0 .02 1 .1 0.7 (2 .6) NM 3.8 x - 7 DigitalT own, In c. 2 /28 /200 9 DG T W OT C B B USD U nited S ta tes 2 5 4.2 NM (3 .0) NM - - 3 Dolphin D igital Me dia, Inc. 3 /31 /200 9 DP DM OT C B B USD U nited S ta tes 0 .53 2 7.4 0.8 (3 .7) NM 36.7 x - NA E o lith C o. L td. 1 2/31 /200 8 A0 410 60 K OS E KR W S outh K orea 725 4 2.8 14. 9 (3 .5) -2 3.6% 3.0 x - NA E xte ns ions , Inc. 3 /31 /200 9 E XT I OT C P K USD U nited S ta tes 0 .15 1 4.2 NM NM NM - - 2 F inancia l Media G roup, Inc. 2 /28 /200 9 F NG P OT C B B USD U nited S ta tes 0 0 .2 7.2 2 .4 34 .1% - - 22 F luid Mus ic Ca nada, In c. 3 /31 /200 9 T S X:F MN TSX C AD U nited S ta tes 0 .75 3 6.2 5.0 (6 .9) NM 5.2 x - NA F rogs te r Interactive P ictu re s AG 6 /30 /200 8 FRG XT R A EUR G ermany 7 2 4.8 5.7 (3 .5) -6 0.6% 4.3 x - NA G a ma nia Digital E ntertainmen t C o., L td. 3 /31 /200 9 61 80 GTSM TWD T aiwan 58 .60 27 5.6 128 .3 2 1.3 16 .6% 2.0 x 1 1.8 x NA G a me On C o L td. 3 /31 /200 9 38 12 TSE JPY J apan 1 24, 000 12 4.0 76. 1 1 8.0 23 .7% 0.8 x 3.5x NA G e oS e ntric O yj 3 /31 /200 9 G E O1 V H LS E EUR F inland 0 .05 6 3.7 6.0 (1 5.5) NM 9.9 x - 108 G ian t Intera ctive G roup, Inc. 3 /31 /200 9 GA NYS E USD C hina 8 1,7 86.7 219 .1 NM NM - - NA G iga Media Ltd. 1 2/31 /200 8 G IG M N as da qG S USD T aiwan 6 .19 33 4.4 190 .4 4 6.0 24 .2% 1.4 x 5.6x NA G ravity C o., L td 9 /30 /200 8 GR VY N as da qG M USD S outh K orea 1 3 0.6 39. 7 7 .6 19 .2% - - 636 G ree, Inc. 6 /30 /200 8 T S E : 363 2 TSE JPY J apan 5 ,630 .00 1,3 00.4 30. 4 1 0.9 36 .0% 40.1 x - NA G u ngH o O nline E ntertainment, Inc. 1 2/31 /200 8 37 65 OS E JPY J apan 2 48, 000 29 3.8 116 .3 2 0.7 17 .8% 2.3 x 1 3.1 x NA H anbitS of t, Inc. 3 /31 /200 9 A0 470 80 K OS E KR W S outh K orea 5 ,290 .00 9 4.0 56. 0 (1 5.0) -2 6.8% 1.4 x - NA IAC /InterActiveC orp. 3 /31 /200 9 IAC I N as da qG S USD U nited S ta tes 17 2,5 00.7 1 ,40 6.4 4 2.6 3 .0% 0.4 x 1 4.4 x 3 ,20 0 IAS E n ergy, Inc. 1 /31 /200 9 IAS C.A OT C B B USD C ana da 0 .23 1 6.1 0.0 (0 .8) NM - - NA is ee media Inc. 1 2/31 /200 8 IE E T S XV C AD C ana da 0 3 .8 1.4 (5 .5) NM 1.4 x - NA J umbuck E ntertainment P ty Ltd. 1 2/31 /200 8 AS X:J MB AS X AU D Aus tra lia 0 .45 1 8.0 14. 5 5 .4 37 .2% 0.9 x 2.4x 72 J umpT V Inc. 1 2/31 /200 8 T S X:J T V TSX C AD C ana da 1 8 3.7 13. 4 (8 .4) -6 2.6% 4.7 x - 237 K a boos e Inc. 3 /31 /200 9 T S X:K AB TSX C AD C ana da 0 .61 7 8.5 75. 7 9 .0 11 .9% 1.1 x 9.3x NA K ings oft Co. Ltd. 3 /31 /200 9 38 88 S E HK HKD C hina 5 73 1.5 129 .2 5 2.0 40 .3% 5.2 x 1 2.9 x 2 ,27 1 Lin go M edia Corporation 1 2/31 /200 8 T S XV : LM T S XV C AD C ana da 1 .05 1 2.4 0.9 (1 .5) NM 11.6 x - NA Live Wo rld Inc. 3 /31 /200 9 LV WD OT C P K USD U nited S ta tes 0 2 .6 11. 4 (0 .0) -0 .4% 0.1 x - NA Lo okS mart, Ltd. 3 /31 /200 9 LOOK N as da qG M USD U nited S ta tes 1 .30 2 2.2 60. 7 (3 .8) -6 .3% - - 90 Magnitu de Information S ys tems Inc. 3 /31 /200 9 MA G Y OT C B B USD U nited S ta tes 0 6 .8 0.1 (3 .1) NM - - 14 Mixi, In c. 3 /31 /200 9 21 21 TSE JPY J apan 458 ,000 .00 72 8.2 124 .7 4 4.2 35 .4% 4.9 x 1 3.8 x NA Mode rn Times G rou p Mtg AB 3 /31 /200 9 MT G B OM S EK S weden 233 2,0 68.2 1 ,81 7.2 27 8.4 15 .3% 1.5 x 9.5x 2 ,96 9 Moggle , Inc 3 /31 /200 9 MMOG OT C B B USD U nited S ta tes 2 .30 8 3.5 NM NM NM - - 3 MOK O.mobi L imited 1 2/31 /200 8 MK B AS X AU D Aus tra lia 0 4 .6 1.2 (2 .4) NM 3.0 x - NA Myriad G rou p AG 1 2/31 /200 8 MY R N SWX C HF S witzerla nd 5 .75 11 4.5 40. 0 0 .8 1 .9% 3.1 x - 405 N E OW IZ G ames C orpora tion 1 2/31 /200 8 A0 956 60 K OS E KR W S outh K orea 77, 100 60 2.0 200 .9 5 3.9 26 .8% 2.9 x 1 1.0 x NA N etD rago n W ebS oft, Inc. 3 /31 /200 9 77 7 S E HK HKD C hina 5 .42 36 9.6 87. 0 3 4.4 39 .5% 2.7 x 6.8x 2 ,42 6 N ete as e.com I nc. 3 /31 /200 9 NT E S N as da qG S USD C hina 36 4,4 06.5 470 .9 30 6.0 65 .0% - - NA N eXplo re Co rpora tion 9 /30 /200 7 N XP C OT C P K USD U nited S ta tes 0 .70 3 9.0 NM (4 .9) NM - - 19 N gi G roup Inc. 1 2/31 /200 8 24 97 TSE JPY J apan 34, 700 4 4.3 101 .7 3 1.3 30 .8% - - NA N orthgate Te chno lo gies L imited 3 /31 /200 9 59 005 7 BS E INR India 47 .05 3 5.0 119 .4 (2 8.0) -2 3.5% 0.3 x - NA Open T e xt Corp. 3 /31 /200 9 OT E X N as da qG S USD C ana da 36 1,8 77.1 782 .6 19 9.2 25 .5% 2.5 x 9.8x 3 ,40 0 Openwave S ys tems Inc. 3 /31 /200 9 OP W V N as da qG S USD U nited S ta tes 1 .86 15 4.5 197 .2 (2 .1) -1 .0% 0.3 x - 630 P e rf ect W orld C o., Ltd. 3 /31 /200 9 PW R D N as da qG S USD C hina 23 1,1 89.7 228 .3 12 4.7 54 .6% 0.1 x 0.1x NA P h otoChann el N etwork s Inc. 3 /31 /200 9 T S XV : P N T S XV C AD C ana da 1 .54 4 8.5 19. 9 0 .5 2 .3% 2.4 x - NA Qu epa s a C orp. 3 /31 /200 9 QP S A N as da qC M USD U nited S ta tes 1 1 3.0 0.1 (1 0.8) NM - - 74 OA O R B C Information S ys tems 1 2/31 /200 7 R BCI R TS USD R us s ia 1 .35 18 7.3 154 .7 2 0.2 13 .1% 0.0 x 0.3x NA S h anda In teractive E ntertainme nt L td. 1 2/31 /200 8 S N DA N as da qG S USD C hina 60 4,1 78.9 522 .6 24 0.1 46 .0% 0.4 x 0.8x NA S h utte rf ly, In c. 3 /31 /200 9 S F LY N as da qG S USD U nited S ta tes 15 .13 38 0.9 215 .2 2 8.3 13 .2% 1.5 x 1 1.1 x 514 S K C ommun ications Co., Ltd. 1 2/31 /200 8 A0 662 70 K OS E KR W S outh K orea 12, 000 40 0.2 186 .7 1 2.1 6 .5% 2.1 x 3 3.0 x NA S N AP Inte ra ctive , Inc. 3 /31 /200 9 S T VI OT C B B USD U nited S ta tes 0 .79 8 .5 3.3 0 .9 28 .0% 2.2 x 7.7x 11 S N M G lobal H oldings 9 /30 /200 8 S N MN OT C P K USD U nited S ta tes 0 0 .0 2.0 (0 .7) -3 4.8% 1.1 x - 33 S o cia l Media V e nures , In c. 1 2/31 /200 8 S MV I OT C P K USD U nited S ta tes 0 .01 0 .0 0.1 (0 .1) -6 0.5% 0.0 x - NA S o cia lwis e, Inc. 3 /31 /200 9 S C LW OT C B B USD U nited S ta tes 1 3 0.3 0.0 (4 .8) NM - - NA S o hu. com Inc. 3 /31 /200 9 S OH U N as da qG S USD C hina 66 .25 2,5 35.0 460 .0 20 0.5 43 .6% 4.7 x 1 0.8 x 3 ,19 7 S ite s earch C orpo ration 1 /31 /200 9 S T PC OT C B B USD U nited S ta tes 3 2 8.2 NM (1 .1) NM - - 15 S park N etworks , Inc. 3 /31 /200 9 LOV AME X USD U nited S ta tes 2 .29 4 7.1 54. 3 1 1.8 21 .7% 0.9 x 4.0x 183 S pectrumDN A, Inc. 3 /31 /200 9 S P XA OT C B B USD U nited S ta tes 0 1 8.0 0.1 (2 .6) NM - - 7 T encent Holdin gs L td. 3 /31 /200 9 70 0 S E HK HKD C hina 85 .60 19,9 07. 1 1 ,20 4.5 57 7.1 47 .9% 18.0 x 3 7.5 x 6 ,19 4 T he P aren t C ompan y 8/2/2008 K IDS .Q OT C P K USD U nited S ta tes 0 0 .4 112 .0 (1 3.5) -1 2.0% 0.2 x - 347 T he 9 L imited 1 2/31 /200 8 N CT Y N as da qG S USD C hina 9 .27 24 8.6 250 .1 8 4.2 33 .7% - - NA T he S treet.com, Inc. 3 /31 /200 9 TSCM N as da qG M USD U nited S ta tes 2 6 0.0 67. 0 1 .9 2 .9% - - 310 T otal S po rt Online A S 3 /31 /200 6 T OS O OT C NO NOK N orwa y 0 .03 0 .1 2.2 (1 .1) -5 0.6% 4.6 x - 16 T ree.C om, Inc. 3 /31 /200 9 TR EE N as da qG M USD U nited S ta tes 11 11 5.8 215 .6 (1 3.3) -6 .2% 0.5 x - 700 U nis erve C ommu nication s Co rp. 2 /28 /200 9 T S XV : US S T S XV C AD C ana da 0 .06 1 .2 24. 0 0 .1 0 .2% 0.2 x - NA U nited Online Inc. 3 /31 /200 9 U NT D N as da qG S USD U nited S ta tes 7 58 1.7 811 .2 17 7.3 21 .9% 1.1 x 4.9x 1 ,46 9 U OMO Media , Inc 1 /31 /200 9 U OMO OT C B B USD C ana da 0 .16 1 3.7 0.6 (0 .5) -7 8.2% 22.1 x - NA V a lueC lick Inc. 3 /31 /200 9 V C LK N as da qG S USD U nited S ta tes 11 98 0.1 591 .7 10 5.5 17 .8% 1.5 x 8.3x 1 ,18 9 V O IS , Inc. 3 /31 /200 9 V OIS OT C B B USD U nited S ta tes 0 .35 2 .9 0.0 (1 .1) NM - - 4 W ebze n Inc. 3 /31 /200 9 W ZE N N as da qG M USD S outh K orea 5 5 3.4 23. 3 (0 .4) -1 .9% - - 314 W izza rd S of twa re Corpora tion 3 /31 /200 9 W ZE AME X USD U nited S ta tes 0 .55 2 6.3 5.6 (5 .1) -9 1.5% 4.9 x - 110 W orlds .com In c. 3 /31 /200 9 W DD D OT C B B USD U nited S ta tes 0 5 .2 0.0 (0 .8) NM - - 1 W ynds torm C orporatio n NA W YND OT C B B USD U nited S ta tes 0 .51 9 .2 NA NM NM - - NA XIN G AG 3 /31 /200 9 O1B C XT R A EUR G ermany 34 25 1.6 53. 7 1 6.8 31 .2% 3.7 x 1 1.9 x 239 Y e dangOnline Co rp. 1 2/31 /200 7 A0 527 70 K OS E KR W S outh K orea 10 ,200 .00 12 9.8 55. 6 1 2.4 22 .4% 2.3 x 1 0.4 x NA Y n k K orea Inc. 1 2/31 /200 7 A0 237 70 K OS E KR W S outh K orea 7, 700 1 5.3 15. 8 (1 .2) -7 .6% 0.9 x - NA ZipLocal Inc. 3 /31 /200 9 T S XV : ZIP T S XV C AD C ana da 0 .01 0 .4 2.8 (2 .2) -7 8.3% 0.6 x - NA H igh 19,9 07. 1 1 ,817 .2 57 7.1 65 .0% 40.1 x 3 7.5 x 6 ,194 Lo w 0 .0 0.0 -28.0 -9 8.9% 0.0 x 0.1x 1 A vera ge 577.0 152 .1 32.9 6 .0% 4.9x 10.0x 671 Median 5 0.9 54. 3 0 .6 14 .2% 2.0 x 9.6x 237 Figure 1. Web 2.0 Universe Summary Source. Capital IQ
  • 3. Page 3 C A P I T A L M A R K E T S A C T I V I T Y (M & A A N D F I N A N C I N G ) Activit y peaks in May – the highest in last 12 months and YTD CY2009: The month of May closed with 20 financings totalling $327.1 million led by the $200 million investment by Digital Sky Technologies in Facebook. The Facebook transaction aside, four transactions (One Net Ent., Cyberplex, Peer39, and OpenX) were greater than or equal to $10 million. The average value in May is $15.6 million (and $6.4 million excluding the Facebook transaction), greater than the average value for April of $6.2 million on 21 financings. The March average was $6.5 million on 24 financings. For the last three months, except for four deals (Kaixin001.com, Collective Media, One Net Entertainment, and Facebook), all were below $20 million and a total of six deals were greater than or equal to $15 million. Financing Activity Last Three Months 350.0 18.0 16.0 300.0 15.6 14.0 250.0 12.0 200.0 10.0 (US$m) (US$m) 8.0 150.0 6.5 6.2 6.4 6.0 100.0 4.0 50.0 2.0 0.0 0.0 Mar-09 Apr-09 May-09 May-09 (excl FB) Total Average Figure 2. Financings, Last Three Months Source. Company reports Facebook largest deal in April: Digital Sky Technologies announced a $200 million investment in Facebook last week, the largest deal so far in the last 12 months. The Facebook transaction aside, 14 of the 20 deals in the month are equal to or greater than $5 million. For additional details, see Figures 29 and 30 (at end of note). Also note that the spin-off of StumbleUpon from E-bay on a $29 million valuation occurred in May. E-bay had bought StumbleUpon for $75 million.
  • 4. Page 4 Financing & M/A Summary - Last Three Months 250.0 200.0 150.0 May-09 (US$m) Apr-09 Mar-09 100.0 50.0 0.0 Pixazza Mixercast Collective Media Marin Software Miva EveryZing AnySource Media VoxPop Myngle Cyberplex Buzznet OpenX OLX Socialtext TubeMogul GOOM Radio Vidyo Greystripe Viximo IMShopping Tribal Nova I Love Rewards Medialets Topsy Resonate Networks Bit.ly Mo'Minis Brandtology Kaixin001.com SendMe Inc. OMGPOP DoubleTwist Tynt GoViral LendingClub Peer39 Auditude Cellufun Glam Media Batanga DocuSign Apture SoundCloud Tripbase Hunch AdultSpace Jodange Foodista Facebook Visible Measures Azuki Systems Loop'd Network 33Across Three Melons The Rubicon Project SuperSecret Conductor Inc. ScanScout BlogHer Inc. Gist Fuhu Inc. Sports Composite DE Socialcast Scan & Target StumbleUpon TimeBridge One Net Entertainment Simulmedia Imeem FreeWheel Figure 3. Capital Market Activity, Last Three Months Source. Company reports Social Network remains the most active sector: Activity over the last three months was busiest in the Social Network sector, with eight companies raising over $249.3 million (Figure 4). The Ad Network sector has the next highest totals, with 12 companies raising $99.2 million. W e would note that the Facebook transaction at $200 million has skewed the results significantly in favour of Social Networks. Nevertheless, the following sectors continue to generate the most capital activity over the last few months: Ad Network, Media, Gaming, Video, and Social Networks.
  • 5. Page 5 Capital Market Activity by Sector - Last Three Months 300.0 250.0 200.0 (US$m) 150.0 249.3 100.0 50.0 99.2 63.4 50.6 49.5 30.2 21.3 14.4 12.0 12.0 10.4 8.9 7.5 7.0 6.8 5.9 5.5 0.0 5.0 4.7 4.1 3.1 2.0 2.0 2.0 1.3 1.3 0.6 Comment/Reputation Social Commerce Gaming Visual Commerce Travel Wiki Media Mobile Enterprise Collaboration Publishing Microblog Online Learning Mobile Ad Widget Search Lending Infrastructure Blog Social Networks SAS Video Virtual World Aggregation Crowdsourced Ad Network Analytics Content # companies 8 12 8 9 5 2 3 3 1 1 2 2 2 1 1 1 1 1 1 1 1 1 1 1 1 1 1 Figure 4. Capital Market Activity, by Sector, Last Three Months Source. Company reports Average round size decreases: On a trailing 12-month basis, total financing dollars fell as of May 2009, with average round sizes decreasing slightly (Figure 5).
  • 6. Page 6 LTM Financing 4,000.0 18.0 16.0 3,500.0 14.0 3,000.0 12.0 2,500.0 10.0 (US$m) (US$m) 2,000.0 ` 8.0 1,500.0 6.0 1,000.0 4.0 500.0 2.0 0.0 0.0 May-06 May-07 May-08 May-09 Nov-05 Mar-06 Nov-06 Mar-07 Nov-07 Mar-08 Nov-08 Mar-09 Jul-05 Sep-05 Jan-06 Jul-06 Sep-06 Jan-07 Jul-07 Sep-07 Jan-08 Jul-08 Sep-08 Jan-09 Total Average Figure 5. Financings, Last 12 Months Source. Company reports Cumulative total nears $6.8 billion: Overall, on a cumulative basis, W eb 2.0 financings have totalled nearly $6.8 billion, with the majority of the financing coming in late 2007 and the first three quarters of 2008 (Figure 6). Financing for the first quarter of 2009 passed that raised in the fourth quarter of 2008 – reversing the downtrend since the second quarter last year. However, for the period ended Q1/CY09, total capital raised was below the Q1/CY08 level (at $748.2 million). The total capital raise in Q2-to-date was $477.1 million, buoyed by the $200 million Facebook transaction, and is well below Q2/CY08 totals ($1.3 billion). It does not seem likely the Q2/CY09 will be better on a Y/Y basis.
  • 7. Page 7 Web 2.0 Financing (cumulative) 1,600.0 8,000.0 1,400.0 1,344.6 7,000.0 1,200.0 6,000.0 977.6 1,000.0 5,000.0 857.6 (US$m) (US$m) 800.0 4,000.0 579.9 573.8 600.0 3,000.0 477.1 378.6 400.0 354.1 2,000.0 178.7174.8162.4 200.0 1,000.0 126.4145.6111.5 88.3 47.5 33.5 61.5 38.8 24.7 22.2 43.3 0.0 0.0 Qtr1 Qtr2 Qtr3 Qtr4 Qtr1 Qtr2 Qtr3 Qtr4 Qtr1 Qtr2 Qtr3 Qtr4 Qtr1 Qtr2 Qtr3 Qtr4 Qtr1 Qtr2 Qtr3 Qtr4 Qtr1 Qtr2 2004 2005 2006 2007 2008 2009 Figure 6. Financing, Cumulative Source. Company reports U.S. remains dominant: U.S. companies continue to dominate capital market activity – with 70.0% of financings/M&A involving U.S. companies (based on dollars) (Figure 7). Based on number of transactions, the U.S. leads with 73.6% of deals, while Canada and UK each took 4.8% share of the total number of financings (Figure 8). Fi nancin g/M &A by Country - LTM ($) Financing/M&A by Country - LTM (#) China UK Canada 14.6% Israel 4.8% 4.8% 3.1% Russia France 3.4% 3.1% UK 2.3% Fr ance 1.9% Canada ROW 1.7% 10.6% Israe l 1 .6% ROW 4.5 % USA USA 70.0% 73.6% Figures 7 & 8. Financing/M&A, by Country (LTM, $, #) Source. Company reports
  • 8. Page 8 Larger volume of early-stage funding (by count): Almost half of financings in the last 12 months are for early-stage companies (Angel/Seed or Series A) (Figure 9). Series B rounds are 29.3% of the total, with later-stage (Series D, E and PIPE) deals accounting for just 7.5%. Financing by Type - LTM Series C 14.7% Series B 29.3% Series D 4.5% Series E 1.1% Angel/Seed 11.3% Debt financing Series A 3.0% 34.2% PIPE 1.9% Figure 9 Financing, by Type (LTM, #) Source. Company reports Equity financings smaller over last 12 months: In the last 12 months, the average size of Series A, C, and D rounds has all been lower than the overall average (Figure 10).
  • 9. Page 9 Average financing round size 40.0 36.0 35.0 32.0 30.0 26.3 25.1 25.0 21.6 (US$m) 20.0 18.3 15.0 11.4 11.4 10.8 10.8 10.0 7.9 6.5 6.9 5.4 5.0 3.3 2.6 0.0 Angel/Seed Debt financing PIPE Series A Series B Series C Series D Series E LTM Average Size Overall Average Figure 10. Average Size per Round Source. Company reports
  • 10. Page 10 C A P I T A L M A R K E T S A C T I V I T Y (P R I C E P E R F O R M A N C E ) Price Performance: Our W eb 2.0 index (market-cap weighted) underperformed the NASDAQ composite index from mid- 2008 until recently when it has moved sharply higher than the NASDAQ index (Figure 11). Web 2.0 Index Price Performance 103.63 93.63 83.63 73.63 63.63 53.63 43.63 Index: Web 2.0 X (Market Cap Weights) ^COMP - Share Pricing Figure 11. Web 2.0 Price Performance Source. Capital IQ GameOn Co. Ltd. leads; eolith Co. Ltd. falls: Most of the companies in our universe had positive stock price performances over the past week (for stocks with prices greater than $1) (Figure 12), with 29 companies showing positive returns on the week. GameOn Co. Ltd (3812-TSE) led the group with a 28.2% return, while eolith Co. Ltd. (A041060- KOSE) had the worst return, dropping 13.7% in the week.
  • 11. Page 11 1 Week P rice P erformance G ameOn Co Ltd. 28.2% Northgate Technologies Limited 27.2% Changy ou.com Limited 23.3% S ohu.com Inc. 22.1% A ctoz S of t Co., Ltd. 20.9% A Q Interactiv e, Inc. 19.4% CDC Corp. 18.9% S K Communications Co., Ltd. 17.6% Perfect World Co., Ltd. 16.6% Open Tex t Corp. 13.2% V alueClick Inc. 12.4% Gamania Digital Entertainment Co., 11.0% S handa Interactive Entertainment Ltd. 9.6% Tencent Holdings Ltd. 9.4% Neteas e.com Inc. 9.3% IA C/InterA ctiveCorp. 7.1% Quepas a Corp. 6.3% G ree, Inc. 6.2% United Online Inc. 6.1% S hutterf ly , Inc. 5.9% Modern Times G roup Mtg A B 5.4% G igaMedia Ltd. 4.0% Openw ave S y s tems Inc. 3.6% XING A G 3.3% The9 Limited 3.3% TheS treet.com, Inc. 3.2% Ngi G roup Inc. 2.1% LookS mart, Ltd. 1.6% DA DA S pA 0.3% Lingo Media Corporation 0.0% Chines e Gamer International -0.4% NEOWIZ Games Corporation -0.5% NetDragon WebS of t, Inc. -0.6% Webz en Inc. -0.7% Mix i, Inc. -2.6% Y nk K orea Inc. -2.7% Giant Interactive G roup, Inc. -4.1% HanbitS of t, Inc. -4.2% Y edangOnline Corp. -5.6% Frogs ter Interactiv e Pictures A G -6.3% K ings of t Co. Ltd. -6.6% G ravity Co., Ltd -6.8% PhotoChannel Netw orks Inc. -9.9% Cy berplex Inc. -10.3% Tree.Com, Inc. -12.0% B ey ond Commerc e, Inc. -12.2% Eolith Co. Ltd. -13.7% -20.0% -15.0% -10.0% -5.0% 0.0% 5.0% 10.0% 15.0% 20.0% 25.0% 30.0% 35.0% Figure 12. 1-Week Price Performance Source. Capital IQ