
Recomendados
Recomendados
Mais conteúdo relacionado
Semelhante a Canadian Labour Force Survey September 2010pdf
Semelhante a Canadian Labour Force Survey September 2010pdf (20)
Mais de cstedham
Último
Último (10)
Canadian Labour Force Survey September 2010pdf
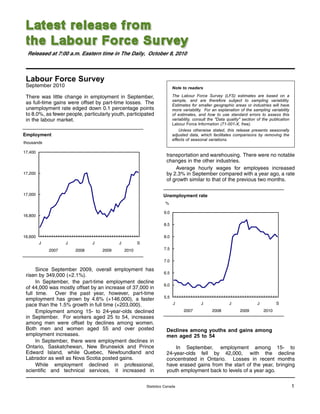
- 1. Released at 7:00 a.m. Eastern time in The Daily, October 8, 2010 Labour Force Survey September 2010 Note to readers There was little change in employment in September, The Labour Force Survey (LFS) estimates are based on a sample, and are therefore subject to sampling variability. as full-time gains were offset by part-time losses. The Estimates for smaller geographic areas or industries will have unemployment rate edged down 0.1 percentage points more variability. For an explanation of the sampling variability to 8.0%, as fewer people, particularly youth, participated of estimates, and how to use standard errors to assess this in the labour market. variability, consult the "Data quality" section of the publication Labour Force Information (71-001-X, free). Unless otherwise stated, this release presents seasonally Employment adjusted data, which facilitates comparisons by removing the effects of seasonal variations. thousands 17,400 transportation and warehousing. There were no notable changes in the other industries. Average hourly wages for employees increased 17,200 by 2.3% in September compared with a year ago, a rate of growth similar to that of the previous two months. 17,000 Unemployment rate % 9.0 16,800 8.5 16,600 8.0 J J J J S 2007 2008 2009 2010 7.5 7.0 Since September 2009, overall employment has 6.5 risen by 349,000 (+2.1%). In September, the part-time employment decline 6.0 of 44,000 was mostly offset by an increase of 37,000 in full time. Over the past year, however, part-time 5.5 employment has grown by 4.6% (+146,000), a faster pace than the 1.5% growth in full time (+203,000). J J J J S Employment among 15- to 24-year-olds declined 2007 2008 2009 2010 in September. For workers aged 25 to 54, increases among men were offset by declines among women. Both men and women aged 55 and over posted Declines among youths and gains among employment increases. men aged 25 to 54 In September, there were employment declines in Ontario, Saskatchewan, New Brunswick and Prince In September, employment among 15- to Edward Island, while Quebec, Newfoundland and 24-year-olds fell by 42,000, with the decline Labrador as well as Nova Scotia posted gains. concentrated in Ontario. Losses in recent months While employment declined in professional, have erased gains from the start of the year, bringing scientific and technical services, it increased in youth employment back to levels of a year ago. Statistics Canada 1
- 2. There were also declines among women Professional, scientific and technical services aged 25 to 54 (-28,000) in September, which brought down following a period of strong growth their employment to a level similar to that of one year earlier. In September, employment in professional, scientific Employment among men aged 25 to 54 increased and technical services declined by 32,000 (-2.4%). by 27,000 in September. With this increase, employment Despite this drop, employment in this industry has gains for this group have totalled 138,000 (+2.3%) over grown by 86,000, or 7.2%, over the past 12 months, the past 12 months. one of the highest rates of growth among all major industries. Employment among those aged 55 and over continued its longstanding upward trend in September, The number of workers in transportation and with increases of 20,000 for men and 17,000 for warehousing rose by 15,000 in September, bringing women. Over the past 12 months, employment for this total gains to 30,000 (+3.8%) over the past 12 months. age group has grown by 7.7% among men and 5.9% There was little change in manufacturing among women, the highest rates of growth among all employment, continuing a stable trend that emerged demographic groups. about a year ago. Although construction was little changed in Employment losses in Ontario September, employment in this industry has been on an upward trend for over a year, with gains totalling 68,000, Employment fell by 23,000 in Ontario in September. or 5.8%, over the past 12 months. Employment growth The unemployment rate remained unchanged at 8.8%, in construction has been among the fastest of all the as there were fewer people, particularly youth, major industry groups over the past year. participating in the labour market. Despite the decline in September, employment in Ontario grew There was virtually no change in the number of by 127,000 (+1.9%) from a year earlier. public or private sector employees in September, while the number of self-employed edged down. During the Following a notable gain in August, employment past 12 months, growth in the public sector (+3.7% in Saskatchewan dropped by 4,600 in September, or +128,000) has outpaced that in the private sector pushing the unemployment rate up 0.7 percentage (+2.4% or +261,000). Over the same period, the number points to 5.5%. Despite this loss, employment has of self-employed workers declined by 1.5% (-40,000). increased by 7,000 (+1.3%) over the past 12 months. There were 2,500 fewer workers in New Brunswick in Quarterly update on territories September, bringing total losses over the past 12 months to 5,600 (-1.5%). The Labour Force Survey also collects labour Employment in Prince Edward Island declined market information about the territories. This information by 2,200. This brought employment back to the same is produced monthly in the form of three-month moving level as a year earlier. averages. Not all estimates are seasonally adjusted; therefore, comparisons should only be made on a In Quebec, employment was up 15,000 in year-over-year basis. September, pushing the unemployment rate down 0.5 percentage points to 7.7%. The number Employment was higher in all three territories in the of workers in Quebec has risen by 122,000, or 3.2%, third quarter of 2010 compared with the same quarter over the past year, the second highest growth rate at in 2009. In the Northwest Territories, employment the national level after Newfoundland and Labrador. increased by 1,400 over the period, pushing the Newfoundland and Labrador posted employment unemployment rate down 1.2 percentage points gains of 4,900. This province has had the fastest rate of to 6.4%. growth of all provinces over the past 12 months, at 5.3% In Nunavut, employment increased by 900 for the (+11,000). At the same time, the unemployment rate three months ending in September 2010 compared has trended down, reaching 13.5% in September, the with the same period in 2009. The unemployment lowest rate since July 2008. rate was 14.2% in the third quarter of 2010, relatively In Nova Scotia, employment rose by 3,500 in unchanged from the same period in 2009. September, pushing the unemployment rate In Yukon, 700 more people were working in the down 0.8 percentage points to 9.0%. Employment third quarter of 2010 compared with a year earlier. The gains in the province have totalled 7,400 (+1.6%) over unemployment rate, at 6.3%, was slightly higher than in the past 12 months. the third quarter of 2009. 2 Statistics Canada
- 3. The unemployment rates for the Northwest Data tables are also now available online. From the Territories and Yukon are among the lowest in the Subject module of our website, choose Labour. country. These two territories also had the highest The next release of the Labour Force Survey will be proportions of the working-age population that were on November 5. employed, at 71.1% for Yukon and 68.9% for the Northwest Territories. For more information, or to order data, contact Client Services (toll-free 1-866-873-8788; Available on CANSIM: tables 282-0001 to 282-0042, 613-951-4090; labour@statcan.gc.ca). To enquire 282-0047 to 282-0064 and 282-0069 to 282-0108. about the concepts, methods or data quality of this release, contact Vincent Ferrao (613-951-4750; Definitions, data sources and methods: survey vincent.ferrao@statcan.gc.ca) or Lahouaria Yssaad number 3701. (613-951-0627; lahouaria.yssaad@statcan.gc.ca), Labour Statistics Division. A more detailed summary, Labour Force Information (71-001-X, free), is now available online for the week ending September 18. From the Key resource module of our website under Publications, choose All subjects, then Labour. LAN and bulk prices are available on request. The DVD-ROM Labour Force Historical Review, 2009 (71F0004X, $209), is now available. See How to order products. Statistics Canada 3
- 4. Labour force characteristics by age and sex August September August September August September 2010 2010 to 2009 to 2009 September to September to 2010 September 2010 September 2010 2010 Seasonally adjusted thousands change in thousands % change Both sexes, 15 years and over Population 27,779.5 27,809.6 30.1 408.1 0.1 1.5 Labour force 18,727.1 18,702.7 -24.4 314.1 -0.1 1.7 Employment 17,216.3 17,209.7 -6.6 349.0 0.0 2.1 Full-time 13,825.5 13,862.6 37.1 203.2 0.3 1.5 Part-time 3,390.8 3,347.1 -43.7 145.8 -1.3 4.6 Unemployment 1,510.9 1,493.0 -17.9 -34.9 -1.2 -2.3 Participation rate 67.4 67.3 -0.1 0.2 ... ... Unemployment rate 8.1 8.0 -0.1 -0.3 ... ... Employment rate 62.0 61.9 -0.1 0.4 ... ... Part-time rate 19.7 19.4 -0.3 0.4 ... ... Youths, 15 to 24 years Population 4,408.9 4,409.3 0.4 10.9 0.0 0.2 Labour force 2,862.5 2,821.0 -41.5 -1.5 -1.4 -0.1 Employment 2,443.5 2,401.6 -41.9 5.6 -1.7 0.2 Full-time 1,242.2 1,250.1 7.9 -39.7 0.6 -3.1 Part-time 1,201.3 1,151.6 -49.7 45.5 -4.1 4.1 Unemployment 419.0 419.4 0.4 -7.1 0.1 -1.7 Participation rate 64.9 64.0 -0.9 -0.2 ... ... Unemployment rate 14.6 14.9 0.3 -0.2 ... ... Employment rate 55.4 54.5 -0.9 0.0 ... ... Part-time rate 49.2 48.0 -1.2 1.8 ... ... Men, 25 years and over Population 11,433.0 11,447.7 14.7 198.1 0.1 1.8 Labour force 8,420.1 8,443.1 23.0 186.5 0.3 2.3 Employment 7,794.8 7,841.1 46.3 255.0 0.6 3.4 Full-time 7,179.2 7,213.3 34.1 221.4 0.5 3.2 Part-time 615.7 627.8 12.1 33.7 2.0 5.7 Unemployment 625.3 602.1 -23.2 -68.4 -3.7 -10.2 Participation rate 73.6 73.8 0.2 0.4 ... ... Unemployment rate 7.4 7.1 -0.3 -1.0 ... ... Employment rate 68.2 68.5 0.3 1.1 ... ... Part-time rate 7.9 8.0 0.1 0.2 ... ... Women, 25 years and over Population 11,937.6 11,952.7 15.1 199.2 0.1 1.7 Labour force 7,444.5 7,438.5 -6.0 128.9 -0.1 1.8 Employment 6,977.9 6,967.0 -10.9 88.3 -0.2 1.3 Full-time 5,404.1 5,399.2 -4.9 21.5 -0.1 0.4 Part-time 1,573.8 1,567.7 -6.1 66.7 -0.4 4.4 Unemployment 466.6 471.6 5.0 40.7 1.1 9.4 Participation rate 62.4 62.2 -0.2 0.0 ... ... Unemployment rate 6.3 6.3 0.0 0.4 ... ... Employment rate 58.5 58.3 -0.2 -0.2 ... ... Part-time rate 22.6 22.5 -0.1 0.7 ... ... ... not applicable Note: Related CANSIM table 282-0087. 4 Statistics Canada
- 5. Employment by class of worker and industry (based on NAICS1) August September August September August September 2010 2010 to 2009 to 2009 September to September to 2010 September 2010 September 2010 2010 Seasonally adjusted thousands change in thousands % change Class of worker Employees 14,507.6 14,519.4 11.8 389.3 0.1 2.8 Self-employed 2,708.7 2,690.3 -18.4 -40.3 -0.7 -1.5 Public/private sector employees Public 3,555.7 3,562.2 6.5 128.4 0.2 3.7 Private 10,951.9 10,957.2 5.3 260.9 0.0 2.4 All industries 17,216.3 17,209.7 -6.6 349.0 0.0 2.1 Goods-producing sector 3,769.1 3,772.6 3.5 46.1 0.1 1.2 Agriculture 302.1 297.6 -4.5 -22.5 -1.5 -7.0 Natural resources 341.4 334.9 -6.5 24.0 -1.9 7.7 Utilities 148.8 150.3 1.5 0.4 1.0 0.3 Construction 1,238.5 1,243.3 4.8 67.7 0.4 5.8 Manufacturing 1,738.4 1,746.6 8.2 -23.5 0.5 -1.3 Services-producing sector 13,447.1 13,437.0 -10.1 302.8 -0.1 2.3 Trade 2,696.7 2,697.0 0.3 31.2 0.0 1.2 Transportation and warehousing 804.1 819.1 15.0 30.2 1.9 3.8 Finance, insurance, real estate and leasing 1,091.0 1,103.4 12.4 -18.7 1.1 -1.7 Professional, scientific and technical services 1,319.9 1,288.0 -31.9 86.1 -2.4 7.2 Business, building and other support services 675.8 680.3 4.5 40.5 0.7 6.3 Educational services 1,232.1 1,222.3 -9.8 24.3 -0.8 2.0 Health care and social assistance 2,062.5 2,066.0 3.5 112.4 0.2 5.8 Information, culture and recreation 761.8 757.9 -3.9 -31.7 -0.5 -4.0 Accommodation and food services 1,060.9 1,055.5 -5.4 19.2 -0.5 1.9 Other services 766.5 764.7 -1.8 -39.5 -0.2 -4.9 Public administration 975.8 982.9 7.1 48.8 0.7 5.2 1. North American Industry Classification System. Note: Related CANSIM tables 282-0088 and 282-0089. Statistics Canada 5
- 6. Labour force characteristics by province August September August September August September 2010 2010 to 2009 to 2009 September to September to 2010 September 2010 September 2010 2010 Seasonally adjusted thousands change in thousands % change Newfoundland and Labrador Population 431.9 432.0 0.1 2.3 0.0 0.5 Labour force 259.9 263.8 3.9 7.4 1.5 2.9 Employment 223.4 228.3 4.9 11.4 2.2 5.3 Full-time 189.1 195.2 6.1 10.3 3.2 5.6 Part-time 34.2 33.1 -1.1 1.2 -3.2 3.8 Unemployment 36.5 35.5 -1.0 -4.1 -2.7 -10.4 Participation rate 60.2 61.1 0.9 1.4 ... ... Unemployment rate 14.0 13.5 -0.5 -1.9 ... ... Employment rate 51.7 52.8 1.1 2.3 ... ... Prince Edward Island Population 117.7 117.9 0.2 1.5 0.2 1.3 Labour force 81.1 80.8 -0.3 1.6 -0.4 2.0 Employment 72.0 69.8 -2.2 0.0 -3.1 0.0 Full-time 58.8 57.0 -1.8 -0.9 -3.1 -1.6 Part-time 13.2 12.7 -0.5 0.8 -3.8 6.7 Unemployment 9.1 11.0 1.9 1.6 20.9 17.0 Participation rate 68.9 68.5 -0.4 0.5 ... ... Unemployment rate 11.2 13.6 2.4 1.7 ... ... Employment rate 61.2 59.2 -2.0 -0.8 ... ... Nova Scotia Population 776.8 777.2 0.4 3.9 0.1 0.5 Labour force 504.9 504.5 -0.4 5.3 -0.1 1.1 Employment 455.6 459.1 3.5 7.4 0.8 1.6 Full-time 365.6 368.8 3.2 -0.1 0.9 0.0 Part-time 90.0 90.3 0.3 7.5 0.3 9.1 Unemployment 49.3 45.5 -3.8 -2.0 -7.7 -4.2 Participation rate 65.0 64.9 -0.1 0.3 ... ... Unemployment rate 9.8 9.0 -0.8 -0.5 ... ... Employment rate 58.7 59.1 0.4 0.7 ... ... New Brunswick Population 625.2 625.5 0.3 3.3 0.0 0.5 Labour force 403.4 401.7 -1.7 1.2 -0.4 0.3 Employment 364.8 362.3 -2.5 -5.6 -0.7 -1.5 Full-time 308.0 305.5 -2.5 -5.0 -0.8 -1.6 Part-time 56.7 56.9 0.2 -0.5 0.4 -0.9 Unemployment 38.6 39.4 0.8 6.8 2.1 20.9 Participation rate 64.5 64.2 -0.3 -0.2 ... ... Unemployment rate 9.6 9.8 0.2 1.7 ... ... Employment rate 58.3 57.9 -0.4 -1.2 ... ... Quebec Population 6527.6 6533.4 5.8 81.5 0.1 1.3 Labour force 4288.2 4283.8 -4.4 86.7 -0.1 2.1 Employment 3938.2 3953.4 15.2 122.3 0.4 3.2 Full-time 3150.8 3191.8 41.0 72.5 1.3 2.3 Part-time 787.3 761.6 -25.7 49.7 -3.3 7.0 Unemployment 350.0 330.4 -19.6 -35.6 -5.6 -9.7 Participation rate 65.7 65.6 -0.1 0.5 ... ... Unemployment rate 8.2 7.7 -0.5 -1.0 ... ... Employment rate 60.3 60.5 0.2 1.1 ... ... ... not applicable Note: Related CANSIM table 282-0087. 6 Statistics Canada
- 7. Labour force characteristics by province August September August September August September 2010 2010 to 2009 to 2009 September to September to 2010 September 2010 September 2010 2010 Seasonally adjusted thousands change in thousands % change Ontario Population 10,840.2 10,853.6 13.4 158.3 0.1 1.5 Labour force 7,326.9 7,307.3 -19.6 124.7 -0.3 1.7 Employment 6,684.9 6,662.0 -22.9 126.8 -0.3 1.9 Full-time 5,369.2 5,356.4 -12.8 71.6 -0.2 1.4 Part-time 1,315.7 1,305.5 -10.2 55.1 -0.8 4.4 Unemployment 642.0 645.3 3.3 -2.1 0.5 -0.3 Participation rate 67.6 67.3 -0.3 0.1 ... ... Unemployment rate 8.8 8.8 0.0 -0.2 ... ... Employment rate 61.7 61.4 -0.3 0.3 ... ... Manitoba Population 939.0 939.8 0.8 13.7 0.1 1.5 Labour force 658.5 659.0 0.5 16.3 0.1 2.5 Employment 621.6 623.7 2.1 15.1 0.3 2.5 Full-time 498.6 502.4 3.8 12.3 0.8 2.5 Part-time 123.0 121.2 -1.8 2.7 -1.5 2.3 Unemployment 36.9 35.4 -1.5 1.3 -4.1 3.8 Participation rate 70.1 70.1 0.0 0.7 ... ... Unemployment rate 5.6 5.4 -0.2 0.1 ... ... Employment rate 66.2 66.4 0.2 0.7 ... ... Saskatchewan Population 793.5 794.1 0.6 12.0 0.1 1.5 Labour force 558.2 557.8 -0.4 12.2 -0.1 2.2 Employment 531.4 526.8 -4.6 7.0 -0.9 1.3 Full-time 428.5 426.1 -2.4 2.3 -0.6 0.5 Part-time 102.9 100.7 -2.2 4.7 -2.1 4.9 Unemployment 26.8 30.9 4.1 5.1 15.3 19.8 Participation rate 70.3 70.2 -0.1 0.4 ... ... Unemployment rate 4.8 5.5 0.7 0.8 ... ... Employment rate 67.0 66.3 -0.7 -0.2 ... ... Alberta Population 2,935.9 2,939.7 3.8 57.5 0.1 2.0 Labour force 2,143.8 2,135.8 -8.0 5.4 -0.4 0.3 Employment 2,003.9 2,004.2 0.3 19.3 0.0 1.0 Full-time 1,646.2 1,652.2 6.0 18.1 0.4 1.1 Part-time 357.6 352.0 -5.6 1.2 -1.6 0.3 Unemployment 140.0 131.6 -8.4 -13.9 -6.0 -9.6 Participation rate 73.0 72.7 -0.3 -1.2 ... ... Unemployment rate 6.5 6.2 -0.3 -0.6 ... ... Employment rate 68.3 68.2 -0.1 -0.7 ... ... British Columbia Population 3,791.7 3,796.4 4.7 73.8 0.1 2.0 Labour force 2,502.1 2,508.2 6.1 53.4 0.2 2.2 Employment 2,320.6 2,320.3 -0.3 45.6 0.0 2.0 Full-time 1,810.5 1,807.1 -3.4 22.0 -0.2 1.2 Part-time 510.1 513.1 3.0 23.5 0.6 4.8 Unemployment 181.5 187.9 6.4 7.8 3.5 4.3 Participation rate 66.0 66.1 0.1 0.2 ... ... Unemployment rate 7.3 7.5 0.2 0.2 ... ... Employment rate 61.2 61.1 -0.1 0.0 ... ... ... not applicable Note: Related CANSIM table 282-0087. Statistics Canada 8