1. Q2 2012 | OFFICE
NORTH AMERICA
HIGHLIGHTS
In Slow(ing) Motion
K.C. CONWAY, MAI, CRE EMD | Market Analytics
The Bottom Line
MARKET INDICATORS • ICEE
(Intellectual Capital, Energy and Education) markets continue to generate a disproportionate
Relative to prior period share of office absorption. Nine of the ten highest absorption numbers are in ICEE markets.
• Office
transaction activity is slowing. According to Real Capital Analytics, office sales are down
Q2 Q3
21 percent in the first half of 2012 compared to the second half of 2011. May was the first month
U.S. 2012 2012*
in 2012 to register a year-over-year decline in office building sales.
VACANCY • Monthlydelinquency rates for CMBS loans collateralized by office properties continue to set
NET ABSORPTION all-time records. July saw another all-time high—the fifth straight month in which the delinquency
CONSTRUCTION rate has increased.
RENTAL RATE • The
average office vacancy rate for North America is improving, but at a slower pace than in 2011.
*Projected The rate declined a modest 13 basis points to 14.29 percent.
• U.S.
new supply continues to come online at approximately the same pace as the trailing five-
U.S. AND CANADA OFFICE MARKET quarter average. With 38.4 million square feet of new construction still underway, additions to
Summary Statistics, Q2 2012 supply will impede improvement in occupancy or rental rates over the next 4 to 8 quarters.
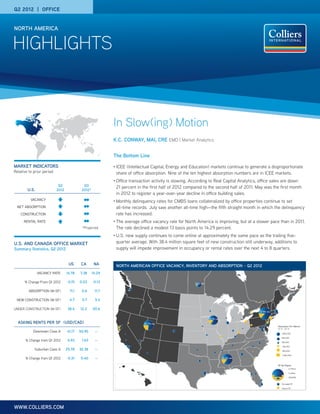
US CA NA NORTH AMERICAN OFFICE VACANCY, INVENTORY AND ABSORPTION – Q2 2012
VACANCY RATE 14.78 7.38 14.29
% Change From Q1 2012 -0.15 0.03 -0.13 7.4% vac.
ABSORPTION (M-SF) 11.1 0.6 11.7
NEW CONSTRUCTION (M-SF) 4.7 0.7 5.4
UNDER CONSTRUCTION (M-SF) 38.4 12.2 50.6
13.5% vac.
15.1% vac.
ASKING RENTS PER SF (USD/CAD) 22.7% vac.
Absorption Per Market
Q1 '12 - Q2 '12
Downtown Class A 41.17 50.95 — 1,900,000
950,000
% Change from Q1 2012 0.93 1.63 — 190,000
-190,000
Suburban Class A 25.78 32.38 — -950,000
-1,900,000
% Change from Q1 2012 -0.31 0.40 — 15.2% vac.
SF By Region
2 million
1 million
200,000
Occupied SF
Vacant SF
WWW.COLLIERS.COM
2. HIGHLIGHTS | Q2 2012 | OFFICE | NORTH AMERICA
Office Market Exposed to Harmful UV (Uncertainty and U.S. OFFICE MARKET Q2 2010 – Q2 2012
Volatility) Rays
16.0 18.0
16.29 16.26 16.11 15.57 15.36 15.14 15.03 14.93 14.78
The key metrics of market health such as absorption, vacancy and sales 14.0 16.0
volume showed positive growth in Q2. However, that growth has slowed.
12.0 14.0
We believe this slowing is due to this summer’s harmful UV (uncertainty
12.0
and volatility) rays. As any parent will tell you, prolonged exposure to UV 10.0
Vacancy %
carries the potential for damage. 10.0
8.0
8.0
UV sources are both home and abroad: 6.0
6.0
4.0
• Europe’s unresolved debt crisis 4.0
2.0
• Uncertainty around U.S. national elections 2.0
• Erratic
monthly employment numbers—a drop to 64,000 new jobs Q2 Q3 Q4 Q1 Q2 Q3 Q4 Q1 Q2
in June followed by an increase to 163,000 in July 2010 2011 2012
• Corporate earnings without top-line revenue growth
AbsorpƟon MSF CompleƟons MSF Vacancy %
• Rising, record-high CMBS loan delinquencies
NON-FARM PAYROLL EMPLOYMENT OVER-THE-MONTH CHANGE, Houston, Boston, Atlanta and Chicago Lead Demand in
SEASONALLY ADJUSTED I JULY 2010 – JULY 2012 Biggest Markets
Thousands BLS July Jobs Report
Colliers monitors eighty-three North American office markets, totaling 6.4
300
billion square feet of inventory. Of these, the twenty-five largest markets
250
constitute approximately sixty-five percent of the 6.4 billion square feet of
200 office space. These 25 markets account for 56 percent of the 25 million
150 square feet of year-to-date net absorption, yet only fourteen have a
100 vacancy rate below the Q2 average of 14.78 percent.
50
• Thetop 10 office markets account for 40 percent of Q2 2012 vacant
0
office space. Among these, only Washington, D.C., New York and Houston
-50
have vacancy rates below 14.78%, the U.S. average.
-100
• Thetop 10 markets account for 36 percent of year-to-date net absorp-
12-May
10-Aug
10-Nov
10-Dec
12-Mar
10-Sep
12-Jun
11-May
12-Jan
12-Apr
12-Feb
10-Oct
11-Aug
11-Mar
11-Nov
11-Dec
11-Sep
11-Jun
11-Jan
11-Apr
11-Feb
10-Jul
12-Jul
11-Oct
11-Jul
tion, approximately 9 million square feet. Houston, Boston, Atlanta and
Chicago lead the pack, with each market recording more than 1 million
square feet of net absorption year-to-date.
These UV rays have dampened investor enthusiasm for office properties
and are holding down transaction volume. Year-over-year total office trans-
actions are down 10 percent from $16.4 billion in Q2 2011 to $14.8 billion
this quarter, based on figures from Real Capital Analytics. This transaction
drop is even more pronounced when the first half of 2012 is compared to
the previous year, revealing a twenty-one percent decrease. The current
decline is especially noteworthy given that commercial property transac-
tion levels were already low from the impact of the U.S. debt downgrade
in August of last year.
Market watchers in search of strong UV protection are holding out hope
for consistent significant employment growth, an improved global GDP,
congressional action concerning the “fiscal cliff” of expiring Bush-era tax
cuts, and the passing of the U.S. national elections. In the meantime,
investors will hibernate in liquid investments like U.S. Treasurys, driving
yields to unprecedented lows. We would not be surprised to see the yield
on the 10-year treasury and the growth rate of U.S. GDP converge near
1 percent at some point this year—an oddity representative of our times.
P. 2 | COLLIERS INTERNATIONAL
3. HIGHLIGHTS | Q2 2012 | OFFICE | NORTH AMERICA
ICEE Markets Still Hot Offices Absorption Positive, but Shrinking
In our last North America Highlights report, we introduced the concept Office absorption also appears to be slowing: North American offices
of ICEE (Intellectual Capital, Energy and Education) markets, which are absorbed 19.2 million square feet in the first half of 2012, down six percent
defined by the predominance of employment demand drivers linked to from the second half of 2011. In addition, demand is weaker for office than
technology, energy and higher education. Markets such as Houston, other commercial property types. For example, office absorption in the first
Seattle and Silicon Valley fall into the ICEE category. half of 2012 is just 30 percent of the 63.3 million square feet of industrial
absorption.
SELECT INTELLECTUAL CAPITAL, ENERGY AND EDUCATION (ICEE) CITIES
Calgary CBD office buildings are outperforming the suburbs as companies consoli-
Seattle date operations into the central core of MSAs. Large spaces are in stronger
demand as a result of this consolidation. Landlords are finding they are
able to increase rents for large space users at lease renewal.
Toronto
Despite the UV rays of inconsistent unemployment growth, there is a bright
Baltimore
Silicon Valley Denver spot for office leasing to be found in recent employment reports: A consis-
Washington
tent upward trend in professional and business services hiring. Employment
Raleigh in professional and business services increased by 49,000 in July. This
was the most of all industry categories and it accounted for 30 percent of
the 163,000 gain in total non-farm employment. This trend was also
Austin
Houston
evident in Q2 ADP private employment reports. We believe that increasing
professional and business services employment foretells stronger office
leasing activity, especially as UV rays dissipate later in the year.
U.S. Office Vacancy Dips Below 15%
Employment growth in energy, technology and knowledge industries has
caused office demand to improve the most in ICEE markets. This trend For the first time in nearly five years, U.S. office vacancy rate dropped
continued in Q2 2012, as ICEE office markets captured a disproportionate below 15 percent in Q1 of this year. This downward trend continued in Q2.
share of absorption. Nine of the ten markets with the highest absorption This accomplishment was due in large part to strong absorption in ICEE
fall into the ICEE category, led by Houston, Oklahoma City and Boston. markets such as Houston, Seattle, Calgary, Toronto and Boston. The ten
largest office markets account for 40 percent of the 915 million square feet
We compared the absorption and vacancy statistics of the biggest ICEE of vacant office space in North America.
and FIRE (Finance, Insurance and Real Estate) markets.
Office Markets with the Most Vacant Square Feet
• Although
the largest 8 ICEE and FIRE markets each contain approxi-
Vacancy Vacancy
mately the same amount of office space, the ICEE markets have nearly Rate Rate
double the amount of year-to-date absorption. New York 59.4 11.8% Houston 28.7 14.5%
• The average vacancy rate is 140 basis points lower in the ICEE markets. Washington, DC 56.6 MSF 13.5% Los Angeles 36.0 MSF 18.0%
Dallas/Fort Worth 51.4 16.9% Detroit 34.6 18.8%
Chicago 48.7 15.5% Boston 30.1 17.6%
Atlanta 38.6 17.4% Philadelphia 21.3 13.9%
ICEE MARKET INVENTORY (SF) VACANCY YTD ABSORPTION FIRE MARKET INVENTORY (SF) VACANCY YTD ABSORPTION
Houston, TX 198,034,320 14.5% 2,444,573 Atlanta, GA 221,833,381 17.4% 1,342,776
Oklahoma City, OK 41,891,987 10.4% 1,730,066 Chicago, IL 315,239,889 15.5% 1,133819
Boston, MA 170,547,635 17.6% 1,567,493 Miami-Dade, FL 80,594,493 15.4% 774,686
Calgary, AB 62,646,626 5.4% 1,553,573 Orange County, CA 80,477,400 17.7% 608,400
Philadelphia, PA 153,037,785 13.9% 1,266,608 Minneapolis, MN 115,785,768 14.1% 579,164
Denver, CO 138,667,945 13.6% 1,153,444 Los Angeles, CA 200,433,500 18.0% 480,100
Seattle/Puget Sound, WA 129,083,066 12.7% 1,133,302 Charlotte, NC 96,836,008 12.8% 448,139
Dallas/Fort Worth, TX 304,948,553 16.9% 875,267 Orlando, FL 68,739,861 14.2% 394,197
TOTAL FOR LARGEST 8 1,198,857,917 14.6% 11,724,326 TOTAL FOR LARGEST 8 1,179,940,300 16.0% 5,761,281
Note: New York and San Francisco each contain strong ICEE and FIRE concentrations. Compelling arguments could be made for inclusion of each city in either category.
For this reason, we’ve omitted both from this table.
P. 3 | COLLIERS INTERNATIONAL
4. HIGHLIGHTS | Q2 2012 | OFFICE | NORTH AMERICA
When Will Vacancy Drop Below 14%? Excluding renewals, of the leases signed this
quarter in your CBD/downtown, did most
Professional and business service employment now accounts for approximately one-third of the tenants:
150,000 average monthly job growth. Yet, the fate of the office vacancy rate does not merely
depend upon an increase in office workers; new construction also plays a role in the calculation.
Unfortunately, the drop below 15 percent may not be outshined by a drop below 14 percent any
Hold Steady
time soon. 64%
Expand
Look for only modest improvement in office vacancy rates over the next two years. This quarter, 22%
additions to new supply totaled 4.7 million square feet, approximately the same amount as the Contract
13%
trailing five-quarter average. While this equates to just 0.3% of existing inventory, an additional
38.4 million square feet is under construction. Completion of this inventory over the next 4–6
quarters means that an additional 0.6% of existing inventory will come online by the end of 2013.
Assuming that absorption can sustain a pace of 11 million square feet per quarter, vacancy will
only drop to around 14.5 percent.
What was the trend in free rent (in months)
CMBS: Can More Buildings Succumb to Delinquency? offered by CBD landlords this quarter?
As the delinquency rate for CMBS loans collateralized by office properties continues to skyrocket,
we wonder if CMBS actually stands for “Can More Buildings Succumb?” According to data
provided by Trepp, the third quarter commenced with another all-time high CMBS delinquency
Same
rate, up 18 basis points in July to 10.36 percent. This marks the fifth straight month in which the 83%
rate has increased.
Less
12%
Many CMBS borrowers are now confronted with a property value far below the mortgage balance More
5%
at maturity. Without equity infusion into an already over-leveraged asset, a maturity default and
loss is inevitable. The 12-month moving average for losses on these types of matured and
delinquent loans is in the range of 40% to 45%. At the end of Q2 2012, $59.5 billion in CMBS
were delinquent.
What was the trend for tenant improvement
Delinquency Rates allowances offered by CBD landlords this
quarter?
PROPERTY TYPES – % 30 DAYS +
JUL – 12 JUN – 12 MAY – 12 3 – MO 6 – MO 1 – YR
Same
88%
Industrial 11.72 11.54 12.82 12.36 12.14 11.09
Less
11% More
Lodging 13.06 12.95 12.27 10.55 12.09 15.04 2%
Multifamily 15.69 15.17 15.17 15.18 15.39 16.94
Office 10.69 10.45 10.26 10.23 8.90 8.17 Excluding renewals, of the leases signed this
quarter in your CBD/downtown, did most
tenants:
Retail 8.03 8.17 8.07 7.98 7.88 7.85
Overall 10.34 10.16 10.04 9.80 9.52 9.88
Hold Steady
52%
Source: Trepp Expand
27%
Contract
21%
P. 4 | COLLIERS INTERNATIONAL
5. HIGHLIGHTS | Q2 2012 | OFFICE | NORTH AMERICA
UNITED STATES | DOWNTOWN OFFICE | ALL INVENTORY
VACANCY
EXISTING NEW SUPPLY UNDER VACANCY RATE (%) ABSORPTION
INVENTORY (SF) Q2 2012 CONSTRUCTION RATE (%) JUNE 30, Q2 2012
MARKET JUNE 30, 2012 (SF) (SF) MAR. 31, 2012 2012 (SF)
NORTHEAST
Baltimore, MD 29,619,980 - - 15.5% 14.6% 267,797
Boston, MA 61,100,797 - 2,323,000 15.4% 14.5% 535,691
Hartford, CT 9,753,215 - - 20.8% 20.5% 30,673
New York, NY – Downtown Manhattan 110,942,138 - 5,200,000 16.0% 16.6% (704,295)
New York, NY – Midtown Manhattan 227,532,283 - 1,052,150 11.7% 11.9% (482,682)
New York, NY – Midtown South Manhattan 165,368,697 - 850,000 8.6% 8.4% 419,084
Philadelphia, PA 43,083,670 - - 11.6% 11.1% 220,876
Pittsburgh, PA 32,029,558 - - 9.8% 9.9% (152,154)
Stamford, CT 19,161,595 - - 18.7% 19.6% (91,836)
Washington, DC 141,428,834 385,791 1,859,251 10.3% 10.3% 327,896
White Plains, NY 7,793,594 - - 14.8% 14.8% 1,715
Northeast Total 847,814,361 385,791 11,284,401 12.0% 12.0% 372,765
SOUTH
Atlanta, GA 50,058,800 - 450,000 17.4% 17.1% 136,766
Birmingham, AL 4,078,312 - - 21.2% 19.0% 10,896
Charleston, SC 2,068,469 - 52,000 9.1% 8.5% 12,499
Charlotte, NC 22,548,471 - - 11.3% 12.7% (247,307)
Columbia, SC 4,954,095 - - 23.8% 23.9% (5,553)
Dallas/Fort Worth, TX 45,198,638 - 154,801 24.3% 24.0% 137,252
Ft. Lauderdale-Broward, FL 8,022,996 - - 16.1% 16.7% (26,269)
Houston, TX 37,898,052 - - 14.4% 14.4% 95,470
Jacksonville, FL 15,902,019 - - 14.5% 14.7% (28,189)
Little Rock, AR 6,525,315 - - 14.5% 13.6% 112,932
Louisville, KY 43,260,784 - - 12.0% 11.4% 229,283
Memphis, TN 6,392,399 - - 14.5% 14.4% 3,592
Miami-Dade, FL 17,784,691 - - 20.5% 19.1% 214,314
Nashville, TN 12,012,368 83,923 20,000 15.3% 14.6% 66,504
Oklahoma City, OK 11,277,649 - - 15.0% 14.4% 64,713
Orlando, FL 12,632,862 - - 11.6% 11.4% 22,607
Raleigh/Durham/Chapel Hill, NC 13,613,840 165,044 - 6.2% 6.1% 159,226
Savannah, GA 746,548 - 72,000 15.1% 15.2% (1,414)
Tampa Bay, FL 8,511,259 - - 13.9% 13.6% 22,705
West Palm Beach/Palm Beach County, FL 10,083,575 - - 18.5% 18.0% 35,885
South Total 333,571,142 248,967 748,801 15.9% 15.7% 1,015,912
COLLIERS INTERNATIONAL | P. 5
6. HIGHLIGHTS | Q2 2012 | OFFICE | NORTH AMERICA
UNITED STATES | DOWNTOWN OFFICE | ALL INVENTORY (continued)
VACANCY
EXISTING NEW SUPPLY UNDER VACANCY RATE (%) ABSORPTION
INVENTORY (SF) Q2 2012 CONSTRUCTION RATE (%) JUNE 30, Q2 2012
MARKET JUNE 30, 2012 (SF) (SF) MAR. 31, 2012 2012 (SF)
MIDWEST
Chicago, IL 159,405,948 - - 13.9% 13.9% (59,570)
Cincinnati, OH 18,008,286 - - 17.8% 17.8% 4,626
Cleveland, OH 34,210,959 - 475,000 18.4% 19.6% (442,193)
Columbus, OH 19,358,350 - 251,000 10.9% 10.6% 48,968
Detroit, MI 26,057,470 - - 20.5% 23.4% (396,830)
Grand Rapids, MI 5,461,588 52,000 - 24.7% 23.9% 44,219
Indianapolis, IN 23,453,317 - - 13.8% 13.8% 8,379
Kansas City, MO 32,238,028 - 215,000 15.1% 15.7% (186,907)
Milwaukee, WI 23,391,878 30,000 - 13.6% 13.4% 79,406
Minneapolis, MN 32,249,757 62,000 - 15.2% 15.0% 43,951
Omaha, NE 6,381,717 - - 5.9% 5.8% 4,210
St. Louis, MO 27,493,907 - - 19.2% 18.7% 134,751
St. Paul, MN 13,636,281 - - 13.8% 13.5% 47,488
Midwest Total 421,347,486 144,000 941,000 15.3% 15.5% (669,502)
WEST
Bakersfield, CA 3,009,769 - - 10.1% 8.6% 44,614
Boise, ID 3,696,563 - 260,000 11.6% 11.4% 5,219
Denver, CO 34,226,903 - 382,000 11.9% 11.0% 290,405
Fresno, CA 3,284,713 - - 12.0% 12.0% 1,470
Honolulu, HI 7,119,083 - - 14.1% 14.5% (26,780)
Las Vegas, NV 4,175,428 - - 13.3% 12.9% 15,638
Los Angeles, CA 31,942,700 - 257,300 17.8% 18.2% (147,900)
Oakland, CA 16,891,513 - - 13.5% 13.5% 5,420
Phoenix, AZ 20,019,837 - - 23.4% 22.2% 95,886
Portland, OR 34,136,998 133,260 - 9.1% 9.7% (76,811)
Reno, NV 3,996,380 - - 14.9% 15.6% (25,428)
Sacramento, CA 18,943,435 - - 9.7% 9.9% (33,183)
San Diego, CA 10,149,972 - - 20.0% 20.5% (41,848)
San Francisco, CA 87,755,078 285,434 1,622,147 12.2% 11.6% 426,066
San Jose/Silicon Valley 7,601,845 - - 24.6% 24.8% (27,569)
Seattle/Puget Sound, WA 56,058,909 163,344 847,981 13.0% 12.3% 508,343
Stockton, CA 8,199,807 - - 19.7% 19.5% 18,163
Walnut Creek/Pleasanton, CA 12,648,620 - - 17.4% 16.7% 85,931
West Total 363,857,553 582,038 3,369,428 13.9% 13.6% 1,117,636
U.S. TOTALS 1,966,590,542 1,360,796 16,343,630 13.8% 13.7% 1,836,811
P. 6 | COLLIERS INTERNATIONAL
7. HIGHLIGHTS | Q2 2012 | OFFICE | NORTH AMERICA
UNITED STATES | DOWNTOWN OFFICE | CLASS A
AVG ANNUAL QUARTERLY ANNUAL
EXISTING VACANCY VACANCY ABSORPTION QUOTED RENT CHANGE IN CHANGE IN
INVENTORY (SF) RATE (%) RATE (%) Q2 2012 (USD) RENT RENT
MARKET JUNE 30, 2012 MAR 31, 2012 JUNE 30, 2012 (SF) JUNE 30, 2012 (%) (%)
NORTHEAST
Baltimore, MD 14,292,134 17.3% 16.3% 144,867 $23.22 -0.5% -4.4%
Boston, MA 41,333,537 15.0% 13.8% 513,092 $45.63 -0.4% 0.1%
Hartford, CT 6,651,365 23.2% 22.4% 50,853 $22.90 0.2% -0.4%
New York, NY – Downtown Manhattan 77,672,777 18.3% 19.3% (751,512) $47.62 -1.4% 26.3%
New York, NY – Midtown Manhattan 192,290,701 12.5% 12.7% (410,780) $70.34 2.5% 9.2%
New York, NY – Midtown South Manhattan 32,865,338 8.1% 8.6% (166,224) $47.26 -4.0% -1.3%
Philadelphia, PA 32,830,457 11.2% 10.7% 176,909 $26.50 0.4% 1.5%
Pittsburgh, PA 17,962,521 8.2% 8.1% 31,074 $22.61 -0.1% 4.2%
Stamford, CT 13,368,368 20.0% 20.6% (71,106) $38.84 -0.4% 3.3%
Washington DC 85,924,922 12.1% 11.9% 443,739 $53.19 0.8% 0.9%
White Plains, NY 4,962,442 17.3% 17.0% 16,016 $32.06 1.4% 6.2%
Northeast Total 520,154,562 13.5% 13.6% (23,072) $53.20 0.9% 7.8%
SOUTH
Atlanta, GA 30,035,271 19.4% 19.1% 101,038 $22.99 0.3% 2.6%
Birmingham, AL 3,212,719 19.0% 10.4% 10,078 $20.92 -0.9% -4.4%
Charleston, SC 1,043,494 5.3% 5.2% 1,080 $30.09 0.4% 3.8%
Charlotte, NC 16,063,309 13.6% 15.5% (284,139) $23.80 1.3% -1.7%
Columbia, SC 1,929,606 13.6% 13.9% (5,957) $19.39 -0.1% -0.6%
Dallas/Fort Worth, TX 28,511,754 21.9% 21.5% 95,749 $25.00 0.0% -1.2%
Ft. Lauderdale-Broward, FL 4,454,238 22.4% 22.7% (15,560) $31.08 -0.9% -2.3%
Houston, TX 26,094,764 11.3% 10.9% 85,266 $36.80 1.0% 7.6%
Jacksonville, FL 6,830,482 19.5% 19.5% - $19.44 0.4% -1.8%
Little Rock, AR 2,636,353 10.2% 9.7% 12,871 $15.59 -0.6% 0.6%
Louisville, KY 10,304,980 11.9% 11.5% 38,350 $19.06 -1.4% -7.1%
Memphis, TN 1,966,542 18.0% 17.9% 2,360 $16.71 -1.2% -0.1%
Miami-Dade, FL 9,388,588 24.6% 22.9% 136,356 $40.23 -0.4% -2.4%
Nashville, TN 3,953,423 21.4% 19.2% 70,572 $21.77 0.0% -1.9%
Oklahoma City, OK 3,828,053 15.9% 15.9% (947) $17.78 4.6% 1.5%
Orlando, FL 5,760,213 15.4% 15.7% (19,241) $24.23 2.2% 1.5%
Raleigh/Durham/Chapel Hill, NC 5,559,971 8.1% 7.8% 165,137 $23.41 -0.2% -0.8%
Savannah, GA 570,394 12.2% 12.9% (4,970) $19.15 0.0% 1.3%
Tampa Bay, FL 4,799,966 15.4% 15.4% 867 $23.15 0.2% 2.5%
West Palm Beach/Palm Beach County, FL 3,316,979 20.9% 21.8% (32,580) $37.25 0.4% 0.1%
South Total 170,261,099 17.0% 16.7% 356,330 $26.26 0.4% 0.6%
COLLIERS INTERNATIONAL | P. 7
8. HIGHLIGHTS | Q2 2012 | OFFICE | NORTH AMERICA
UNITED STATES | DOWNTOWN OFFICE | CLASS A (continued)
AVG ANNUAL QUARTERLY ANNUAL
EXISTING VACANCY VACANCY ABSORPTION QUOTED RENT CHANGE IN CHANGE IN
INVENTORY (SF) RATE (%) RATE (%) Q2 2012 (USD) RENT RENT
MARKET JUNE 30, 2012 MAR 31, 2012 JUNE 30, 2012 (SF) JUNE 30, 2012 (%) (%)
MIDWEST
Chicago, IL 60,767,076 14.8% 15.0% (159,541) $37.35 0.2% -0.7%
Cincinnati, OH 8,815,068 20.1% 19.9% 16,292 $23.22 -0.1% 0.1%
Cleveland, OH 9,728,269 12.1% 13.5% (135,290) $22.00 1.6% 6.3%
Columbus, OH 8,106,210 11.2% 10.6% 48,400 $19.89 1.3% 4.7%
Detroit, MI 9,135,621 19.1% 20.3% (405,742) $23.63 5.0% 4.6%
Grand Rapids, MI 1,542,050 23.6% 22.3% 19,669 $19.33 -7.5% -2.9%
Indianapolis, IN 9,928,804 19.1% 19.2% (2,490) $19.05 -2.7% -2.2%
Kansas City, MO 10,509,523 19.5% 19.2% 31,916 $19.04 -0.2% -1.7%
Milwaukee, WI 5,607,884 12.1% 12.2% (3,259) $19.60 -2.6% -3.4%
Minneapolis, MN 13,618,828 13.0% 12.7% 23,348 $15.25 0.0% 0.0%
Omaha, NE 3,417,878 3.6% 3.5% 924 $19.88 0.1% 5.7%
St. Louis, MO 10,678,000 16.9% 16.7% 30,827 $17.47 -0.3% -2.9%
St. Paul, MN 3,123,449 10.7% 10.5% 23,348 $13.17 0.0% 0.0%
Midwest Total 154,978,660 15.3% 15.3% (511,598) $26.44 0.4% 0.2%
WEST
Bakersfield, CA 669,798 5.0% 4.1% 5,711 $17.40 0.0% 0.0%
Boise, ID 2,056,629 8.2% 7.2% 19,986 $20.71 8.5% 15.1%
Denver, CO 20,967,814 11.4% 10.4% 196,009 $29.56 1.3% 3.3%
Fresno, CA 1,058,046 12.4% 12.4% - $24.00 0.0% -2.4%
Honolulu, HI 4,966,720 14.0% 14.0% 191 $35.16 0.0% -0.7%
Las Vegas, NV 807,588 11.2% 12.0% (6,077) $30.84 0.8% -4.5%
Los Angeles, CA 17,749,600 15.2% 15.8% (107,900) $36.36 -5.3% -5.6%
Oakland, CA 10,198,245 11.7% 10.6% 102,405 $31.80 0.8% 3.6%
Phoenix, AZ 9,459,620 19.6% 19.5% 14,609 $23.70 1.0% -0.8%
Portland, OR 13,205,838 7.9% 9.3% (194,892) $24.74 -1.3% -0.2%
Reno, NV 666,643 19.2% 19.3% (152) $21.73 -1.5% 2.7%
Sacramento, CA 9,062,694 8.7% 8.6% 997 $32.64 1.1% 0.7%
San Diego, CA 7,254,266 17.7% 17.9% (11,541) $28.68 1.7% -0.1%
San Francisco, CA 54,861,223 12.0% 11.8% 507,067 $44.81 3.0% 21.4%
San Jose/Silicon Valley 3,365,127 29.2% 28.9% 8,628 $33.11 4.1% 3.8%
Seattle/Puget Sound, WA 32,284,117 15.5% 14.7% 405,153 $30.63 1.7% 3.1%
Stockton, CA 2,768,532 29.8% 28.4% 27,690 $20.64 1.2% -4.4%
Walnut Creek/Pleasanton, CA 8,233,222 15.2% 15.9% (57,111) $27.60 0.0% 5.3%
West Total 199,635,722 13.6% 13.4% 910,773 $33.97 1.4% 7.7%
US Totals 1,045,030,043 14.4% 14.3% 732,433 $41.17 0.9% 6.1%
P. 8 | COLLIERS INTERNATIONAL
9. HIGHLIGHTS | Q2 2012 | OFFICE | NORTH AMERICA
UNITED STATES | SUBURBAN OFFICE | ALL INVENTORY
EXISTING NEW SUPPLY UNDER VACANCY VACANCY ABSORPTION
INVENTORY (SF) Q2 2012 CONSTRUCTION RATE (%) RATE (%) Q2 2012
MARKET JUNE 30, 2012 (SF) (SF) MAR. 31,2012 JUNE 30, 2012 (SF)
NORTHEAST
Baltimore, MD 78,547,805 289,085 1,316,234 13.5% 13.5% 299,382
Boston, MA 109,446,838 - 827,355 20.5% 19.4% 1,320,634
Fairfield County, CT 41,383,710 - - 11.2% 12.4% (421,934)
Hartford, CT 12,247,885 - - 17.7% 16.4% 166,012
Long Island, NY 71,220,175 - 96,000 10.3% 10.7% (150,367)
New Jersey – Central 103,593,744 - - 16.7% 17.1% (388,823)
New Jersey – Northern 138,217,072 - - 15.5% 15.8% (421,912)
Philadelphia, PA 109,954,115 - 654,000 15.5% 15.0% 558,415
Pittsburgh, PA 93,151,677 33,157 230,075 7.9% 8.0% (36,274)
Washington, DC 276,314,249 - 4,206,751 15.3% 15.2% 265,025
Westchester County, NY 37,924,148 - - 12.8% 13.1% (120,087)
Northeast Total 1,072,001,418 322,242 7,330,415 14.7% 14.6% 1,070,071
SOUTH
Atlanta, GA 171,774,581 353,822 701,126 17.7% 17.5% 627,504
Birmingham, AL 14,294,639 - - 17.0% 17.3% (560)
Charleston, SC 9,379,515 - 75,000 16.2% 15.3% 95,009
Charlotte, NC 74,287,537 43,900 613,282 13.4% 12.8% 461,025
Columbia, SC 5,019,643 - - 25.8% 25.8% 1,431
Dallas/Fort Worth, TX 259,749,915 93,000 1,090,680 15.7% 15.6% 360,231
Ft. Lauderdale-Broward, FL 43,448,799 - - 13.9% 13.7% 76,879
Houston, TX 160,136,268 48,270 2,586,502 14.7% 14.5% 1,274,610
Jacksonville, FL 43,490,399 6,285 35,607 13.8% 13.7% 68,256
Little Rock, AR 7,434,547 1,464 232,000 13.5% 12.4% 91,227
Memphis, TN 26,882,118 - 10,242 14.7% 14.0% 172,803
Miami-Dade, FL 62,809,802 228,185 141,078 14.5% 14.3% 309,120
Nashville, TN 14,399,793 - 223,020 6.1% 5.7% 65,336
Oklahoma City, OK 30,614,338 320,000 - 8.1% 8.9% 56,810
Orlando, FL 56,106,999 151,900 299,710 14.9% 14.9% 132,953
Raleigh/Durham/Chapel Hill, NC 64,743,308 30,000 - 14.7% 14.5% 183,417
Savannah, GA 1,554,208 - - 22.2% 25.0% (43,405)
Tampa Bay, FL 70,756,110 15,302 374,000 16.4% 16.2% 181,149
West Palm Beach/Palm Beach County, FL 28,394,785 - - 20.0% 19.5% 99,723
South Total 1,164,977,000 1,531,000 6,702,000 15.2 15.2 2,266,000
P. 9 | COLLIERS INTERNATIONAL
10. HIGHLIGHTS | Q2 2012 | OFFICE | NORTH AMERICA
UNITED STATES | SUBURBAN OFFICE | ALL INVENTORY (continued)
EXISTING NEW SUPPLY UNDER VACANCY VACANCY ABSORPTION
INVENTORY (SF) Q2 2012 CONSTRUCTION RATE (%) RATE (%) Q2 2012
MARKET JUNE 30, 2012 (SF) (SF) MAR. 31,2012 JUNE 30, 2012 (SF)
MIDWEST
Chicago, IL 155,833,941 416,270 - 17.5% 17.0% 1,045,880
Cincinnati, OH 35,273,149 - 244,798 19.1% 19.8% (212,246)
Cleveland, OH 111,017,484 356,644 1,373,500 10.4% 10.4% (226,573)
Columbus, OH 43,693,312 - 50,000 12.5% 12.6% (16,223)
Detroit, MI 157,945,259 80,000 - 20.5% 18.0% 420,041
Grand Rapids, MI 11,557,283 - 382,000 23.1% 23.3% (25,139)
Indianapolis, IN 45,730,597 - 75,000 14.2% 13.7% 185,760
Kansas City, MO 66,748,058 - 593,740 12.9% 12.4% 322,735
Milwaukee, WI 35,868,780 - - 11.4% 11.4% 13,433
Minneapolis, MN 83,536,011 66,000 726,000 13.9% 13.8% 144,141
Omaha, NE 20,393,779 - 735,748 12.3% 11.8% 54,090
St. Louis, MO 55,244,405 - - 10.8% 11.4% (297,232)
Midwest Total 822,842,058 918,914 4,180,786 14.9% 14.7% 1,408,667
WEST
Bakersfield, CA 5,994,232 18,777 26,000 7.8% 7.0% 65,627
Boise, ID 10,883,269 - - 19.2% 18.9% 34,432
Denver, CO 104,441,042 - 310,000 14.9% 14.5% 492,191
Fairfield, CA 4,872,493 - - 24.4% 25.4% (51,378)
Fresno, CA 17,992,713 12,200 10,000 13.2% 12.7% 96,584
Honolulu, HI 7,507,311 - - 13.1% 12.6% 34,437
Las Vegas, NV 35,137,556 4,500 67,692 26.3% 25.8% 172,737
Los Angeles/Inland Empire, CA 21,626,300 141,100 - 23.3% 22.6% 239,300
Los Angeles, CA 168,490,800 40,800 1,400,500 18.3% 17.9% 562,900
Oakland, CA 16,165,151 99,000 - 18.6% 20.3% (188,285)
Orange County, CA 80,477,400 - 380,000 18.6% 17.7% 608,400
Phoenix, AZ 110,325,647 - 236,210 22.1% 21.7% 33,143
Portland, OR 44,464,386 194,130 293,024 11.9% 12.0% 144,553
Reno, NV 9,373,423 - - 16.5% 16.8% (27,964)
Sacramento, CA 72,773,372 - 452,608 19.5% 19.3% 113,570
San Diego, CA 68,108,125 - - 14.3% 14.1% 122,842
San Francisco Peninsula 35,123,418 - - 12.5% 12.5% 15,236
San Jose/Silicon Valley 54,389,344 306,000 937,087 13.9% 14.2% (90,203)
Seattle/Puget Sound, WA 73,024,157 - 55,000 12.9% 13.0% (23,958)
Walnut Creek/Pleasanton, CA 33,007,299 - - 14.6% 13.8% 195,575
West Total 974,177,438 816,507 4,168,121 17.2% 16.9% 2,549,739
U.S. TOTALS 4,014,298,218 3,349,791 22,061,569 15.5% 15.3% 9,241,995
COLLIERS INTERNATIONAL | P. 10
11. HIGHLIGHTS | Q2 2012 | OFFICE | NORTH AMERICA
UNITED STATES | SUBURBAN OFFICE | CLASS A
AVERAGE ANNUAL QUARTERLY ANNUAL
EXISTING VACANCY VACANCY ABSORPTION QUOTED RENT CHANGE IN CHANGE IN
INVENTORY (SF) RATE (%) RATE (%) Q2 2012 (USD PSF) RENT RENT
MARKET JUNE 30, 2012 MAR. 31, 2012 JUNE 30, 2012 (SF) JUNE 30, 2012 (%) (%)
NORTHEAST
Baltimore, MD 27,953,227 15.4% 15.1% 291,489 $25.48 1.2% 0.7%
Boston, MA 45,953,515 18.2% 17.0% 528,883 $25.92 -0.5% 0.1%
Fairfield County, CT 17,469,135 12.0% 13.0% (183,111) $37.28 -1.5% 7.7%
Hartford, CT 7,865,657 16.2% 16.2% 5,305 $20.66 -0.1% 0.5%
Long Island, NY 23,149,823 11.6% 12.1% (12,424) $30.02 0.0% 0.4%
New Jersey – Central 60,412,122 17.9% 18.2% (111,693) $22.77 -0.8% -1.3%
New Jersey – Northern 84,371,119 14.3% 15.2% (757,427) $23.38 0.0% -2.4%
Philadelphia, PA 67,304,273 14.9% 14.3% 420,912 $24.50 0.7% 1.9%
Pittsburgh, PA 17,409,489 7.6% 7.0% 64,610 $21.64 -4.6% -0.2%
Washington, DC 129,495,191 15.3% 15.0% 402,118 $29.32 0.5% 2.5%
Westchester County, NY 18,286,188 16.4% 16.4% (2,479) $26.94 -0.4% -2.4%
Northeast Total 499,669,739 15.2% 15.1% 646,183 $26.17 -0.1% -0.1%
SOUTH
Atlanta, GA 79,190,873 17.4% 16.8% 715,195 $22.04 -0.1% -1.2%
Birmingham, AL 8,942,736 16.5% 16.0% 48,785 $21.15 -0.3% -0.9%
Charleston, SC 3,942,925 11.5% 11.1% 18,208 $23.09 -0.2% 0.0%
Charlotte, NC 18,617,462 15.6% 14.5% 181,105 $21.64 0.0% 6.5%
Columbia, SC 976,050 12.0% 12.8% (7,283) $16.90 -3.2% 0.5%
Dallas/Fort Worth, TX 92,408,987 17.0% 16.8% 220,220 $25.00 0.0% 1.0%
Ft. Lauderdale-Broward, FL 10,979,840 19.1% 19.1% (15,029) $27.85 0.6% -2.3%
Houston, TX 67,651,729 12.4% 12.3% 924,290 $27.81 -3.6% 4.4%
Jacksonville, FL 9,203,633 10.4% 9.8% 53,250 $19.50 -2.4% -4.3%
Little Rock, AR 2,846,861 19.1% 19.0% 2,137 $19.42 1.5% 5.0%
Memphis, TN 7,975,880 8.6% 7.9% 61,052 $21.60 -0.3% 2.2%
Miami-Dade, FL 15,841,668 20.0% 20.4% 173,370 $30.55 -3.0% -3.7%
Nashville, TN 7,016,156 4.7% 3.9% 51,084 $22.78 0.9% 0.9%
Oklahoma City, OK 3,234,116 10.1% 16.6% 78,469 $19.87 -0.1% -1.5%
Orlando, FL 17,059,754 19.1% 20.3% (75,804) $21.81 -0.8% -1.8%
Raleigh/Durham/Chapel Hill, NC 24,530,392 15.9% 15.0% 229,879 $20.85 -1.0% -0.9%
Savannah, GA 490,035 22.6% 30.4% (52,452) $22.66 0.2% 1.6%
Tampa Bay, FL 23,403,801 17.5% 16.2% 306,774 $22.90 -0.7% -0.7%
West Palm Beach/Palm Beach 9,169,027 19.1% 19.0% 12,427 $30.07 -0.2% -0.1%
County, FL
South Total 403,481,925 15.9% 15.6% 2,925,677 $24.20 -1.0% 0.6%
P. 11 | COLLIERS INTERNATIONAL
12. HIGHLIGHTS | Q2 2012 | OFFICE | NORTH AMERICA
UNITED STATES | SUBURBAN OFFICE | CLASS A
AVERAGE ANNUAL QUARTERLY ANNUAL
EXISTING VACANCY VACANCY ABSORPTION QUOTED RENT CHANGE IN CHANGE IN
INVENTORY (SF) RATE (%) RATE (%) Q2 2012 (USD PSF) RENT RENT
MARKET JUNE 30, 2012 MAR. 31, 2012 JUNE 30, 2012 (SF) JUNE 30, 2012 (%) (%)
MIDWEST
Chicago, IL 76,336,349 18.3% 17.8% 727,251 $27.14 -0.6% 0.5%
Cincinnati, OH 15,073,115 19.2% 20.6% (165,810) $20.41 0.2% -4.9%
Cleveland, OH 13,200,373 10.5% 10.1% 290,381 $21.62 1.8% 0.4%
Columbus, OH 17,976,571 10.7% 11.1% (61,912) $18.55 1.3% 1.3%
Detroit, MI 28,465,645 19.1% 17.3% 223,916 $20.64 -3.2% -4.8%
Grand Rapids, MI 2,206,876 28.4% 28.1% (2,500) $19.31 -0.1% 0.5%
Indianapolis, IN 12,403,471 18.5% 18.1% 44,819 $18.27 0.9% -1.4%
Kansas City, MO 15,592,617 13.6% 11.8% 272,716 $20.61 -0.8% -0.5%
Milwaukee, WI 6,515,804 10.0% 10.0% 5,294 $20.28 0.0% 0.5%
Minneapolis, MN 25,658,170 15.5% 15.2% 100,892 $13.26 0.0% 0.0%
Omaha, NE 4,297,123 5.3% 4.9% 18,544 $25.82 0.3% 0.0%
St. Louis, MO 25,996,388 10.0% 10.7% (172,664) $21.94 -0.3% -1.1%
Midwest Total 243,722,502 15.6% 15.3% 1,280,927 $21.87 -0.4% -2.3%
WEST
Bakersfield, CA 2,697,867 4.8% 4.8% (341) $24.00 0.0% 0.0%
Boise, ID 4,636,294 21.2% 21.0% 6,455 $17.15 0.3% -4.7%
Denver, CO 34,040,026 12.7% 12.2% 170,896 $23.33 2.4% 4.9%
Fairfield, CA 1,917,086 22.7% 26.0% (64,078) $25.55 -2.0% 1.9%
Fresno, CA 3,943,106 20.2% 18.7% 58,436 $25.20 0.0% 0.0%
Las Vegas, NV 5,078,624 35.0% 34.8% 7,998 $29.16 -0.7% -5.0%
Los Angeles/Inland Empire, CA 5,194,800 27.2% 28.3% 41,200 $23.16 0.5% -1.0%
Los Angeles, CA 102,115,100 18.1% 17.7% 322,300 $32.52 -2.9% -4.9%
Oakland, CA 3,870,228 22.7% 27.0% (87,689) $27.72 5.5% 5.0%
Orange County, CA 32,834,800 20.2% 19.1% 358,500 $25.68 -0.5% -0.5%
Phoenix, AZ 30,236,439 24.7% 23.9% 30,814 $22.65 -1.0% -4.4%
Portland, OR 10,982,963 14.5% 13.6% 219,363 $21.63 0.0% -8.6%
Reno, NV 917,122 18.5% 17.0% 14,003 $18.31 -0.5% -1.9%
Sacramento, CA 16,049,530 23.5% 22.8% 104,057 $22.44 0.3% -3.4%
San Diego, CA 23,725,293 12.4% 11.7% 125,951 $32.40 2.3% 4.2%
San Francisco Peninsula 22,262,248 11.5% 11.3% 48,157 $41.76 -0.3% 20.0%
San Jose/Silicon Valley 26,701,508 14.3% 15.3% (37,314) $39.84 7.8% 13.3%
Seattle/Puget Sound, WA 26,835,320 14.8% 15.4% (14,070) $31.91 1.4% 19.3%
Walnut Creek/Pleasanton, CA 15,979,480 12.8% 11.5% 202,214 $24.36 2.5% -5.1%
West Total 370,017,834 17.3% 17.0% 1,506,852 $29.55 0.3% 2.0%
U.S. TOTALS 1,516,892,000 16.0% 15.7% 6,359,639 $25.78 -0.3% 0.2%
COLLIERS INTERNATIONAL | P. 12
13. HIGHLIGHTS | Q2 2012 | OFFICE | NORTH AMERICA
CANADA | DOWNTOWN OFFICE | ALL INVENTORY
EXISTING NEW SUPPLY UNDER VACANCY VACANCY ABSORPTION
INVENTORY (SF) Q2 2012 CONSTRUCTION RATE (%) RATE (%) Q2 2012
MARKET JUNE 30, 2012 (SF) SF MAR. 31, 2012 JUNE 30, 2012 (SF)
Calgary, AB 38,597,994 - 2,631,000 4.2% 3.5% 279,455
Edmonton, AB 11,260,840 - - 10.7% 8.9% 204,611
Guelph, ON 383,244 - 11,714 10.8% 11.3% (1,858)
Halifax, NS 4,695,722 3,165 100,000 13.2% 13.0% 11,694
Montréal, QC 49,428,581 - 304,000 5.4% 5.6% (44,978)
Ottawa, ON 15,526,942 - 360,000 6.2% 6.2% 679
Regina, SK 3,462,435 - 332,000 1.7% 1.5% 8,815
Saskatoon, SK 2,155,665 - 230,000 1.8% 1.9% 4,000
Toronto, ON 69,506,163 - 2,452,500 5.4% 5.5% 1,853
Vancouver, BC 24,408,488 24,676 1,249,310 3.8% 3.5% 88,994
Victoria, BC* 4,952,849 - - 7.7% 7.8% (4,496)
Waterloo Region, ON 3,770,922 147,850 44,075 11.5% 15.0% (1,845)
Canada Total 228,149,845 175,691 7,714,599 5.6% 5.5% 546,924
CANADA | DOWNTOWN OFFICE | CLASS A
VACANCY VACANCY AVG ANNUAL QUARTERLY ANNUAL
EXISTING RATE (%) RATE (%) ABSORPTION QUOTED RENT CHANGE CHANGE
INVENTORY (SF) MAR. 31, JUNE 30, Q2 2012 (CAD PSF) IN RENT IN RENT
MARKET JUNE 30, 2012 2012 2012 (SF) JUNE 30, 2012 (%) (%)
Calgary, AB 25,757,389 1.9% 1.4% 127,605 $62.00 6.9% 29.2%
Edmonton, AB 9,074,913 8.7% 8.5% 213,784 $41.44 0.0% 5.7%
Guelph, ON 202,846 0.0% 0.0% - $23.10 0.0% -11.2%
Halifax, NS 1,933,746 10.3% 9.2% 20,089 $32.36 0.0% -0.1%
Montréal, QC 23,075,596 5.1% 5.1% 7,341 $42.00 0.0% 10.5%
Ottawa, ON 9,535,830 5.8% 5.3% 56,689 $49.30 1.9% 1.4%
Regina, SK 874,911 1.9% 1.0% 8,054 $40.40 3.9% 8.9%
Saskatoon, SK 491,596 0.9% 1.0% (420) $38.00 2.7% 11.8%
Toronto, ON 37,306,612 5.5% 5.7% (94,949) $53.44 -0.4% 2.0%
Vancouver, BC 10,029,234 2.4% 2.0% 73,792 $55.00 0.0% 2.2%
Victoria, BC* 820,748 7.5% 9.4% (16,041) $36.00 -4.7% -4.8%
Waterloo Region, ON 1,559,429 4.7% 13.2% (7,492) $25.28 -2.5% -1.8%
Canada Total 120,662,850 4.7% 4.7% 388,452 $50.95 1.6% 9.5%
* Victoria, BC, year end is Q3
P. 13 | COLLIERS INTERNATIONAL
14. HIGHLIGHTS | Q2 2012 | OFFICE | NORTH AMERICA
CANADA | SUBURBAN OFFICE | ALL INVENTORY
EXISTING NEW SUPPLY UNDER VACANCY VACANCY ABSORPTION
INVENTORY (SF) Q2 2012 CONSTRUCTION RATE (%) RATE (%) Q2 2012
MARKET JUNE, 2012 (SF) (SF) MAR. 31, 2012 JUNE 30, 2012 (SF)
Calgary, AB 24,048,632 160,968 1,214,280 8.3% 8.5% 78,471
Edmonton, AB 8,993,180 - 278,884 11.9% 11.8% 10,454
Guelph, ON 1,383,251 - - 4.7% 4.6% 1,633
Halifax, NS 6,757,789 89,690 73,500 11.9% 13.2% 28,813
Montréal, QC 23,699,550 - 298,304 8.6% 8.5% 33,385
Ottawa, ON 21,008,158 - 122,450 8.5% 8.6% (16,740)
Regina, SK 720,541 - 40,000 0.1% 0.6% (3,620)
Vancouver, BC 27,677,931 - 1,346,142 11.2% 11.2% (38,124)
Victoria, BC* 3,620,978 28,000 83,000 9.1% 8.5% 45,098
Waterloo Region, ON 7,121,961 79,305 144,793 11.4% 11.3% 79,780
Toronto, ON 68,464,517 180,359 842,810 9.1% 9.6% (143,285)
CANADA TOTALS 193,496,488 538,322 4,444,163 9.4% 9.7% 75,865
CANADA | SUBURBAN OFFICE | CLASS A
VACANCY VACANCY AVG ANNUAL QUARTERLY ANNUAL
EXISTING RATE (%) RATE (%) ABSORPTION QUOTED RENT CHANGE CHANGE
INVENTORY (SF) MAR. 31, JUNE 30, Q2 2012 (CAD PSF) IN RENT IN RENT
MARKET JUNE 30, 2012 2012 2012 (SF) JUNE 30, 2012 (%) (%)
Calgary, AB 11,220,334 6.7% 5.9% 235,576 $43.00 2.4% 13.2%
Guelph, ON 847,518 4.0% 3.8% 1,633 $26.45 1.9% 8.8%
Halifax, NS 2,905,780 9.2% 13.1% (89,665) $29.23 -0.8% 4.4%
Montréal, QC 13,336,192 7.1% 6.9% 34,538 $27.00 -3.6% -10.0%
Ottawa, ON 11,944,116 8.6% 8.2% 54,570 $31.46 0.6% 5.0%
Regina, SK 448,343 0.0% 0.0% - $28.50 0.0% 0.0%
Vancouver, BC 13,426,379 12.2% 11.1% 123,833 $36.25 0.0% -5.2%
Victoria, BC* 817,488 8.7% 8.4% 2,191 $36.00 -10.0% -10.0%
Waterloo Region, ON 3,405,714 15.3% 14.5% 93,405 $24.29 0.5% 11.0%
Toronto, ON 30,892,647 9.6% 10.6% (135,837) $30.82 1.4% 1.1%
CANADA TOTALS 89,244,511 9.4% 9.7% 320,244 $32.38 0.4% 0.7%
* Victoria, BC, year end is Q3
CANADIAN OFFICE UNDER CONSTRUCTION BY Q2–2012 (MILLIONS SF) CANADIAN OFFICE ABSORPTION BY MARKET Q2–2012 (1000S SF)
Calgary, AB 2.63 Calgary, AB 279.5
Toronto, ON 2.45 Edmonton, AB 204.6
1.25 Vancouver, BC 89.0
Vancouver, BC
Halifax, NS 11.7
Ottawa, ON 0.36
Regina, SK 8.8
Regina, SK 0.33
Saskatoon, SK 4.0
Montréal, QC 0.30
Toronto, ON 1.9
Saskatoon, SK 0.23
Ottawa, ON 0.7
Halifax, NS 0.10
Waterloo Region, ON -1.8
Waterloo Region, ON 0.04
Guelph, ON -1.9
Guelph, ON 0.01
Victoria, BC -4.5
Victoria, BC 0.00
Montréal, QC -45.0
Edmonton, AB 0.00
-100.0 -50.0 0.0 50.0 100.0 150.0 200.0 250.0 300.0
0.0 0.5 1.0 1.5 2.0 2.5 3.0
Millions Thousands
COLLIERS INTERNATIONAL | P. 14
15. HIGHLIGHTS | Q2 2012 | OFFICE | NORTH AMERICA
UNITED STATES | OFFICE INVESTMENT
CBD SUBURBAN SALES SUBURBAN
CBD SALES PRICE CAP RATE PRICE CAP RATE
MARKET (USD PSF) (%) (USD PSF) (%)
Atlanta, GA $135.00 7.80 $120.00 9.20
Baltimore, MD $80.77 8.50
Boston, MA $249.00 6.00 $194.50 7.13
Charleston, SC $250.00 8.00 $135.00 11.00
Chicago, IL $350.00 6.50 $225.00 7.25
Cincinnati, OH $125.00 9.75 $137.50 9.50
Columbus, OH 8.80
Dallas/Fort Worth, TX $115.00 8.00
Denver, CO $189.00 6.50 $159.00 7.10
Detroit, MI $84.23 12.00 $28.67 12.86
Fairfield County, CT $190.00 7.30
Fresno, CA $125.00 9.00 $175.00 8.50
Ft. Lauderdale-Broward, FL $71.96
Grand Rapids, MI $123.50 9.25 $115.00 8.75
Hartford, CT $36.08 11.00
Houston, TX $140.00 6.80
Indianapolis, IN $176.00 8.00 $160.00 8.00
Las Vegas, NV $23.36 $57.98
Little Rock, AR $88.00 9.50 $110.00 9.25
Long Island, NY $191.88 7.84
Los Angeles – Inland Empire, CA $175.00 8.00
Los Angeles, CA $230.00 6.90 $210.00 8.80
Memphis, TN $54.10
Miami-Dade, FL $331.00 $205.00 8.65
Minneapolis, MN $66.50
Nashville, TN $115.00 6.50 $230.00 6.80
New Jersey – Central $106.61 6.90
New Jersey – Northern $75.89 6.56
New York, NY – Downtown Manhattan $281.00 5.00
New York, NY – Midtown Manhattan $741.00 4.70
New York, NY – Midtown South Manhattan $570.00 4.90
Oakland, CA 7.50 $111.69 8.50
Orange County, CA $325.00 6.50
Orlando, FL $170.00 8.50 $165.00 7.50
Philadelphia, PA $135.00 8.00 $162.00 8.00
Phoenix, AZ $78.00 7.80
Pittsburgh, PA $120.00 8.26 $110.00 8.25
Portland, OR $107.11
Sacramento, CA $80.42 $79.65
San Diego, CA $113.27
San Francisco Peninsula $250.00 7.00
San Francisco, CA $586.75 5.60
San Jose/Silicon Valley $350.00 6.00
COLLIERS INTERNATIONAL | P. 15