

Recomendados
Recomendados
Mais conteúdo relacionado
Mais procurados
Mais procurados (8)
Semelhante a Houston Office Market Report 1Q-2011
Semelhante a Houston Office Market Report 1Q-2011 (20)
Mais de Coy Davidson
Mais de Coy Davidson (20)
Último
Último (20)
Houston Office Market Report 1Q-2011
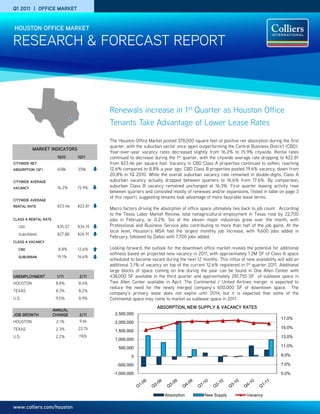
- 1. Q1 2011 | OFFICE MARKET HOUSTON OFFICE MARKET RESEARCH & FORECAST REPORT Renewals increase in 1st Quarter as Houston Office Tenants Take Advantage of Lower Lease Rates The Houston Office Market posted 378,000 square feet of positive net absorption during the first quarter, with the suburban sector once again outperforming the Central Business District (CBD). MARKET INDICATORS Year-over-year vacancy rates decreased slightly from 16.2% to 15.9% citywide. Rental rates 1Q10 1Q11 continued to decrease during the 1st quarter, with the citywide average rate dropping to $22.81 CITYWIDE NET from $23.46 per square foot. Vacancy in CBD Class A properties continued to soften, reaching ABSORPTION (SF) 408k 378k 12.6% compared to 8.8% a year ago. CBD Class B properties posted 19.6% vacancy, down from 20.8% in 1Q 2010. While the overall suburban vacancy rate remained in double-digits, Class A CITYWIDE AVERAGE suburban vacancy actually dropped between quarters to 16.6% from 17.6%. By comparison, VACANCY 16.2% 15.9% suburban Class B vacancy remained unchanged at 16.3%. First quarter leasing activity rose between quarters and consisted mostly of renewals and/or expansions, (listed in table on page 3 of this report), suggesting tenants took advantage of more favorable lease terms. CITYWIDE AVERAGE RENTAL RATE $23.46 $22.81 Macro factors driving the absorption of office space ultimately ties back to job count. According to the Texas Labor Market Review, total nonagricultural employment in Texas rose by 22,700 CLASS A RENTAL RATE jobs in February, or 0.2%. Six of the eleven major industries grew over the month, with CBD $35.57 $34.19 Professional and Business Service jobs contributing to more than half of the job gains. At the local level, Houston’s MSA had the largest monthly job increase, with 9,600 jobs added in SUBURBAN $27.88 $26.91 February, followed by Dallas with 7,700 jobs added. CLASS A VACANCY CBD 8.8% 12.6% Looking forward, the outlook for the downtown office market reveals the potential for additional softness based on projected new vacancy in 2011, with approximately 1.2M SF of Class A space SUBURBAN 19.1% 16.6% scheduled to become vacant during the next 12 months. This influx of new availability will add an additional 3.1% of vacancy on top of the current 12.6% registered in 1st quarter 2011. Additional large blocks of space coming on line during the year can be found in One Allen Center with UNEMPLOYMENT 1/11 2/11 438,000 SF available in the third quarter and approximately 281,755 SF of sublease space in HOUSTON 8.8% 8.4% Two Allen Center available in April. The Continental / United Airlines merger is expected to reduce the need for the newly merged company’s 650,000 SF of downtown space. The TEXAS 8.3% 8.2% company’s primary lease does not expire until 2014, but it is expected that some of the U.S. 9.0% 8.9% Continental space may come to market as sublease space in 2011. ABSORPTION, NEW SUPPLY & VACANCY RATES ANNUAL JOB GROWTH CHANGE 2/11 2,500,000 17.0% HOUSTON 2.1% 9.6k 2,000,000 TEXAS 2.3% 22.7k 15.0% 1,500,000 U.S. 2.2% 192k 13.0% 1,000,000 500,000 11.0% 0 9.0% -500,000 7.0% -1,000,000 5.0% Absorption New Supply Vacancy www.colliers.com/houston
- 2. RESEARCH & FORECAST REPORT | Q1 2011 | HOUSTON OFFICE MARKET VACANCY & AVAILABILITY ABSORPTION & DEMAND CBD VS. SUBURBAN Overall vacancy levels were down for suburban Houston recorded positive net absorption of properties and up for CBD properties. 378,216 SF in the first quarter, compared to CLASS A OFFICE VACANCY Houston’s citywide office vacancy for all 408,209 SF positive net absorption at the same 20.0% property classes averaged 15.9% in the first time last year. Contributing to the quarters 18.0% quarter, compared to 16.2% this time last year. positive gain was Suburban Class A space with 16.0% Vacancy in CBD Class A properties continued positive net absorption of 537,689 SF, followed 14.0% 12.0% to soften reaching 12.6% compared to 8.8% a by CBD Class B space with positive net 10.0% year ago. CBD Class B properties posted 19.6% absorption at 34,868 SF. Suburban Class B 8.0% vacancy, down from 20.8% 12 months earlier. space had the largest amount of negative 6.0% absorption in 1st quarter 2011 with 127,662 SF 4.0% While the overall suburban vacancy rate of negative net absorption followed by CBD remained in double-digits, Class A suburban Class A space with 33,540 SF of negative net vacancy actually dropped between quarters to absorption. 16.6% from 17.6%. By comparison, suburban CBD VACANCY SUBURBAN VACANCY Class B vacancy remained unchanged at 16.3%. Prevailing economic uncertainty is likely to negatively impact CBD absorption levels Citywide, a total of 52 office properties had a throughout 2011. minimum of 100,000 SF available for lease in both direct and sublease space—25 of those RENTAL RATES CLASS A OFFICE RENTS properties have over 200,000 SF available—at Citywide rental rates continued to decline $40.00 the end of the first quarter. during the 1st quarter. $38.00 $36.00 Sublease space totaled 3.1 million SF, including On a year-over-year basis, CBD Class A $34.00 1.2 million SF of vacant space and 1.3 million SF average quoted rental rates dropped by 4.0% to $32.00 of subleases available for occupancy over the $34.19/SF (from $35.57), while suburban Class $30.00 next 12 months. The largest sublease space A rates decreased 3.6% to $26.91/SF (from $28.00 being marketed is Devon Energy’s space, $27.88). CBD Class B rates dropped by 2.3% $26.00 282,000 SF in Two Allen Center and 121,000 to $23.22/SF (from $23.76), while suburban SF in Three Allen Center (available for Class B rates fell 1.9% to $17.80/SF on a full- occupancy 4/2011) in the CBD. In Greenway, 5 service basis. Until demand outpaces supply, Greenway Plaza has the largest suburban the current tenant-friendly market is expected CBD RENTS SUBURBAN RENTS contiguous block of sublease space available, to continue. 82,300 SF. QUOTED GROSS RENTAL RATES FOR TOP PERFORMING OFFICE BUILDINGS YEAR AVAIL. RENT BUILDING NAME ADDRESS SUBMARKET RBA (SF) LEASED OWNER BUILT SF ($/SF) Wells Fargo Plaza 1000 Louisiana CBD 1,721,242 1982 94.7% 192,584 $39.10 Metropolitan Life Insurance Co. Heritage Plaza 1111 Bagby CBD 1,089,266 1986 89.8% 175,590 $40.50 Goddard Investment Group 1100 Louisiana 1100 Louisiana CBD 1,265,332 1980 99.7% 147,587 $39.74 Enterprise Products Partners CityCentre One 800 Town & Country Blvd Energy Corridor 101,300 2008 85.2% 15,000 $40.00 Midway Companies One Eldridge Place 777 N. Eldridge Pkwy. Energy Corridor 239,417 1985/2001 91.4% 61,022 $29.34 Behringer Harvard Minute Maid Building 2150 Town Square Place E. Fort Bend 185,000 2008 76.2% 44,109 $30.00 Planned Community Developers Wells Fargo Bank Tower 1300 Post Oak Blvd. Galleria 491,254 1983 98.1% 24,139 $33.51 TIAA-CREF Williams Tower 2800 Post Oak Blvd Galleria 1,476,973 1983 89.9% 380,024 $37.69 Hines REIT 11 Greenway Plaza 11 Greenway Greenway 745,956 1978 97.7% 147,096 $29.15 Crescent Real Estate Equities One BriarLake Plaza 2000 W. Sam Houston Westchase 550,000 2000 100% 12,042 $38.63 Behringer Harvard Waterway Plaza I 10003 Woodloch Forest Woodlands 223,483 2000 94.0% 18,354 $34.00 W.P. Carey & Co. LLC Waterway Square 4 Waterway Ave. Woodlands 232,364 2009 48.1% 120,544 $35.50 The Woodlands Development Source: CoStar Property COLLIERS INTERNATIONAL | P. 2
- 3. RESEARCH & FORECAST REPORT | Q1 2011 | HOUSTON OFFICE MARKET SALES ACTIVITY LEASING ACTIVITY Houston’s Office Investment sales Houston’s office leasing activity activity slowed in 1Q 2011 with only 13 reached 2.0 million SF in the first properties changing hands in the first quarter, compared to 4.4 million SF in quarter. According to CoStar, 13 office the same quarter last year. Leasing HOUSTON OFFICE SUBMARKETS sale transactions had a total dollar activity is still below levels prior to the volume of $359 million, averaging economic downturn, and an increasing $164/SF with a 8.0% capitalization number of office tenants are renewing rate. lease commitments with better Among the most significant concession packages or relocating to transactions closed in the first quarter buildings/submarkets offering more were: attractive terms. Unilev Capital Corporations’ acquisition All but three of the more significant of a 4.2M square foot, 3 property office leases signed during the first portfolio from Walton Street Capital for quarter were renewals and/or $176 million ($162/SF) in the West expansions. The most significant new Loop/Galleria submarket. The office lease signed in the first quarter buildings were built between 1969 and was Newfield Exploration’s lease of 4 1977, and at the time of sale were floors in Waterway Square in the between 79.8% and 98.6% leased. Woodlands submarket, followed by Lloyd’s Register’s 75,000 SF KBS REIT II, Inc. acquired the 388,142 transaction in 1330 Enclave Parkway square foot Two WestLake Park office in the Katy Freeway submarket. The building in the Katy Freeway tenant will be moving from another submarket from Younan Properties, Katy Freeway building, 1401 Enclave Inc. for $81 million ($209/SF). Parkway, in August 2011. SIGNIFICANT SALES TRANSACTIONS CLOSED IN THE Q1 2011 RBA YEAR BUILDING NAME SUBMARKET BUYER SELLER SALE PRICE $/SF CLOSED (SF) BUILT Galleria Tower I West Loop/Galleria 494,065 1969 Unilev Capital Corp Walton Street Capital $176.0M $162 2/2011 Galleria Tower II West Loop/Galleria 344,185 1974 Unilev Capital Corp Walton Street Capital $176.0M $162 2/2011 Galleria Financial Center West Loop/Galleria 251,204 1977 Unilev Capital Corp Walton Street Capital $176.0M $162 2/2011 Two WestLake Park Katy Freeway 388,142 1982 KBS REIT II, Inc. Younan Properties, Inc. $81.0M $209 2/2011 Ten West Corporate Center II Katy Freeway 250,260 2006 ING Clarion Partners, LLC The Opus Group $45.0M $180 1/2011 Westway One Northwest Far 143,961 2007 Wells Core REIT Behringer Harvard $31.0M $215 1/20011 Emerson Process Oak Park Office Center IV Westchase 158,200 2008 TA Associates Realty $15.8M $100 1/2011 Management Q1 2011 TOP OFFICE LEASES BUILDING NAME/ADDRESS SUBMARKET SF TENANT LEASE DATE Fulbright Tower CBD 229,676 Fulbright & Jaworski* 1/2011 1325 Dairy Ashford Katy Freeway West 155,324 Schlumberger* 02/2011 Galleria Plaza I West Loop/Galleria 120,458 Telecheck Services* 2/2011 Waterway Square Woodlands 103,200 Newfield Exploration 3/2011 12 Greenway Plaza Greenway Plaza 93,594 Direct Energy* 3/2011 Five Post Oak Park Post Oak Park 87,212 Willbros United States Holdings, Inc.* 3/2011 5 Greenway Plaza Greenway Plaza 81,565 Occidental Oil & Gas Corporation* 1/2011 One Westchase Center Westchase 80,033 EDG* 1/2011 1330 Enclave Parkway Katy Freeway West 75,000 Lloyd’s Register 3/2011 America Tower Allen Parkway 70,000 BBS Technologies** 2/2011 Offices at Park 10 Katy Freeway West 68,205 MODEC International, Inc. 1/2011 First City Tower CBD 68,201 Black Stone Minerals* 1/2011 *Renewal and/or Expansion ** Sublease COLLIERS INTERNATIONAL | P. 3
- 4. RESEARCH & FORECAST REPORT | Q1 2011 | HOUSTON OFFICE MARKET HOUSTON OFFICE MARKET SUMMARY (CBD, SUBURBAN & CITYWIDE) DIRECT INVENTORY SUBLEASE VACANCY VACANCY VACANCY RATE (%) NET ABSORPTION (SF) RENTAL RATE VACANCY Class # of Bldgs. Total (SF) (SF) Rate (%) (SF) Rate (%) Total (SF) Q1-2011 Q4-2010 Q1-2011 4Q-2010 Avg. ($/SF) CBD A 27 26,813,571 2,819,784 10.5% 569,024 2.1% 3,388,808 12.6% 10.4% -33,540 -123,616 $34.19 B 30 9,427,427 1,827,897 19.4% 21,396 0.2% 1,849,293 19.6% 21.5% 34,868 6,997 $23.22 C 20 1,424,793 786,772 55.2% 0 0.0% 786,772 55.2% 54.5% -14,543 9,718 $17.78 Total 77 37,665,791 5,434,453 14.4% 590,420 1.6% 6,024,873 16.0% 14.9% -13,215 -106,901 $30.01 SUBURBAN A 270 69,828,480 11,155,782 16.0% 438,396 0.6% 11,594,178 16.6% 17.6% 537,689 664,035 $26.91 B 886 69,821,659 10,816,109 15.5% 534,140 0.8% 11,350,249 16.3% 16.3% -127,662 13,598 $17.80 C 449 18,981,672 2,134,587 11.2% 25,587 0.1% 2,160,174 11.4% 11.2% -18,596 54,676 $14.73 Total 1605 158,631,811 24,106,478 15.2% 998,123 0.6% 25,104,601 15.8% 16.2% 391,431 732,309 $21.53 OVERALL A 297 96,642,051 13,975,566 14.5% 1,007,420 1.0% 14,982,986 15.5% 15.6% 504,149 540,419 $28.42 B 916 79,249,086 12,644,006 16.0% 555,536 0.7% 13,199,542 16.7% 16.9% -92,794 20,595 $18.44 C 469 20,406,465 2,921,359 14.3% 25,587 0.1% 2,946,946 14.4% 14.2% -33,139 64,394 $15.05 Total 1682 196,297,602 29,540,931 15.0% 1,588,543 0.8% 31,129,474 15.9% 16.0% 378,216 625,408 $22.81 HOUSTON SUBURBAN OFFICE MARKET SUMMARY INVENTORY DIRECT VACANCY SUBLEASE VACANCY VACANCY VACANCY RATE (%) NET ABSORPTION (SF) RENTAL RATE Class # of Bldgs. Total (SF) (SF) Rate (%) (SF) Rate (%) Total (SF) Q1-2011 Q4-2010 Q1-2011 Q4-2010 Avg. ($/SF) Allen Parkway A 4 1,264,970 226,326 17.9% 4,956 0.4% 231,282 18.3% 25.7% 33,253 19,900 $26.80 B 30 3,083,459 202,528 6.6% 1,402 0.0% 203,930 6.6% 7.2% 28,658 -759 $22.69 C 26 1,163,150 412,036 35.4% 0 0.0% 412,036 35.4% 37.6% 14,693 2,934 $19.75 Total 60 5,511,579 840,890 15.3% 6,358 0.1% 847,248 15.4% 17.8% 76,604 22,075 $24.72 Baytown B 5 525,544 6,802 1.3% 0 0.0% 6,802 1.3% 1.3% 0 -2,202 $14.67 C 2 60,396 1,563 2.6% 0 0.0% 1,563 2.6% 4.3% 1040 0 $16.25 Total 7 585,940 8,365 1.4% 0 0.0% 8,365 1.4% 1.6% 1,040 -2,202 $14.90 Bellaire A 10 1,389,252 124,121 8.9% 30,938 2.2% 155,059 11.2% 10.2% -13,138 1,137 $22.91 B 9 1,372,083 172,310 12.6% 0 0.0% 172,310 12.6% 5.2% 5,038 -5,439 $19.65 C 7 545,303 36,662 6.7% 10454 1.9% 47,116 8.6% 7.5% -6,016 6,492 $15.01 Total 26 3,306,638 333,093 10.1% 41,392 1.3% 374,485 11.3% 8.1% -14,116 2,190 $20.61 Conroe A 1 60,000 0 0.0% 0 0.0% 0 0.0% 0.0% 0 0 - B 6 244,782 15,799 6.5% 0 0.0% 15,799 6.5% 8.0% 3,784 -2,426 $15.30 C 5 302,939 0 0.0% 0 0.0% 0 0.0% 0.0% 0 4,275 $15.00 Total 12 607,721 15,799 2.6% 0 0.0% 15,799 2.6% 3.2% 3,784 1,849 $15.26 E. Fort Bend A 19 3,534,828 962,330 27.2% 12,199 0.3% 974,529 27.6% 28.5% -2,219 42,581 $27.43 B 35 1,910,108 198,033 10.4% 1,443 0.1% 199,476 10.4% 10.5% -11,174 29,096 $18.61 C 4 142,013 2,413 1.7% 0 0.0% 2,413 1.7% 2.3% 842 -435 $17.50 Total 58 5,586,949 1,162,776 20.8% 13,642 0.2% 1,176,418 21.1% 21.7% -12,551 71,242 $24.23 COLLIERS INTERNATIONAL | P. 4
- 5. RESEARCH & FORECAST REPORT | Q1 2011 | HOUSTON OFFICE MARKET HOUSTON SUBURBAN OFFICE MARKET SUMMARY FM 1960 A 12 2,272,892 1,148,717 50.5% 9,474 0.4% 1,158,191 51.0% 50.3% -15,081 -30,324 $26.64 B 85 4,694,668 966,515 20.6% 81,803 1.7% 1,048,318 22.3% 22.0% -17,233 25,440 $15.02 C 22 818,880 73,890 9.0% 2,463 0.3% 76,353 9.3% 8.3% -8,384 -2,728 $14.11 Total 119 7,786,440 2,189,122 28.1% 93,740 1.2% 2,282,862 29.3% 28.8% -40,698 -7,612 $18.81 Greenway A 16 6,167,603 920,442 14.9% 113,293 1.8% 1,033,735 16.8% 15.5% -52,232 68,347 $27.53 B 26 2,573,851 273,508 10.6% 8,034 0.3% 281,542 10.9% 10.2% -18,655 -1,305 $21.36 C 21 873,877 260,233 29.8% 0 0.0% 260,233 29.8% 28.0% -15419 150 $17.03 Total 63 9,615,331 1,454,183 15.1% 121,327 1.3% 1,575,510 16.4% 15.2% -86,306 67,192 $25.01 Gulf Freeway/Pasadena A 2 75,066 20,349 27.1% 6,273 8.4% 26,622 35.5% 37.9% 1,834 1,231 $27.77 B 29 1,709,060 177,110 10.4% 13,740 0.8% 190,850 11.2% 11.4% 5,487 11,306 $18.98 C 27 1,121,270 101,593 9.1% 3,590 0.3% 105,183 9.4% 8.4% -11,517 10,141 $14.95 Total 58 2,905,396 299,052 10.3% 23,603 0.8% 322,655 11.1% 10.9% -4,196 22,678 $18.72 I-10 East B 4 274,672 65,780 23.9% 9,260 3.4% 75,040 27.3% 27.4% 194 13,157 $13.77 C 5 157,955 0 0.0% 0 0.0% 0 0.0% 4.1% 6,536 0 $12.00 Total 9 432,627 65,780 15.2% 9,260 2.1% 75,040 17.3% 18.9% 6,730 13,157 $13.75 Katy Freeway A 44 11,409,221 2,107,656 18.5% 9,649 0.1% 2,117,305 18.6% 21.4% 284,723 105,857 $27.66 B 86 7,149,406 921,922 12.9% 65,419 0.9% 987,341 13.8% 13.1% -39,566 -16,127 $18.20 C 39 1,789,421 169,164 9.5% 0 0.0% 169,164 9.5% 9.5% -2,287 19,578 $14.87 Total 169 20,348,048 3,198,742 15.7% 75,068 0.4% 3,273,810 16.1% 17.4% 242,870 109,308 $23.11 Kingwood/Humble A 3 158,640 26,765 16.9% 0 0.0% 26,765 16.9% 16.3% -861 0 $29.50 B 60 1,818,017 175,528 9.7% 2,224 0.1% 177,752 9.8% 10.4% 8,805 2,041 $19.71 C 72 697,520 29,218 4.2% 0 0.0% 29,218 4.2% 4.3% 232 -1,244 $15.85 Total 135 2,674,177 231,511 8.7% 2,224 0.1% 233,735 8.7% 9.2% 8,176 797 $19.33 NASA/Clear Lake A 6 809,351 132,397 16.4% 6,214 0.8% 138,611 17.1% 11.8% -57,096 -7,512 $23.25 B 42 3,109,870 200,145 6.4% 15,703 0.5% 215,848 6.9% 7.9% 23,123 -17,813 $19.69 C 28 972,468 146,858 15.1% 0 0.0% 146,858 15.1% 13.5% 10,375 16,823 $15.44 Total 76 4,891,689 479,400 9.8% 21,917 0.4% 501,317 10.2% 9.9% -23,598 -8,502 $19.73 North Belt/Greenspoint A 20 4,751,880 286,876 6.0% 62,232 1.3% 349,108 7.3% 6.6% -39,550 17,567 $19.48 B 55 5,123,255 1,223,201 23.9% 57,020 1.1% 1,280,221 25.0% 25.4% 57,035 98,613 $15.52 C 21 1,323,627 231,610 17.5% 9,080 0.7% 240,690 18.2% 17.9% -4,192 -14,048 $13.69 Total 96 11,198,762 1,741,687 15.6% 128,332 1.1% 1,870,019 16.7% 16.5% 13,293 102,132 $16.08 Northeast Far and Outlier B 5 301,773 75,527 25.0% 0 0.0% 75,527 25.0% 25.0% 0 0 $16.81 C 6 149,813 11,934 8.0% 0 0.0% 11,934 8.0% 8.3% 572 0 $12.00 Total 11 451,586 87,461 19.4% 0 0.0% 87,461 19.4% 19.5% 572 0 $15.86 COLLIERS INTERNATIONAL | P. 5
- 6. RESEARCH & FORECAST REPORT | Q1 2011 | HOUSTON OFFICE MARKET HOUSTON SUBURBAN OFFICE MARKET SUMMARY Northwest A 22 3,725,391 1,153,118 31.0% 1,404 0.0% 1,154,522 31.0% 33.7% 136,112 67,737 $25.37 B 70 6,564,450 1,437,460 21.9% 16,580 0.3% 1,454,040 22.2% 22.3% 26,751 5,418 $16.05 C 40 1,502,938 97,098 6.5% 0 0.0% 97,098 6.5% 5.7% -11,622 -3,844 $12.17 Total 132 11,792,779 2,687,676 22.8% 17,984 0.2% 2,705,660 22.9% 23.8% 151,241 69,311 $19.75 Northwest Outlier A 1 89,750 0 0.0% 0 0.0% 0 0.0% 0.0% 0 0 - B 4 135,457 2,339 1.7% 0 0.0% 2,339 1.7% 1.7% 0 -745 $13.80 Total 5 225,207 2,339 1.0% 0 0.0% 2,339 1.0% 1.0% 0 -745 $13.80 Richmond/Fountainview B 14 781,369 84,001 10.8% 0 0.0% 84,001 10.8% 9.8% 634 -4,291 $15.55 C 17 664,389 50,266 7.6% 0 0.0% 50,266 7.6% 5.6% -6,192 -7,125 $13.50 Total 31 1,445,758 134,267 9.3% 0 0.0% 134,267 9.3% 8.3% -5,558 -11,416 $15.10 San Felipe/Voss A 3 1,737,712 256,238 14.7% 0 0.0% 256,238 14.7% 16.3% 21,232 -7,423 $29.67 B 33 3,397,828 273,010 8.0% 31,650 0.9% 304,660 9.0% 10.0% 24,004 -828 $19.31 C 3 161,393 30,392 18.8% 0 0.0% 30,392 18.8% 14.6% -7,819 -2,185 $16.50 Total 39 5,296,933 559,640 10.6% 31,650 0.6% 591,290 11.2% 12.3% 37,417 -10,436 $23.01 South A 1 80,000 19,000 23.8% 0 0.0% 19,000 23.8% 25.6% 1,500 54,000 $26.63 B 14 566,345 71,891 12.7% 0 0.0% 71,891 12.7% 14.0% -3,888 -5,403 $20.18 C 4 223,029 39,897 17.9% 0 0.0% 39,897 17.9% 17.5% -977 0 $14.75 Total 19 869,374 130,788 15.0% 0 0.0% 130,788 15.0% 15.9% -3,365 48,597 $19.47 South Main/Med Center A 15 4,159,577 286,889 6.9% 0 0.0% 286,889 6.9% 7.7% 14,320 62,128 $29.50 B 33 3,776,469 316,726 8.4% 4,800 0.1% 321,526 8.5% 8.7% -3,986 4,064 $19.84 C 31 2,453,446 117,183 4.8% 0 0.0% 117,183 4.8% 4.0% 1,950 5,159 $17.43 Total 79 10,389,492 720,798 6.9% 4,800 0.0% 725,598 7.0% 7.1% 12,284 71,351 $23.46 Southeast/Outlier A 1 159,304 0 0.0% 0 0.0% 0 0.0% 0.0% 0 0 - B 9 521,715 103,077 19.8% 0 0.0% 103,077 19.8% 16.0% -18,800 0 $20.56 C 1 22,783 12,533 55.0% 0 0.0% 12,533 55.0% 55.0% 0 0 $24.00 Total 11 703,802 115,610 16.4% 0 0.0% 115,610 16.4% 13.4% -18,800 0 $20.97 Southwest A 6 1,505,805 394,632 26.2% 41,486 2.8% 436,118 29.0% 30.2% 16,998 12,675 $15.04 B 57 5,877,045 1,222,910 20.8% 104,470 1.8% 1,327,380 22.6% 25.3% -122,584 -138,045 $15.71 C 44 2,534,356 237,107 9.4% 0 0.0% 237,107 9.4% 10.0% 4,294 4,004 $12.19 Total 107 9,917,206 1,854,649 18.7% 145,956 1.5% 2,000,605 20.2% 22.2% -101,292 -121,366 $15.13 Southwest Far and Outlier A 2 87,710 7,952 9.1% 0 0.0% 7,952 9.1% 9.1% 0 -5,581 $28.08 B 14 616,117 71,639 11.6% 1,365 0.2% 73,004 11.8% 12.8% 5,620 -1,371 $26.64 C 3 128,735 0 0.0% 0 0.0% 0 0.0% 0.0% 0 0 - Total 19 832,562 79,591 9.6% 1,365 0.2% 80,956 9.7% 10.4% 5,620 -6,952 $26.90 COLLIERS INTERNATIONAL | P. 6
- 7. RESEARCH & FORECAST REPORT | Q1 2011 | HOUSTON OFFICE MARKET HOUSTON SUBURBAN OFFICE MARKET SUMMARY INVENTORY DIRECT VACANCY SUBLEASE VACANCY VACANCY VACANCY RATE (%) NET ABSORPTION (SF) RENTAL RATE Class # of Bldgs. Total (SF) (SF) Rate (%) (SF) Rate (%) Total (SF) Q1-2011 Q4-2010 Q1-2011 Q4-2010 Avg. ($/SF) West Loop/Galleria A 40 16,231,480 1,536,994 9.5% 90,716 0.6% 1,627,710 10.0% 10.4% 8,513 39,833 $28.19 B 54 5,660,460 1,273,838 22.5% 10,467 0.2% 1,284,305 22.7% 23.2% 29,970 -56,899 $20.11 C 6 332,166 0 0.0% 0 0.0% 0 0.0% 0.2% 940 1,504 $16.64 Total 100 22,224,106 2,810,832 12.6% 101,183 0.5% 2,912,015 13.1% 13.4% 39,423 -15,562 $25.10 Westchase A 27 7,909,447 1,096,247 13.9% 30,031 0.4% 1,126,278 14.2% 17.9% 182,004 140,718 $30.05 B 51 4,939,227 857,931 17.4% 65,517 1.3% 923,448 18.7% 15.7% -168,429 31,578 $18.89 C 9 441,936 48,027 10.9% 0 0.0% 48,027 10.9% 12.1% 5,398 0 $15.05 Total 87 13,290,610 2,002,205 15.1% 95,548 0.7% 2,097,753 15.8% 16.9% 18,973 172,296 $25.55 The Woodlands A 15 2,248,601 448,733 20.0% 19,531 0.9% 468,264 20.8% 22.0% 17,377 81,164 $29.63 B 56 3,094,629 426,579 13.8% 43,243 1.4% 469,822 15.2% 15.9% 57,550 46,538 $19.64 C 6 397,869 24,910 6.3% 0 0.0% 24,910 6.3% 23.2% 8,957 8,845 - Total 77 5,741,099 900,222 15.7% 62,774 1.1% 962,996 16.8% 18.6% 83,884 136,547 $24.02 OFFICE DEVELOPMENT PIPELINE Houston’s development activity remained slow during the first quarter, with only a 5 handful of projects under construction. Griffin Partners’ four-story, 102,000 SF Nassau 2 Bay Town Square office building is located in the NASA/Clear Lake submarket. This pre- certified LEED Silver office building is scheduled to come on line 60% pre-leased with 4 Hamilton Sundstrand Corporation as the lead tenant. Also included in the 1.2 million SF currently under construction is Greenwood Corporation’s 156,000 SF Chasewood Crossing II in the FM 1960-Highway 249 submarket (scheduled for completion in April 2011). 1 Hines delivered the 972,500 square foot BG Group Place (formerly MainPlace) during 1st quarter 2011, which leaves only one CBD office project under construction. Trammell Crow Company’s Hess Tower (formerly Discovery Tower) is the sole high-profile office building under construction in Houston. The 845,000 square foot, Class A office tower is 100% leased by Hess Corporation and is scheduled for completion by June 2011. 3 Halliburton recently broke ground on a 100,000 SF office building located in its 94-acre North Belt Campus, situated just south of Beltway 8 and Houston’s George Bush Intercontinental Airport. The campus will become home to the current corporate headquarters location, currently located in approximately 26,000 square feet of leased corporate executive office space in downtown Houston. The redeveloped campus will grow to support approximately 2,200 employees with a new Research and Development facility featuring state-of-the-art laboratories, two new parking garages, a new cafeteria and new childcare and employee wellness and fitness centers. The building is being developed by D. E. Harvey Builders and is scheduled for completion in 1st quarter 2013. SELECT OFFICE BUILDINGS UNDER CONSTRUCTION BUILDING NAME ADDRESS SUBMARKET SF LEASED DEVELOPER EST. DELIVERY 1 Hess Tower 1501 McKinney St. CBD 844,763 100.0% TCC Development 06/2011 2 Chasewood Crossing II 19450 State Hwy 249 FM 1960/Hwy 249 156,000 0.0% Greenwood Corporation 04/2011 3 Nassau Bay Town Square I 18050 Saturn Ln NASA/Clear Lake 100,000 60.0% Griffin Partners Inc. 09/2011 4 Halliburton North Belt Campus Milner Road North Belt/Greenspoint 100,000 100.0% D. E. Harvey Builders 01/2013 5 Technology Forest Professional 4055 Technology Forest Woodlands 50,000 50.0% Woodlands Land Dev 12/2011 Total SF Under Construction 1,250,763 COLLIERS INTERNATIONAL | P. 7
- 8. RESEARCH & FORECAST REPORT | Q1 2011 | HOUSTON OFFICE MARKET Colliers International Statistics Revenues: $1.9 Billion Countries: 61 Offices: 480 Professionals & Staff: 15,052 Brokers: 4,788 Square Feet Managed: 2.4 Billion Lease/Sale Transactions: 135,977 Total Transaction Value: $53 Billion COLLIERS INTERNATIONAL | HOUSTON 1300 Post Oak Boulevard Suite 200 Houston, Texas 77056 MAIN +1 713 222 2111 Accelerating success. COLLIERS INTERNATIONAL | P. 8