David Litt Foreclosure Specialist - Your Partner in Real Estate Success
Houston Industrial Market Report 4Q 2010
1. Q4 2010 | INDUSTRIAL MARKET
HOUSTON INDUSTRIAL MARKET
RESEARCH & FORECAST REPORT
Industrial Market, Houston’s Strongest Real Estate
Sector in 2010
Houston’s industrial market fundamentals continue to strengthen, adding 354,000-SF
of positive net absorption in the fourth quarter bringing the year-to-date total to 4.8M
SF, a huge improvement from the positive net absorption of 1.7M SF recorded in
2009. Vacancy also posted a slight gain with the citywide average at 6.2% in the
CITYWIDE MARKET INDICATORS fourth quarter, down from 6.7% at this time last year. The quoted citywide rental rate
4Q-09 4Q-10
for industrial space increased by 8.5% over the same period last year. On the leasing
front, twenty-one leases over 100,000 SF were signed in 2010, with seven leases over
QUARTERLY NET ABSORPTION 200,000 SF. A significant boost to the market’s stabilization has been disciplined
440,906 SF 354,079 SF
curtailment of new speculative construction activity, with only 207,000 SF in the
construction pipeline at the close of 4Q10, compared to 1.3M SF under construction at
YEAR-END NET ABSORPTION this time last year.
1,722,819 SF 4,760,762 SF
Looking forward, Houston’s industrial sector is expected to improve moderately as key
QUOTED RENTAL RATE NNN economic drivers move towards recovery. The Port of Houston has been instrumental
$4.95/SF $5.37/SF in Houston's development as a center of international trade. Over 100 steamship lines
offer service linking Houston with 1,053 ports in 203 countries. It is also home to a $15
INDUSTRIAL VACANCY billion petrochemical complex, the largest in the nation and second largest worldwide.
Looking forward, The Port of Houston Authority will host the American Association of
6.7% 6.2%
Port Authorities annual convention in 2014, which will coincide with the 100th
QUARTERLY DELIVERIES anniversary celebration of the official opening of the Houston Ship Channel.
328,613 204,793
Macro factors driving the absorption of industrial space ultimately ties back to job
YEAR-END DELIVERIES count. According to the Texas Labor Market Review, total nonagricultural employment
6,689,662 SF 2,239,377 SF in Texas rose by 19,100 jobs in November, gaining jobs in eight out of eleven months.
At the local level, Houston’s MSA had the largest monthly job increase, with 10,900
UNDER CONSTRUCTION jobs added in November. Dallas followed with 5,200 jobs added. Houston also led in
1,301,926 SF 206,671 SF the monthly growth of retail and government jobs, adding 7,400 and 2,300 jobs,
respectively.
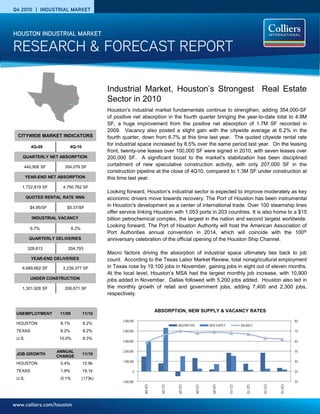
ABSORPTION, NEW SUPPLY & VACANCY RATES
UNEMPLOYMENT 11/09 11/10
5,000,000 8%
HOUSTON 8.1% 8.2% ABSORPTION NEW SUPPLY VACANCY
TEXAS 8.2% 8.2% 4,000,000 7%
U.S. 10.0% 9.3%
3,000,000 6%
ANNUAL 2,000,000 5%
JOB GROWTH 11/10
CHANGE
1,000,000 4%
HOUSTON 0.4% 10.9k
TEXAS 1.9% 19.1k 0 3%
U.S. -0.1% (173k)
-1,000,000 2%
Q4-08
Q1-09
Q2-09
Q3-09
Q4-09
Q1-10
Q2-10
Q3-10
Q4-10
www.colliers.com/houston
2. RESEARCH & FORECAST REPORT | Q4 2010 | HOUSTON INDUSTRIAL MARKET
2010 INDUSTRIAL LEASES Vacancy & Availability Absorption & Demand
Igloo Products Corp*** Houston’s industrial market averaged Houston’s industrial market posted
777 Igloo Road 6.2% vacancy in the fourth quarter, 20
May-10 914,195 SF positive net absorption of 354K SF in the
basis points (bps) less than the previous fourth quarter, an improvement over the
Ashley Furniture* quarter, and 70 bps below the 6.9% positive net absorption of 200K SF in the
Airtex Industrial Center recorded in the same quarter last year. same quarter last year. This marked the
Mar-10 303,000 SF
Over the past nine quarters, Houston’s fifth consecutive quarter of gains,
Frontier Logistics industrial market has consistently bringing the year-to-date positive net
3005 State Highway 225 maintained vacancy levels below 10% for absorption to 4.8M SF. By comparison,
Feb-10 300,000 SF
all major corridors, outperforming all other the annual net absorption for all four
Ford Motor Company** commercial real estate property sectors quarters of 2009 was 1.8M.
Alamo Crossing Commerce Center citywide.
Dec-10 252,328 SF Among Houston’s major industrial
At the end of the fourth quarter, Houston corridors, the Northwest and Southwest
Trans-Hold
8905 Spikewood posted 29.6M SF of vacant industrial outperformed other industrial sectors at
Jun-10 251,600 SF space citywide. Among the major year-end 2010. The Northwest posted
industrial corridors, the Northwest held the the highest positive net year-end
Gulf Winds International**
South Loop Business Park largest amount of vacant space with 7.9M absorption with 2.3 SF, and 1.5M SF.
Jun-10 212,961 SF SF (6.1% vacancy), followed by the The North followed with positive net year-
Southeast with 6.1M SF vacant (7.6% end absorption of 1.2M SF.
Williamsport Distribution Center
11503 Highway 225
vacancy), the Southwest with 4.5M SF
Apr-10 210,000 SF vacant (7.2% vacancy), and the North with There was only one major tenant move-in
4.3M SF vacant (6.5% vacancy). contributing to net absorption gains in the
Portsmith
4th quarter, Val-Fit Inc. moved into
21202 Park Row
Aug-10 180,000 SF
Developers have continued to show 170,017-SF (Northeast).
restraint to current market conditions by
Val-Fit Inc. halting major speculative industrial Leasing
9051 Spikewood Dr.
construction projects in Houston, leaving Houston’s industrial market recorded
Nov-10 170,017 SF
only 207,000 SF in the construction twenty-one (21) leases over 100,000 SF
FedEx pipeline at the end of the fourth quarter. – including seven (7) leases over
Ellington Trade Center I The largest project under construction is a 200,000 SF during 2010. The majority of
Jun-10 146,792 SF
52,400-SF multi-tenant office/warehouse in the leases singed during 4Q10 were less
Xpedx*** the North Hardy Toll Rd submarket than 50,000 SF.
10300 North Loop Freeway scheduled for delivery March 2011.
Apr-10 139,871 SF
Speculative construction is expected to Overall, industrial leasing activity
Exel** remain limited over the next 6 to 12 reached 2.5M SF in the fourth quarter,
8607 Citypark Loop months. 2.0M SF less than the previous quarter
May-10 127,900 SF and 3.5M SF less than what was
Rental Rates
Transportation Consultants recorded in the same quarter last year.
Bay Area Business Park Houston’s average quoted industrial rental For a select list of Houston’s top
July-10 120,000 SF rates increased by 1.0% between quarters, industrial leases signed to date, please
and fell by 6.0% on a year-over-year basis. see the column at left.
CVS Pharmacy**
The overall $5.33 NNN/SF in the fourth
301 S. Trade Center Parkway
Jun-10 113,175 SF quarter fell from $5.65 NNN/SF at this time
last year. By property type on a year-over-
Furniture Brands* year basis, warehouse distribution space
Airtex Industrial Center
July-10 109,386 SF was $4.67 NNN/SF (up $0.40/SF) and flex
space stood at $7.91 NNN/SF (up
$0.34/SF).
*Colliers International transaction
** Renewal
*** Sale-Leaseback
COLLIERS INTERNATIONAL | P. 2
3. RESEARCH & FORECAST REPORT | Q4 2010 | HOUSTON INDUSTRIAL MARKET
HOUSTON INDUSTRIAL INVESTMENT SALES Sales Activity
Houston’s industrial investment Wilsonville Holiday Partners LLC
Year-end 2010 activity remained sluggish during the acquired the 88,500-SF Westgreen
fourth quarter adding only 22 sales Business Center located in Katy,
Total Volume: $1.1B
to the 87 sale year-end total which Texas from for $70/SF.
# of Transactions: 87
totaled $1.1B in total volume. The
Total SF: 15,155,000 combined total of 15.1 MSF had an DCT Industrial Trust purchased a
Average Price/SF: $102 average sales price of $102/SF. 51,959-SF distribution warehouse
Average Cap: 8.2% Although owner/user industrial located at 16303 Air Center Blvd.
properties less than 35,000 SF from The National Realty Group for
Source: Costar Comps
continued to account for the majority $52/SF.
of transactions to date, there were LT Foods USA purchased 39,000-
some larger Q4 sales that included: SF distribution center located at
14511 Fairway Pines Dr. in the
Duke Realty acquired the 356,000-
Lakeview Business Park from Crow
SF Barbour's Cut Business Park and
Holdings for $64/SF.
the 226,000-SF Bayport Container
Terminal located in La Porte and
Seabrook, Texas, respectively, from
14511 Fairway Pines Dr. Granite Properties. The two-property
Missouri City, Texas sale is rumored to have sold for an
average of $82/SF.
HOUSTON INDUSTRIAL MARKET SUMMARY
Direct Sublet Total
Direct Sublet Total 4th Qtr Net YTD Net 4th Qtr YTD SF Under
Market Rentable Area Vacancy Vacancy Vacancy
Vacant SF Vacant SF Vacant SF Absorption Absorption Completions Completions Construction
Rate Rate Rate
Greater Houston Total 474,722,080 28,902,560 6.1% 710,715 0.1% 29,613,275 6.2% 354,079 4,760,762 204,793 2,239,377 206,671
NW Inner Loop 12,321,397 651,998 5.3% 53,034 0.4% 705,032 5.7% (28,683) 81,772 - - -
CBD 33,962,193 1,859,048 5.5% - 0.0% 1,859,048 5.5% 262,336 109,072 - - -
North Inner Loop 5,655,358 525,139 9.3% - 0.0% 525,139 9.3% 13,299 (42,733) - - -
SW Inner Loop 9,096,442 192,220 2.1% 13,164 0.1% 205,384 2.3% (4,382) 151,046 - - -
Total Inner Loop 61,035,390 3,228,405 5.3% 66,198 0.1% 3,294,603 5.4% 242,570 299,157 - - -
North Fwy/Tomball Pky 12,661,810 1,202,565 9.5% 9,975 0.1% 1,212,540 9.6% 32,936 134,742 10,000 10,000 -
North Hardy Toll Rd 23,993,349 1,512,322 6.3% 98,068 0.4% 1,610,390 6.7% 238,213 1,119,562 - 195,100 120,546
North Outer Loop 17,447,882 878,686 5.0% - 0.0% 878,686 5.0% (16,597) (39,680) 67,250 -
The Woodlands/Conroe 11,418,215 562,407 4.9% 21,197 0.2% 583,604 5.1% 78,008 (31,367) - - -
Total North Corridor 65,521,256 4,155,980 6.3% 129,240 0.2% 4,285,220 6.5% 332,560 1,183,257 10,000 272,350 120,546
Northeast Hwy 321 1,068,683 - 0.0% - 0.0% - 0.0% 0 7,700 - - -
Northeast Hwy 90 15,968,145 472,072 3.0% 68,680 0.4% 540,752 3.4% 31,000 (218,101) - - -
Northeast I-10 3,767,427 55,695 1.5% - 0.0% 55,695 1.5% (30,154) (30,154) - - -
Northeast Inner Loop 11,516,440 992,918 8.6% - 0.0% 992,918 8.6% (25,811) (246,509) 148,793 148,793 -
Total Northeast Corridor 32,320,695 1,520,685 4.7% 68,680 0.2% 1,589,365 4.9% (24,965) (487,064) 148,793 148,793 -
Hwy 290/Tomball Pky 16,185,589 881,835 5.4% 16,024 0.1% 897,859 5.5% 67,645 367,957 204,800 -
Northwest Hwy 6 4,293,271 771,146 18.0% - 0.0% 771,146 18.0% 44,557 215,463 140,000 -
Northwest Inner Loop 60,809,214 3,237,720 5.3% 194,745 0.3% 3,432,465 5.6% (115,712) 711,001 - 25,760 -
Northwest Near 16,285,861 944,292 5.8% 13,550 0.1% 957,842 5.9% 58,300 172,289 - - -
Northwest Outlier 11,221,921 441,155 3.9% - 0.0% 441,155 3.9% (40,768) 337,678 - 180,000 -
West Outer Loop 21,220,208 1,447,018 6.8% 3,678 0.0% 1,450,696 6.8% 69,547 464,183 - 101,650 34,125
Total Northwest Corridor 130,016,064 7,723,166 5.9% 227,997 0.2% 7,951,163 6.1% 83,569 2,268,571 - 652,210 34,125
East I-10 Outer Loop 14,972,842 410,595 2.7% 70,000 0.5% 480,595 3.2% 2,750 (15,672) - - -
East-SE Far 43,120,913 5,028,724 11.7% 37,341 0.1% 5,066,065 11.7% 152,282 294,760 - - -
SE Outer Loop 21,947,934 563,624 2.6% - 0.0% 563,624 2.6% 6,715 (97,838) - - -
Total Southeast Corridor 80,041,689 6,002,943 7.5% 107,341 0.1% 6,110,284 7.6% 161,747 181,250 - - -
South Highway 35 29,447,290 1,492,351 5.1% 11,000 0.0% 1,503,351 5.1% (17,910) (343,059) 26,000 26,000 -
South Inner Loop 13,480,541 359,192 2.7% - 0.0% 359,192 2.7% (10,554) 150,633 - - -
Total South Corridor 42,927,831 1,851,543 4.3% 11,000 0.0% 1,862,543 4.3% (28,464) (192,426) 26,000 26,000 -
Highway 59/Highway 90 22,624,680 1,271,448 5.6% 64,871 0.3% 1,336,319 5.9% (28,003) 571,256 - 62,898 -
Southwest Far 9,701,229 558,780 5.8% 12,490 0.1% 571,270 5.9% 21,906 141,272 - - -
Southwest Outer Loop 13,274,451 1,239,975 9.3% - 0.0% 1,239,975 9.3% (83,897) 24,783 - - -
Fort Bend County/Sugar Lan 17,258,795 1,349,635 7.8% 22,898 0.1% 1,372,533 8.0% (322,944) 770,706 20,000 1,077,126 52,000
Total Southwest Corridor 62,859,155 4,419,838 7.0% 100,259 0.2% 4,520,097 7.2% (412,938) 1,508,017 20,000 1,140,024 52,000
COLLIERS INTERNATIONAL | P. 3
4. RESEARCH & FORECAST REPORT | Q4 2010 | HOUSTON INDUSTRIAL MARKET
Select Industrial Projects Under Construction
Estimated
Submarket Building Name Building Address RBA % Leased Developer Delivery
1 North Hardy Toll Rd 7902 FM 1960 Building 7902 FM 1960 Building 52,400 0 CBRE Mar-11
2 Sugar Land 15445 Old Richmond Ave 15445 Old Richmond Ave 52,000 0 Richard Chen Mar-11
3 North Hardy Toll Rd World Houston Building 31 4540 Kendrick Plaza 43,536 27.8 East Properties Feb-11
4 West Outer Loop 11987 FM 529 Warehouse 11987 FM-529 34,125 0 Texas Development Company Mar-11
5 North Hardy Toll Rd Greens Rd Ind Park Bldg F 2437 Peyton Rd 24,610 0 Holt Lundsford Commercial Oct-10
Total u/c indus trial projects lis ted above 206,671
Houston Industrial Under Construction
1
5 3
4
2
Select 2010 Industrial Deliveries
%
Submarket Building Park Building Name Building Address RBA Leased Developer Name Delivered
1 Sugar Land Rooms To Go Distribution Center 31111 Miller Rd 1,057,126 100 Houston Associates LLC Mar-10
2 Hwy 290/Tomball Pky Jake's Finer Foods HQ 13400 Hollister Dr 180,000 100 n/a Feb-10
3 Northwest Outlier Primewest Business Park Pointsmith HQ 21202 Park Row 180,000 100 n/a Aug-10
4 West Outer Loop Warehouse II 15300 Hempstead Hwy 150,000 82.67 The National Realty Grou May-10
5 Northeast Inner Loop Portwall Distribution Center Portwall IV 531 Portwall 148,793 0 The Carson Companies Dec-10
6 North Hardy Toll Rd LKQ Corporation 19423 Aldine Westfield Rd 98,850 100 n/a Feb-10
7 North Hardy Toll Rd AMB IAH Logistics Center III Forward Air 19220 Kenswick Dr 96,250 100 AMB Property Corporatio Jan-10
8 North Outer Loop 13627 W Hardy Warehouse 13627 W Hardy Rd 67,250 0 The National Realty Grou Jun-10
9 Northwest Hwy 6 Hempstead 1960 Bus. Park 20220 Hempstead Warehouse 20220 Hempstead Rd 65,000 0 Capital RE Commercial Mar-10
Houston Industrial New Inventory
6
7
9 2 8
4
3
5
1
COLLIERS INTERNATIONAL | P. 4
5. RESEARCH & FORECAST REPORT | Q4 2010 | HOUSTON INDUSTRIAL MARKET
480 offices in
61 countries on
6 continents
United States: 135
Canada: 39
Latin America: 17
Asia Pacific: 52
EMEA: 95
COLLIERS INTERNATIONAL | HOUSTON
1300 Post Oak Boulevard
Suite 200
Houston, Texas 77056
MAIN +1 713 222 2111
Accelerating success.
COLLIERS INTERNATIONAL | P. 5