Infographics Congress 2014 John Grimwade
•
0 gostou•504 visualizações

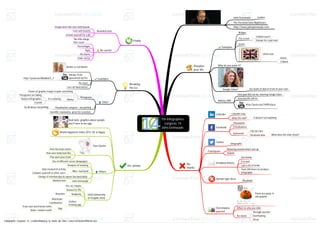
Mind map of the Talk of John Grimwade on The Personal Data Nightmare
Recomendados

Recomendados
Mais conteúdo relacionado
Mais de Connection of Minds
Mais de Connection of Minds (20)
Último
Último (20)
Infographics Congress 2014 John Grimwade
- 1. 7th Infographics congress 14 John Grimwade John Grimwade London The Personal Data Nightmare Http://www.johngrimwade.com Visualize your life Examples Bridges The crown 4 billion euro's Stamps for royal mail Scone Union Jack Scone 3 labels Why do you want it? Google Glass? See loads of data in front of your eyes Infinity (AR) How your life can be, wearing Google Glass How you life will be Http://youtu.be/C4VRFuSyzzc No, thanks LinkedIn LinkedIn map What the hell? It doesn't tell anything Facebook Timewaster Friendswheel Statement I do not care Facebook data What does the chart show? Twitter Infographic Foursquare Bouncing around where you go Helpful Emailbox history Increasing It is cool I get a lot of email Took 200 hours to produce infographic Human type faces No please Overanalyse yourself Know you poop, A shit graphic Where & why you stink No sweat Through exercise Overheating Stress Yes, please Real data: graphics about people don't have to be ugly World happiness index 2013, NL is happy Tom Giesler How the brain works How your body look like Pop open your brain Others Use of different curses (languages) Analyses of smoking Nike+ fuel band Data tracked of activity Compare yourself to other users Change of emotion due to cancer (no hard data) John GrimwadeMarked men UGA (University of Graphic Arts) Yes, no, maybe Glasses for life SimplicityBracelets Clothes tracking app Wardrobe Combination App Track own and friends cloths Shake: random outfit Breaking the ice Examples Barbie vs real Barbie Recipe: fresh guacamole by PesHttp://youtu.be/dNJdJIwCF_Y Pie chart Lost cat illustrations Other Pictograms Power of graphic images is quite something WinterIt is snowing Pictograms are falling Nature infographics Crystals Visualisation congress - storytellingIts all about storytelling Scientific visalisation, great for scientists Finally Bearded men People don't like men with beards Font with beards Groom yourself for a jib Be careful The little things that count Percentages Signs Pie charts Polar vortex Infopgraphic Congress 14 | LiveMindMapping by Alexis van Dam | www.ConnectionOfMinds.com