Prof Alan Rodger - The Latest Evidence on Climate Change, Beyond IPCC
•
3 gostaram•886 visualizações


Recomendados
Recomendados
Mais conteúdo relacionado
Semelhante a Prof Alan Rodger - The Latest Evidence on Climate Change, Beyond IPCC
Semelhante a Prof Alan Rodger - The Latest Evidence on Climate Change, Beyond IPCC (20)
Mais de Shane Mitchell
Mais de Shane Mitchell (20)
Último
Último (20)
Prof Alan Rodger - The Latest Evidence on Climate Change, Beyond IPCC
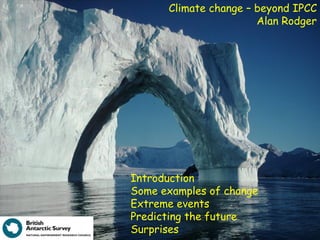
- 1. Climate change – beyond IPCC Alan Rodger Introduction Some examples of change Extreme events Predicting the future Surprises
- 3. Astronomical Atmosphere Hydrosphere Geosphere Sun Earth Cryosphere Biosphere Anthropo- sphere Earth System
- 4. Astronomical Atmosphere Cultural Hydrosphere Economics Geosphere Political Sun Earth Cryosphere Social Biosphere Technology Well being Anthropo- Water Science sphere Food Shelter Fuel Health Security Earth System
- 5. The climate system IPCC, 2007
- 6. IPCC Fourth Assessment Report Climate Change 2007 • Atmospheric GHG concentrations far exceed levels of last 650,000y as a result of human emissions • Warming of the climate system is “Unequivocal” • Climate forcing primarily human (x10 solar) • Agreed by delegates of 113 nations IPCC does not capture non linear effects well
- 7. European Project for Ice Coring in Antarctica (EPICA) Ice cores – the gold standard climate change record? 60 °S Dronning Maud Land EU/ESF project 70 1996-2006 °S Berkner Dome F Drilling depth of 3.27km Island ~890 000 years old 80 °S Byrd Vostok Siple Dome Law Dome Taylor Dome C Dome 0km 1,000km 2,000km
- 8. Ice core processing and analysis
- 9. Dome C Antarctica Ice Core Now – 386 ppm Luthi et al., Nature, 15 May 2008 Siegenthaler et al., Science 2005 (EPICA gas consortium)
- 10. Global Temperature • Increase ~0.8°C over the last century • 2007 was 8th warmest year on record • 12 of the 13 warmest years on record occurred since 1995 • 2001-2007 was 0.21°C warmer than 1991-2000 data source: Climatic Research Unit
- 11. China Precipitation 1961-2002 Blue: positive trend; Red: negative Temperatures 1951-2001 18 more growing days in the Qinghai- Tibetan Plateau 500 hours fewer sunshine in North China Plain compared with 50 years ago
- 13. The Key Science Issues for Polar Regions • Greatest uncertainty in global sea level rise • World’s largest carbon sinks, and with the potential for surprise (methane/hydrates) • Critical role of polar ecosystems and biodiversity in the maintenance of the earth system • The major driver of global ocean system, and hence fundamental to predicting world’s weather • Understanding how the planet works – the polar component
- 14. Antarctic Peninsula Glacier Responses Peninsula 1993-2003 Flow rate of over 300 glaciers 12% increase in glacier speed Sea level rise: 0.16 ± 0.06 mm /y Pritchard and Vaughan, 2007 244 glaciers - 87% have retreated over last 50y Cook et al., 2005
- 15. The West Antarctic Ice Sheet and sea level rise Ice-thickness change 1992-2003 Major discharges Pine Island, Thwaites and Smith Glaciers
- 16. Bed elevation in Greenland and Antarctica +2000 0 -2000 Bamber & Vaughan, BEDMAP.
- 17. West Antarctica – last of the great marine ice sheets Grounded below sea level ICE OCEAN After G Clarke LITHOSPHERE
- 18. Greenland is melting! Dublin Lecture no. 6 18 11 Mar 2008
- 19. Arctic sea ice Median Sept. Extent 09.09.2008 1979-2000 IMPACTS Shorter trade routes Easier access to oil and gas Ocean circulation Ecosystems 11 Mar 2008 Dublin Lecture no. 6 19
- 20. World’s Petroleum Potential Verdens uoppdagede petroleumspotensiale North N. Afrika Rest Africa, Resten av Kaspihavet verden East Middle 7 of Midt-Østen Arktis World Arctic 8 6 5 1. Barents Sea 1 2. 1: Southern Kara Sea Barentshavet 3 4 2: and Western Siberia Sørlige Karahavet og Vest-Sibir 3: Nordlige Karahavet 3. 4: Northern Kara Sea Laptevhavet 2 4. 5: Laptev Sea Øst-Sibirhavet 6: Chuchihavet 5. 7: East North Slope Sea Alaska Siberian 8: Øst-Grønnland 6. Chukchi Sea 7. Alaska North Slope 8. East Greenland
- 21. Sea Level Rise - Tide Gauge Observations 150 3.2 mm/year 100 2.0 mm/year 50 ΔMSL (mm) 0 0.8 mm/year -50 Average Rate ~ 1.8 mm/year -100 1880 1900 1920 1940 1960 1980 2000 Year Source: Church and White, 2006 Source: Church and White, 2006
- 22. Sea level trends between January 1993 and December 1999 from satellite data in mm/year Red = sea level rise : Blue = sea level fall
- 23. Tuvalu 8°S, 179°E • Land area 26 square kilometres • Population 4492 • Third least populated independent country • Second smallest member of the UN • Tuvalu has very poor land; soil is hardly usable • Almost no reliable supply of drinking water
- 24. Sea level rise and the EU Within 500 m of the coast • 14% of population (70 m people) • economic assets located of the EU's coastline valued of €1,000B . • 47,500 km2 of sites of high ecological value 15 countries have substantial coasts that are open to the world’s oceans • coastal flooding, • increased rates of erosion • destruction of natural sea defences • threats to human lives and livelihoods Annual expense of protection €3.2 billion and rising non- linearly Managed retreat only option in some areas
- 25. Extreme events
- 26. effect of the 2003 heat wave in Europe Ciais et al., Nature 2005
- 27. Hurricane frequency not changing Gustav Hanna Karina Ike Josephine 3 September 2008 Katrina from space
- 28. Hurricane intensity is increasing Webster, et al., Science 2005 Number of hurricanes unchanged Katrina from space
- 29. Cyclone Nargis hits Burma May 2008 60% of rice from Irrawaddy Delta Mangroves swamps cleared for crops - protection lost Crops destroyed by storm surge The saltiest areas will have to be drained and flushed with fresh water before they can be re-planted Draining a challenge as designed to hold water
- 30. Heavier precipitation, more intense and longer droughts….
- 31. Drought areas already expanding and predicted to expand further Percentage of world's land area in drought 50 40 Percentage in drought 30 20 10 0 1960 1980 2000 2020 2040 2060 2080 2100 Source: Burke, EJ and SJ Brown. Modelling the recent evolution of global drought and projections for the 21st century. Journal of Hydrometeorology, 2006
- 32. Desertification Vulnerable Low Moderate High Very high
- 34. Uncertainties in prediction 1. Future emissions are not known 2. Computer models are not perfect 3. Natural variability of climate occurs Therefore Improve understanding and modelling of the climate system Quantify uncertainty: probabilistic forecasts Incorporate probabilistic forecasts into decision making tools
- 35. The carbon cycle 2000-2005 CO2 budget (GtC/y) atmosphere fossil fuel 4.2 emissions land use land change sink 7.2 1.5 2.3 ocean sink 2.2 geological reservoirs Natural and man-made sources and sinks changing Canadell et al. 2007
- 36. fossil fuel CO2 emissions for the world CO2 emissions increase 1990s 1.3% y-1 2000-2006 3.3% y-1 CO2 growth rate 65±16% from increasing global economic activity 17±6% from the increasing carbon intensity of the global economy 18±15% from the increase in airborne fraction Canadell et at., PNAS, 2007 Raupach et al., 2007
- 37. Less carbon draw down from the atmosphere into the oceans Cause: Increase in Southern Ocean winds Le Quéré et al., Science, 2007
- 38. The other carbon problem 1- ocean acidification 800 ppm CO2 is corrosive to the shells of many marine organisms Phytoplankton assemblages will change
- 39. The other carbon problem 2 - methane Methane from the tundra Methane from farming 800 ppm More carbon locked up in methane than in oil and gas Methane from the ocean
- 40. 1989 2003 Water Aral Sea Surface area 17,160 km² (2004, three lakes) 28,687 km² (1998, two lakes) 68,000 km² (1960, one lake) Fivefold increase in salinity Weapons testing Wind blown salt damages crops Polluted drinking water Salt and dust laden air causing health problems “The Aral Sea, the worst man-made environmental disaster” says UN
- 41. Water Lack of melting snow Changes in precipitation – very hard to predict Change of rainfall in 2090 compared with 1990
- 42. Conclusions • The Earth system is highly coupled • Change occurring everywhere Rates of change increasing Fastest at the poles Rate of change unprecedented Humans are affecting the planet • IPCC - conservative • Predicting the future: the big challenge • BUT challenge the climate scientist
- 45. geoengineering options Keith, Nature, 2001 Problems: • difficult to scale up • difficult to prove efficiency • difficult to reverse • possible side-effects • decades of research needed
- 47. The economics of ecosystems and biodiversity European Commission, 2008
- 48. The glacial cycle Temperature rises a little because of the orbit of the Earth Warmer waters cannot dissolve as much CO2 Increase in temperature Increase CO2 leads to more heating Other feedbacks increase phytoplankton at high latitudes less sea ice
- 49. Earth‘s Orbit Earth‘s Milankovitch cycles Temperature precedes CO2
- 51. Variations/uncertainties Long term – cryosphere years/decades - m Storm surges – pressure/winds 1–5 days - up to 5 m Ocean surface topography (changes in water density and currents) - days to weeks - up to 1 m El Niño-Southern Oscillation (ENSO) - up to 0.6 m River runoff/floods - 2 months - 1 m Seasonal water density changes (temperature/ salinity) - 6 months 0.2 m Sea-Level Rise Could Wipe Out Bangladesh by 2100 Proudman Oceanography Laboratory, 2008 X 4 IPCC estimates of sea level rise
- 52. 2005 January 2006 Serengeti
- 54. Unexpected high diversity in the Southern Ocean deep sea: > 1400 species, > 700 new, undescribed species Isothermal environment Southern Ocean warming Animals susceptible to change South Sandwich Trench 6348 m © Diaz & Carpenter, VIMS
- 55. Impacts of change on the Antarctic Peninsula
- 56. Natural Variability Variability on long term trends
- 57. Long term and abrupt climate change Methane from tundra Methane hydrates
- 59. The Intergovernmental Panel on Climate Change (IPCC) has been established by WMO and UNEP to assess scientific, technical and socio-economic information relevant for the understanding of climate change, its potential impacts and options for adaptation and mitigation.
- 60. Projected patterns of precipitation changes 2090/2099 : 1980/1999 Dec-Feb Jun-Aug Stippled areas: uncertain 40% of the world’s food supply requires irrigation 11 Mar 2008 Dublin Lecture no. 6 60
- 61. Socolow
- 62. Zachos et al. 2008
- 63. atmospheric CO2 (ppm) 385 2008 1958 280 1850 180 650 thousand years Siegenthaler et al. 2006
- 64. Atmospheric Emissions from Net emissions from Oceanic Missing = + - - increase fossil fuels changes in land use uptake carbon sink 3.2 (±0.2) = 6.3 (±0.4) + 2.2 (±0.8) - 2.4 (±0.7) - 2.9 (±1.1)
- 65. Plantations in Campo-Maan in Cameroon The drying up of Lake Faguibine in Mali. now dominate the landscape (right) When the lake was full (left) it was amongst 30 years ago the forest appears the largest lakes in Africa but in the 1990s largely intact it dried up completely (right) Declining water levels in Lake Chad. The disappearing Damietta Promontory in Persistent droughts and increased Egypt. The promontory has eroded agricultural irrigation have reduced the dramatically in the last 30 years as waves and Lake’s extent in the past 35 years to currents have stripped its sands faster than one tenth of its former state the river can replenish them
- 66. Vast iceberg breaks off Wilkins Ice Shelf in Antarctic 28 Feb 2008 Vaughan et al., 2008 Antarctic ice shelf 'hanging by a thread' 17 March 2008
- 67. Ecosystems Since 1900 50% of the world’s wetlands have Ecosystem services are the been lost benefits that people obtain from ecosystems 30% of coral reefs have been seriously damaged through fishing, pollution, disease and coral bleaching Examples include food, freshwater, timber, climate regulation, protection from In the past two decades 35% of mangroves natural hazards, erosion have disappeared control, pharmaceutical ingredients, clean air Rates of species extinction are 1000 times recreation etc. more rapid than the natural rate The economics of ecosystems and biodiversity European Commission, 2008
- 69. Ocean ecosystems High productivity in the Southern Ocean Least exploited fishery
- 72. The unknown The deep sea Lakes and river systems under the ice
- 73. The carbon cycle Woods Hole Research Centre, 2007
- 74. Hudson Mountain Subglacial Volcano Estimated date of eruption - 220 BC King et al, in prep.
- 75. Is the IPCC Conservative? Comparison of reality with IPCC 2001 predictions Rahmstorf et al. 2007
- 76. BAS Mission • to undertake a world-class programme of science • to sustain for the UK an active and influential regional presence, and a leadership role in Antarctic affairs
- 77. Broader Context
- 79. BAS in Summary 60 yr history Approx 500 staff Annual budget approx £40 M Science Logistics Stations
- 80. The greenhouse effect – a misnomer? The ‘greenhouse’ effect has been understood Transmission of visible for nearly 200 years light and infrared radiation the same The ‘natural’ CO2 keeps the Earth around 30°C warmer than it would otherwise be Greenhouses work by lack of convection
- 81. Survey by BAS and University of Texas, 2005
- 82. Pine Island Season 2006-07 Ice accessible for discharge ~1.5m msl equivalent
- 83. Harlequin Ladybird 2004 2005 2006 2007
- 84. Impacts of climate change and mankind 2000 Wandering albatross 1600 1200 - 1% decline p.a. (pre-1997) 800 - 4% decline p.a. (post-1997) 1960 1964 1972 1976 1980 1984 1988 1992 1996 2000 2004 2008 80% reduction of krill in 30 years – key food for birds, seals and whales By catch
- 85. Ecology Evolution Physiology and molecular processes
- 86. Precipitation changes Frost changes
- 87. Gentoo penguin breeding success at Bird Island Years of extremely low performance 1.0 Breeding Success at Bird Island 0.8 0.6 0.4 0.2 0.0 1985 1990 1995 2000 Year
- 88. Long term trend 1976-2004 The interconnected world
- 89. Southern Ocean Ecosystem • Clear link between warm conditions and breeding failure in penguins, seals and whales • Long-term decline in krill abundance • New interest in krill fishing - aquaculture, pharma and neutraceuticals • The largest under-exploited protein resource - managing sustainable fishing critical
- 90. Lake Faguibine, Mali 1974 2005 590 km 2 in 1974 traditional livelihoods of fishing, Red= vegetation agriculture, and livestock herding became impractical
- 91. Tipping points Tipping points Subsystems indicated could exhibit threshold-type behaviour in response to anthropogenic climate forcing, where a small perturbation at a critical point qualitatively alters the future fate of the system. Lenton, T. M. et al. (2008) Proc. Natl. Acad. Sci. USA 105, 1786-1793
- 92. Fisheries In 2002 fish provided more than 2.6 billion people with at least 20 percent of their average per capita animal protein intake • Over exploitation • Global problem • Ecosystem change • By-catch Convention on the Conservation of Antarctic Marine Living Resources
- 93. CO2 emissions (GtC/y) World Carbon dioxide increases CO2 emissions increase N. America -1 1990s 1.3% y 2000-2006 3.3% y-1 W. EU CO2 growth rate 65±16% from increasing global economic activity 17±6% from the increasing carbon intensity of the global economy 18±15% from the increase in airborne fraction China Canadell et at., PNAS, 2007 India data source: CDIAC and EIA