SlideShare uma empresa Scribd logo
1 de 4
Baixar para ler offline
Q4 2011 | INDUSTRIAL


GREATER COLUMBUS REGION

INDUSTRIAL TRENDS REPORT


                                                                                        Growth, Expansion Marks 2011
                                                                                        INDUSTRIAL MARKET OVERVIEW
                                                                                        The fourth quarter continued in positive growth from the second and third quarters with 52,000
                                                                                        square feet of positive absorption. The largest movement in absorption was expected from Mars
                                                                                        Petcare moving out of more than 700,000 square feet in two separate facilities, 3051 Creekside and
                                                                                        3800 Groveport Road. With the completion of their new 1.3 million square foot facility last quarter,
                                                                                        some large negative absorption was expected. Instead, Zulily took 737,741 square feet at 3051
                                                                                        Creekside driving 130,000 square feet of absorption. The new lease occurred while Allianz Life
MARKET INDICATORS                                                                       Insurance Co. was under contract to sell property as a part of a portfolio sale to KTR Capital Partners.
                                                 Q3                Q4
                                                                                        FORECASTS AND REFLECTION
                                             2011*               2011**
                                                                                        •	 There were six significant investment sales                        Albany is Knowlton’s 240,000-square-foot
                       VACANCY                                                           (sales with full occupancy) in the Columbus                          facility, Axium Plastic’s 110,000 square foot
                                                                                         market. STAG Industrial purchased the                                facility, and Pizzuti’s 303,000-square-foot
       NET ABSORPTION                                                                    385,000-square-foot 1120 Morrison Road for                           speculative warehouse. Pizzuti’s construction
            CONSTRUCTION
                                                                                         $7.8 million, 9.0 percent cap rate. KTR Capital                      continues for MBM in Groveport as well with
                                                                                         Partners purchased five properties        from                       approximately 125,000 square feet.
             RENTAL RATES                        —                 —                     Allianz Life Insurance Co. as part of an 18                        •	 Tenants are optimistic about growing consumer
                                                                                         property sale. The Columbus transfer totalled                        demand, but cautious in expanding their lease
            *Actual change from previous quarter
                                                                                         2.5 million square feet for $62 million.                             for long terms (5+ years). Companies are still
            **Projected change from previous quarter
                                                                                        •	 VeePak   completed its 105,000-square-foot                         leery of another slowdown.
                                                                                         facility in New Albany. Still underway in New
                                                                                                                                                                                          RENTAL RATES
                                                                                          PROPERTY TYPE VACANCY RATES OVER COMPLETIONS
WEIGHTED AVERAGE RENTAL RATES
                                                                                                                                                                                          Asking rental rates remained
Rates for the Major Product Types
                                                                                          17.0                                                                              2,500,000     stable from last quarter.
       $7
2.5                                                                     $2.20             16.0                                                                              2,000,000     Supply has decrease over the
                                                                        $2.15
                                                                                          15.0                                                                              1,500,000
                                                                                                                                                                                          past two quarters by 1.6
2.0 $6
                                                                        $2.10
                                                                                                                                                                                          percent points, from 13.5 to
                                                                        $2.05             14.0                                                                              1,000,000
 1.5                                                                                                                                                                                      11.8 percent.
       $5                                                               $2.00
 1.0
                                                                                          13.0                                                                              500,000
                                                                        $1.95
                                                                        $1.90             12.0                                                                              0
0.5 $4
                                                                        $1.85
                                                                                          11.0                                                                              (500,000)
  0                                                                     $1.80
       $33Q07    4Q07 1Q08 2Q08 3Q08 4Q08 1Q09 2Q09 3Q10 4Q10
                                                                                          10.0                                                                              (1,000,000)

       $2                                                                                  9.0                                                                              (1,500,000)
            3Q   4Q    1Q   2Q    3Q   4Q   1Q   2Q    3Q   4Q    1Q    2Q   3Q    4Q
            08   08    09   09    09   09   10   10    10   10    11    11   11    11      8.0                                                                              (2,000,000)
                 General Industrial         R&D/Flex             Warehouse/Dist.                   3Q   4Q 1Q   2Q 3Q 4Q      1Q 2Q       3Q   4Q 1Q    Q2 Q3      Q4
                                                                                          1	       08    5	
                                                                                                        08 09   09 10	 09
                                                                                                                    09        10 15	10    10    20	
                                                                                                                                               10 11    11 25	
                                                                                                                                                            11     11       30	
                                                                                                          Completions       Absorptions         Total Market Vacancy Rate


www.colliers.com/columbus
RESEARCH & FORECAST REPORT   |   Q4 2011  |  INDUSTRIAL   |   GREATER COLUMBUS REGION


                        Delaware                                             REGIONAL INDUSTRIAL ECONOMICS                                      October, with an increase of 1.8 percent year
                        County
 Union                                                                       The Federal Reserve Bank of Cleveland reports                      over year. Mining, logging and construction
 County
                                                                             at least once a quarter in the Federal Reserve’s                   decreased by 1,000 employees from October
                         North
                                                                             Beige Book about the economic activity of the                      and is up 13.9 percent year over year.
                                                   Licking
Madison
County                                             County                    fourth district, which includes the Columbus
                                    East
                                                                             Metropolitan Statistical Area (MSA). The Beige                     ASKING RATES
            West
                                                                             Book from January 2011 reported that industrial                    Average asking rental rates increased slightly
                         CBD                                                 activity in the fourth district grew at a slow pace                from the second quarter. R&D/Flex space
                                                                             in the six weeks previous to January 11. Freight                   increased by $0.38; general industrial decreased
            Southwest              Southeast
                                                  Fairfield
                                                                             transportation executives reported that transport                  by $0.17; and warehouse/distribution by $0.01.
                                                  County                     volume slowed along seasonal trends. Capital                       General industrial prices did not change
            Pickaway County                                                  outlays are expected to increase during 2012 for                   significantly but the amount of available space at
                                                                             fleet expansion and replacement of aging                           higher prices did change. The R&D/Flex
The Columbus industrial market consists                                      equipment.                                                         increased substantially due to the actual change
of 10 suburban submarkets and the
                                                                                                                                                in prices, the median price increased only by
Central Business District. The total
inventory for the region is 213 million                                      Manufacturers reported that new orders were                        $0.20 and the non-weighted mean increased
square feet of space                                                         mainly stable with any declines due to seasonal                    only by $0.10. As stated in the Q3 Market Report,
                                                                             factors. Demand is being driven by auto, energy                    the market has likely seen the end of bottoming
                                                                             and heavy equipment industries. Manufacturers                      prices and we expect that there will be slight
                                                                             remained committed to capital spending plans                       increases to asking rates.
                                                                             for 2012. Capacity utilization was below normal
                                                                             for all industries except for steel production.                    MARKET INTEL
                                                                             Hiring continued at a modest pace, but managers                    Market Activity Volume is the sum of the
                                                                             found it difficult to find high-skilled and                        absolute value of each absorption change in the
                                                                             professional workers.                                              market. It tells us a little more about what
                                                                                                                                                exactly happened to the market behind the
                                                                             The Bureau of Labor Statistics reported that                       absorption number. The Market Activity Volume
                                                                             manufacturing employment of 63,100 employees                       was 3,654,787 square feet. With only 52,000
                                                                             in November which was an increase of 800 over                      feet absorbed, the market seems to be settling
                                                                             October. Year over year manufacturing is down                      from the past two quarters, where large positive
                                                                             by 0.3 percent. Trade, transportation and utilities                gains dominated the movement in the market.
                                                                             employment grew by 5,700 employees from

 MARKET ACTIVITY

 SALES ACTIVITY

 PROPERTY ADDRESS                  SALES DATE            SALE PRICE          SIZE SF        GRANTOR                         GRANTEE                       PRICE / SF    TYPE          SUBMARKET
 6766 Pontius Road                 November             $17,000,000          754,000        Allianz Life Insurance Co       KTR Capital Partners           $22.55       Ware./Dist.   Southeast
 3051 Creekside                    November             $18,500,000          737,000        Allianz Life Insurance Co       KTR Capital Partners           $25.10       Ware./Dist.   Southeast

 Parkway
 6250 Opus Drive                   October              $13,739,300          676,564        CBRE Realty Trust               Exeter Property Group          $20.31       Ware./Dist.   Southeast
 5820 Opus Drive                   November             $10,300,000          406,694        Allianz Life Insurance Co       KTR Capital Partners           $25.33       Ware./Dist.   Southeast
 1120 Morrison Road                October              $7,800,000           385,655        Hollingsworth Capital Partner   STAG Industrial                $20.23       Ware./Dist.   East
 5765 N Green Pointe               November             $8,900,000           358,760        Allianz Life Insurance Co       KTR Capital Partners           $24.81       Ware./Dist.   Southeast

 Drive
 5650 Green Pointe Drive           November             $7,300,000           270,000        Allianz Life Insurance Co       KTR Capital Partners           $27.04       Ware./Dist.   Southeast
 4252 Groves Road                  December             $2,225,000           208,000        4252 Groves Road Equities       City of Columbus               $10.70       Ware./Dist.   Southeast

 LEASE ACTIVITY

 PROPERTY ADDRESS                              LEASE SF               LESSOR                              LESSEE                   ASKING PRICE (NNN)        TYPE                     SUBMARKET
 3051 Creekside Parkway                        737,471                Allianz Life Insurance Co.          Zulily                   $3.25                     Warehouse/Distribution   Southeast
 3425 Urbancrest Industrial Dr                 188,000                Security Capital Industrial Trust   Round 2                  -                         Warehouse/Distribution   Southwest
 3420 Urbancrest Industrial Drive              88,024                 ProLogis Trust                      Exel                     $2.95                     Warehouse/Distribution   Southwest
 111 Enterprise Drive                          65,000                 Paragano Nazario                    P.A.C.                   $2.70                     Warehouse/Distribution   Licking
 2235 Southwest Boulevard                      48,488                 Industrial Southpark Owner LLC      Cinco Electric           $3.10 (MG)                R&D/Flex                 Southwest


P. 2      | COLLIERS INTERNATIONAL
RESEARCH & FORECAST REPORT   |   Q4 2011  |  INDUSTRIAL   |   GREATER COLUMBUS REGION

UPDATE      Market Comparisons

INDUSTRIAL MARKET
                                                                                   Net Absorption                     Construction                     Asking Rental Rates
SUBMARKET                        Total SF      Vacant SF    Vacancy %   Current Quarter      Year-to-date   Current           Completions          WH/Dist              R&D/Flex
CBD                              5,907,062     685,817      11.6        30,500               392,858        -                 -                    -                      $6.59
EAST                             20,682,243    4,238,914    20.5        1,756                (463,580)      -                 -                     $3.25                 $6.00
FAIRFIELD                        6,771,842     617,675      9.1         (293,548)            (214,948)      -                 -                     $4.00                 $6.90
LICKING                          18,832,930    1,297,016    6.9         65,000               402,874        773,000           105,000               $2.90               -
MADISON                          8,148,397     -            0.0         -                    -              -                 -                    -                    -
NORTH                            16,747,138    1,589,882    9.5         (22,600)             (124,468)      -                 70,000                $3.18                 $5.16
NORTH DELAWARE                   9,132,849     1,057,267    11.6        (5,633)              (175,016)      -                 -                     $2.99                 $6.75
PICKAWAY                         3,550,850     71,900       2.0         -                    -              -                 -                     $2.48               -
SOUTHEAST                        64,181,757    10,347,192   16.1        (263,857)            920,384        125,000           -                     $2.62                 $3.22
SOUTHWEST                        17,683,127    1,156,899    6.5         319,581              468,991        -                 -                     $2.92                 $4.45
UNION                            6,333,817     362,765      5.7         143,800              151,032        -                 -                    -                      $4.33
WEST                             35,935,786    3,933,936    10.9        77,162               1,731,891      -                 -                     $2.34                 $4.31
TOTALS                           213,907,798   25,359,263   11.9        52,161               3,090,018      898,000           175,000               $2.69                 $4.66


                                                                                   Net Absorption                     Construction                     Asking Rental Rates
SUBMARKET                        Total SF      Vacant SF    Vacancy %   Current Quarter      Year-to-date   Current           Completions          By Product Type
R&D/FLEX                         20,280,125    3,044,234    15.0        175,908              574,599        -                 70,000                $4.66

GENERAL INDUSTRIAL               71,945,139    5,890,939    8.2         147,147              295,603        428,000           -                     $3.07

WAREHOUSE/                       121,752,534   16,424,090   13.5        (270,894)            2,219,816      470,000           105,000               $2.69

DISTRIBUTION
TOTALS                           213,977,798   25,359,263   11.9        52,161               3,090,018      898,000           175,000               $2.99


QUARTERLY COMPARISON AND TOTALS
                                                                                    Net Absorption                      Construction                        Asking Rental Rates
QUARTER, YEAR                    Total SF      Vacant SF    Vacancy %   Current Quarter Year-to-date        Current               Completions                     ($)
Q3, 2011                         213,802,798   25,411,424   11.9        1,286,321            3,037,857      1,003,000             1,800,000                       $2.80
Q2, 2011                         211,998,240   26,697,745   12.6        2,113,899            1,751,536      1,992,000             -                               $2.80
Q1, 2011                         211,923,599   28,974,755   13.5        (362,363)            (362,363)      1,992,000             -                               $2.72
Q4, 2010                         205,420,829   26,113,915   12.7        743,685              (766,901)      1,575,000             (536,292)                       $2.57


                                                                                                                                      CONSTRUCTION
                                                                                                                                      McGraw-Hill Construction’s most recent
                                                                                                                                      report showed construction starts
                                                                                                                                      for commercial, industrial, hotel and
                                                                                                                                      institutional projects increased to $50
                                                                                                                                      million in the eight-county region in
                                                                                                                                      September to $50 million, from $42.74
                                                                                                                                      million in September 2010. The year to
                                                                                                                                      date total of nonresidential construction
                                                                                                                                      contracts through the first nine months
                                                                                                                                      of 2011 fell to $784.83 million which is
                                                                                                                                      26 percent below 2010’s $1.07 billion.


                                                                                                                                              COLLIERS INTERNATIONAL |             P. 3
RESEARCH & FORECAST REPORT   |   Q4 2011  |  INDUSTRIAL   |   GREATER COLUMBUS REGION


CENTRAL BUSINESS DISTRICT                            feet of 3800 Groveport Road. Exel vacated
                                                     173,457 square feet 6360 Port Road.
The Central Business District (CBD) added
30,500 square feet of positive absorption in the
                                                                                                           512 offices in
fourth quarter. The vacancy rate has steadily
                                                     Construction    continues     on     Pizzuti’s
                                                     125,000-square-foot facility for MBM in
                                                                                                           61 countries on
fallen over the past five quarters by 665 basis
points to 11.6 percent. Buckeye Diamond
                                                     Groveport at 2240 Creekside Parkway.                  6 continents
Logistics took 16,500 square feet at Techsouth
                                                     SOUTH                                                 United States: 125
C.                                                                                                         Canada: 38
                                                     The southern submarkets are Pickaway and              Latin America: 18
EAST                                                 Fairfield counties. Fairfield lost 316,000 square     Asia Pacific: 214
                                                     feet at 411 Ewing Street. No changes were             EMEA: 117
The submarkets comprising eastern Columbus           recorded in Pickaway.
are East and Licking County. Construction has                                                             •	$1.5   billion in annual revenue
been completed for VeePak’s 105,000 square                                                                •	978.6 million square feet under
                                                     SOUTHWEST                                             management
foot facility as well as the 70,000 square feet of
                                                     The Southwest submarket showed absorption of
Pharmaforce’s new R&D/Flex facility.                                                                      •	Over 12,500 professionals
                                                     319,581 square feet. The largest gains in
                                                     absorption came from Round 2 moving into
Quebec Ontario-based KDC is expected to                                                                    UNITED STATES:
                                                     188,000 square feet of 3425 Urbancrest
complete its 240,000-square-foot building in
                                                     Industrial Drive. Exel moved into 88,000 square       Columbus
spring 2012. Mississauga, Canada-based Axium
                                                     feet of 3420 Urbancrest Industrial Drive from         Richard B. Schuen SIOR CCIM
Plastics will complete a 110,000-square-foot                                                               CEO | Principal | Columbus
                                                     the Southeast submarket. Cinco Electric
facility in spring 2012, employing 165.                                                                    8800 Lyra Drive
                                                     absorbed 48,488 square feet of 2235 Southwest
Construction      continues     on    Pizzuti’s                                                            Suite # 150
                                                     Boulevard through purchase.                           Columbus, Ohio 43240
303,000-square-foot      speculative   building
                                                                                                           TEL +1 614 410 5612
planned for spring 2012. Sonoco is constructing
                                                     WEST
a 120,000-square-foot facility and is also
expected to be completed in 2012.                    The submarkets on the west side of Franklin
                                                                                                           Leslie Hobbs
                                                     county are West, Madison and Union. The West          Marketing and Research Manager
NORTH                                                gained marginally with 3701 Lacon Road, which         8800 Lyra Drive
                                                     was sold to an owner/user. Aoki Manufacturing         Suite #150
The submarkets comprising northern Columbus                                                                Columbus, Ohio, 43240
                                                     absorbed 55,470 square feet after purchasing
are North and North Delaware. Both submarkets                                                              TEL +1 614 410 5640
                                                     1705 Atlas Street.
lost a small amount of occupancy this quarter. In
the North, DRC Automation moved out of 20,540
                                                     YEAR END WRAP-UP                                      Jonathan Badgley
square feet at 7830-7832 North Central Drive.
                                                     The Columbus industrial market strengthened           Research Analyst
Carmel Pharma who had been leasing 13,120                                                                  175 South Third Street
square feet at 7029 Huntley was bought out and       throughout 2011. Strong leasing in the second         Suite # 285
has been closed. In North Delaware, Granite Co.      quarter and third quarter of 2,113,899 and            Columbus, Ohio 43201
moved out of 15,673 square feet of space.            1,286,321 square feet respectively, drove the         TEL +1 614 437 4495
Oxywater moved into 19,140 square feet at 8255       vacancy rate down 160 basis points.
Green Meadows Drive.
                                                     In 2010, the market had lost more than 2.5
SOUTHEAST                                            million square feet of industrial space from the
                                                     demolitions of a Big Bear distribution facility on    This document/email has been prepared by Colliers
The Southeast submarket incurred 263,857                                                                   International for advertising purposes. Colliers
                                                     3rd Avenue in Grandview and a property located        International statistics and data are audited annually and
square feet of negative absorption. 2175 Broehm
                                                     at 200 Georgesville Road. In 2011, however, the       may result in revisions to previously reported quarterly
Road was purchased by an owner user adding                                                                 and final year-end figures. Sources include Columbus
                                                     market gained 1,975,000 square feet with              Dispatch, Business First, Xceligent, and the Wall Street
203,000 to occupancy. 3051 Creekside Parkway
                                                     898,000 square feet still under construction in       Journal.
has been fully leased by Zulily netting 130,000
                                                     2012.
square feet of absorption. 1662 Williams Road
was purchased by an owner user and added
                                                     The largest leases of the year were Thirty-One
96,034 square feet to occupancy. 4333 Directors
                                                     Gifts leasing 750,000 square feet at 4545 Fisher
Boulevard was purchased by an owner user
                                                     Road; Zulily, leasing 737,000 square feet at 3051
adding 43,460 to occupancy.
                                                     Creekside Parkway; and Sperian, leasing
                                                     500,000 square feet at 6766 Pontius Road.
Significant negative absorption came from Mars
Petcare’s vacancy of more than 700,000 square                                                                        Accelerating success.


www.colliers.com/columbus

Mais conteúdo relacionado

Destaque

Digital Pulse Quarter 2 Summer 2010
Digital Pulse Quarter 2 Summer 2010Digital Pulse Quarter 2 Summer 2010
Digital Pulse Quarter 2 Summer 2010Principals
 
Discover pcbc 2011 presentation
Discover pcbc 2011 presentationDiscover pcbc 2011 presentation
Discover pcbc 2011 presentationsoonerswin
 
Dealing With Divergences - Blackrock 2015 Outlook
Dealing With Divergences - Blackrock 2015 OutlookDealing With Divergences - Blackrock 2015 Outlook
Dealing With Divergences - Blackrock 2015 OutlookJoão Pinto
 
Socializing Your Brand: Why social media should inform branding - and vice-versa
Socializing Your Brand: Why social media should inform branding - and vice-versaSocializing Your Brand: Why social media should inform branding - and vice-versa
Socializing Your Brand: Why social media should inform branding - and vice-versaOff Madison Ave
 
Hugh Possingham- Why Monitor the Environment
Hugh Possingham- Why Monitor the EnvironmentHugh Possingham- Why Monitor the Environment
Hugh Possingham- Why Monitor the EnvironmentUniversity of Adelaide
 

Destaque (8)

Hoardings in Mumbai - Global Advertisers
Hoardings in Mumbai - Global AdvertisersHoardings in Mumbai - Global Advertisers
Hoardings in Mumbai - Global Advertisers
 
Digital Pulse Quarter 2 Summer 2010
Digital Pulse Quarter 2 Summer 2010Digital Pulse Quarter 2 Summer 2010
Digital Pulse Quarter 2 Summer 2010
 
INDECENTES, SIN MAS
INDECENTES, SIN MASINDECENTES, SIN MAS
INDECENTES, SIN MAS
 
Jaipur media
Jaipur mediaJaipur media
Jaipur media
 
Discover pcbc 2011 presentation
Discover pcbc 2011 presentationDiscover pcbc 2011 presentation
Discover pcbc 2011 presentation
 
Dealing With Divergences - Blackrock 2015 Outlook
Dealing With Divergences - Blackrock 2015 OutlookDealing With Divergences - Blackrock 2015 Outlook
Dealing With Divergences - Blackrock 2015 Outlook
 
Socializing Your Brand: Why social media should inform branding - and vice-versa
Socializing Your Brand: Why social media should inform branding - and vice-versaSocializing Your Brand: Why social media should inform branding - and vice-versa
Socializing Your Brand: Why social media should inform branding - and vice-versa
 
Hugh Possingham- Why Monitor the Environment
Hugh Possingham- Why Monitor the EnvironmentHugh Possingham- Why Monitor the Environment
Hugh Possingham- Why Monitor the Environment
 

Semelhante a Q4 2011 - Columbus Industrial

Columbus OH Office Trends Q3 2011
Columbus OH Office Trends Q3 2011Columbus OH Office Trends Q3 2011
Columbus OH Office Trends Q3 2011colliersohio
 
Q4 2011 - Columbus Retail
Q4 2011 - Columbus RetailQ4 2011 - Columbus Retail
Q4 2011 - Columbus Retailcolliersohio
 
Q4 2011 - Cincinnati Industrial
Q4 2011 - Cincinnati IndustrialQ4 2011 - Cincinnati Industrial
Q4 2011 - Cincinnati Industrialcolliersohio
 
Suburban Maryland 3Q12 Office Snapshot
Suburban Maryland 3Q12 Office SnapshotSuburban Maryland 3Q12 Office Snapshot
Suburban Maryland 3Q12 Office Snapshotkottmeier
 
Q1 2012 - Cincinnati Office
Q1 2012 - Cincinnati OfficeQ1 2012 - Cincinnati Office
Q1 2012 - Cincinnati Officecolliersohio
 
Q1 2012 - Cincinnati Industrial
Q1 2012 - Cincinnati IndustrialQ1 2012 - Cincinnati Industrial
Q1 2012 - Cincinnati Industrialcolliersohio
 
March 2011 Office Notes
March 2011 Office NotesMarch 2011 Office Notes
March 2011 Office Noteselsantos
 
Bridge Properties Real Report Q1 2011 T
Bridge  Properties    Real  Report  Q1 2011  TBridge  Properties    Real  Report  Q1 2011  T
Bridge Properties Real Report Q1 2011 Tbrisgecre
 
Bridge Properties Real Report Q1 2011 T
Bridge  Properties    Real  Report  Q1 2011  TBridge  Properties    Real  Report  Q1 2011  T
Bridge Properties Real Report Q1 2011 Tbrisgecre
 
Q1 2012 - Columbus Retail
Q1 2012 - Columbus RetailQ1 2012 - Columbus Retail
Q1 2012 - Columbus Retailcolliersohio
 
Cbre dubai market view q1 2010
Cbre  dubai market view q1 2010Cbre  dubai market view q1 2010
Cbre dubai market view q1 2010asaidali
 
Cincinnati OH Office Trends Q3 2011
Cincinnati OH Office Trends Q3 2011Cincinnati OH Office Trends Q3 2011
Cincinnati OH Office Trends Q3 2011colliersohio
 
Houston Office Market Report Q2 2012
Houston Office Market Report Q2 2012Houston Office Market Report Q2 2012
Houston Office Market Report Q2 2012Coy Davidson
 
Kite Realty Group Q2 2010 Investor Presentation
Kite Realty Group Q2 2010 Investor PresentationKite Realty Group Q2 2010 Investor Presentation
Kite Realty Group Q2 2010 Investor Presentationdbuell_kite
 
Q1 2012 - Columbus Office
Q1 2012 - Columbus OfficeQ1 2012 - Columbus Office
Q1 2012 - Columbus Officecolliersohio
 
The Knowledge Report Beijing Office 2 Q2011
The Knowledge Report   Beijing Office 2 Q2011The Knowledge Report   Beijing Office 2 Q2011
The Knowledge Report Beijing Office 2 Q2011serstad
 
Downtown Chicago Report
Downtown Chicago ReportDowntown Chicago Report
Downtown Chicago Reportjonathanrutman
 
Q4 2011 - Cincinnati Office
Q4 2011 - Cincinnati OfficeQ4 2011 - Cincinnati Office
Q4 2011 - Cincinnati Officecolliersohio
 
East bay office & flex space 1 q10 market report dp
East bay office & flex space 1 q10 market report dpEast bay office & flex space 1 q10 market report dp
East bay office & flex space 1 q10 market report dpdanielpivnick
 
Addressing Anaerobic Digestion financial issues
Addressing Anaerobic Digestion financial issuesAddressing Anaerobic Digestion financial issues
Addressing Anaerobic Digestion financial issuesIona Capital
 

Semelhante a Q4 2011 - Columbus Industrial (20)

Columbus OH Office Trends Q3 2011
Columbus OH Office Trends Q3 2011Columbus OH Office Trends Q3 2011
Columbus OH Office Trends Q3 2011
 
Q4 2011 - Columbus Retail
Q4 2011 - Columbus RetailQ4 2011 - Columbus Retail
Q4 2011 - Columbus Retail
 
Q4 2011 - Cincinnati Industrial
Q4 2011 - Cincinnati IndustrialQ4 2011 - Cincinnati Industrial
Q4 2011 - Cincinnati Industrial
 
Suburban Maryland 3Q12 Office Snapshot
Suburban Maryland 3Q12 Office SnapshotSuburban Maryland 3Q12 Office Snapshot
Suburban Maryland 3Q12 Office Snapshot
 
Q1 2012 - Cincinnati Office
Q1 2012 - Cincinnati OfficeQ1 2012 - Cincinnati Office
Q1 2012 - Cincinnati Office
 
Q1 2012 - Cincinnati Industrial
Q1 2012 - Cincinnati IndustrialQ1 2012 - Cincinnati Industrial
Q1 2012 - Cincinnati Industrial
 
March 2011 Office Notes
March 2011 Office NotesMarch 2011 Office Notes
March 2011 Office Notes
 
Bridge Properties Real Report Q1 2011 T
Bridge  Properties    Real  Report  Q1 2011  TBridge  Properties    Real  Report  Q1 2011  T
Bridge Properties Real Report Q1 2011 T
 
Bridge Properties Real Report Q1 2011 T
Bridge  Properties    Real  Report  Q1 2011  TBridge  Properties    Real  Report  Q1 2011  T
Bridge Properties Real Report Q1 2011 T
 
Q1 2012 - Columbus Retail
Q1 2012 - Columbus RetailQ1 2012 - Columbus Retail
Q1 2012 - Columbus Retail
 
Cbre dubai market view q1 2010
Cbre  dubai market view q1 2010Cbre  dubai market view q1 2010
Cbre dubai market view q1 2010
 
Cincinnati OH Office Trends Q3 2011
Cincinnati OH Office Trends Q3 2011Cincinnati OH Office Trends Q3 2011
Cincinnati OH Office Trends Q3 2011
 
Houston Office Market Report Q2 2012
Houston Office Market Report Q2 2012Houston Office Market Report Q2 2012
Houston Office Market Report Q2 2012
 
Kite Realty Group Q2 2010 Investor Presentation
Kite Realty Group Q2 2010 Investor PresentationKite Realty Group Q2 2010 Investor Presentation
Kite Realty Group Q2 2010 Investor Presentation
 
Q1 2012 - Columbus Office
Q1 2012 - Columbus OfficeQ1 2012 - Columbus Office
Q1 2012 - Columbus Office
 
The Knowledge Report Beijing Office 2 Q2011
The Knowledge Report   Beijing Office 2 Q2011The Knowledge Report   Beijing Office 2 Q2011
The Knowledge Report Beijing Office 2 Q2011
 
Downtown Chicago Report
Downtown Chicago ReportDowntown Chicago Report
Downtown Chicago Report
 
Q4 2011 - Cincinnati Office
Q4 2011 - Cincinnati OfficeQ4 2011 - Cincinnati Office
Q4 2011 - Cincinnati Office
 
East bay office & flex space 1 q10 market report dp
East bay office & flex space 1 q10 market report dpEast bay office & flex space 1 q10 market report dp
East bay office & flex space 1 q10 market report dp
 
Addressing Anaerobic Digestion financial issues
Addressing Anaerobic Digestion financial issuesAddressing Anaerobic Digestion financial issues
Addressing Anaerobic Digestion financial issues
 

Mais de colliersohio

Q1 2013 Columbus Market Trends Retail
Q1 2013 Columbus Market Trends RetailQ1 2013 Columbus Market Trends Retail
Q1 2013 Columbus Market Trends Retailcolliersohio
 
Q1 2013 Columbus Market Trends Office
Q1 2013 Columbus Market Trends OfficeQ1 2013 Columbus Market Trends Office
Q1 2013 Columbus Market Trends Officecolliersohio
 
Q4 2012 Columbus Market Trends Office
Q4 2012 Columbus Market Trends OfficeQ4 2012 Columbus Market Trends Office
Q4 2012 Columbus Market Trends Officecolliersohio
 
Q42012 Cincinnati Market Tr
Q42012 Cincinnati Market TrQ42012 Cincinnati Market Tr
Q42012 Cincinnati Market Trcolliersohio
 
Q4 2012 Cincinnati Market Trends Industrial
Q4 2012 Cincinnati Market Trends IndustrialQ4 2012 Cincinnati Market Trends Industrial
Q4 2012 Cincinnati Market Trends Industrialcolliersohio
 
Q4 2012 Columbus Retail Market Trends
Q4 2012 Columbus Retail Market TrendsQ4 2012 Columbus Retail Market Trends
Q4 2012 Columbus Retail Market Trendscolliersohio
 
Q2 2012 Columbus Office Market Trends
Q2 2012 Columbus Office Market TrendsQ2 2012 Columbus Office Market Trends
Q2 2012 Columbus Office Market Trendscolliersohio
 
Q4 2011 - Columbus Office
Q4 2011 - Columbus OfficeQ4 2011 - Columbus Office
Q4 2011 - Columbus Officecolliersohio
 
Columbus Knowledge thats Sells March 2012
Columbus Knowledge thats Sells March 2012 Columbus Knowledge thats Sells March 2012
Columbus Knowledge thats Sells March 2012 colliersohio
 
Columbus Knowledge thats Sells January 2012
Columbus Knowledge thats Sells January 2012Columbus Knowledge thats Sells January 2012
Columbus Knowledge thats Sells January 2012colliersohio
 
Knowledge that Sells March 2012
Knowledge that Sells March 2012Knowledge that Sells March 2012
Knowledge that Sells March 2012colliersohio
 
Knowledge that Sells January 2012
Knowledge that Sells January 2012Knowledge that Sells January 2012
Knowledge that Sells January 2012colliersohio
 
Knowledge thats Sells February 2012
Knowledge thats Sells February 2012Knowledge thats Sells February 2012
Knowledge thats Sells February 2012colliersohio
 
Knowledge That Sells April 2012
Knowledge That Sells April 2012Knowledge That Sells April 2012
Knowledge That Sells April 2012colliersohio
 
December 2011 Retail Sales
December 2011 Retail SalesDecember 2011 Retail Sales
December 2011 Retail Salescolliersohio
 
US Office HIghlights Q3 2011
US Office HIghlights Q3 2011US Office HIghlights Q3 2011
US Office HIghlights Q3 2011colliersohio
 
US Industrial Highlights Q3 2011
US Industrial Highlights Q3 2011US Industrial Highlights Q3 2011
US Industrial Highlights Q3 2011colliersohio
 
US Retail Highlights Q3 2011
US Retail Highlights Q3 2011US Retail Highlights Q3 2011
US Retail Highlights Q3 2011colliersohio
 

Mais de colliersohio (20)

Q1 2013 Columbus Market Trends Retail
Q1 2013 Columbus Market Trends RetailQ1 2013 Columbus Market Trends Retail
Q1 2013 Columbus Market Trends Retail
 
Q1 2013 Columbus Market Trends Office
Q1 2013 Columbus Market Trends OfficeQ1 2013 Columbus Market Trends Office
Q1 2013 Columbus Market Trends Office
 
Q4 2012 Columbus Market Trends Office
Q4 2012 Columbus Market Trends OfficeQ4 2012 Columbus Market Trends Office
Q4 2012 Columbus Market Trends Office
 
Q42012 cColumb
Q42012 cColumbQ42012 cColumb
Q42012 cColumb
 
Q4 2012 Cincinna
Q4 2012 CincinnaQ4 2012 Cincinna
Q4 2012 Cincinna
 
Q42012 Cincinnati Market Tr
Q42012 Cincinnati Market TrQ42012 Cincinnati Market Tr
Q42012 Cincinnati Market Tr
 
Q4 2012 Cincinnati Market Trends Industrial
Q4 2012 Cincinnati Market Trends IndustrialQ4 2012 Cincinnati Market Trends Industrial
Q4 2012 Cincinnati Market Trends Industrial
 
Q4 2012 Columbus Retail Market Trends
Q4 2012 Columbus Retail Market TrendsQ4 2012 Columbus Retail Market Trends
Q4 2012 Columbus Retail Market Trends
 
Q2 2012 Columbus Office Market Trends
Q2 2012 Columbus Office Market TrendsQ2 2012 Columbus Office Market Trends
Q2 2012 Columbus Office Market Trends
 
Q4 2011 - Columbus Office
Q4 2011 - Columbus OfficeQ4 2011 - Columbus Office
Q4 2011 - Columbus Office
 
Columbus Knowledge thats Sells March 2012
Columbus Knowledge thats Sells March 2012 Columbus Knowledge thats Sells March 2012
Columbus Knowledge thats Sells March 2012
 
Columbus Knowledge thats Sells January 2012
Columbus Knowledge thats Sells January 2012Columbus Knowledge thats Sells January 2012
Columbus Knowledge thats Sells January 2012
 
Knowledge that Sells March 2012
Knowledge that Sells March 2012Knowledge that Sells March 2012
Knowledge that Sells March 2012
 
Knowledge that Sells January 2012
Knowledge that Sells January 2012Knowledge that Sells January 2012
Knowledge that Sells January 2012
 
Knowledge thats Sells February 2012
Knowledge thats Sells February 2012Knowledge thats Sells February 2012
Knowledge thats Sells February 2012
 
Knowledge That Sells April 2012
Knowledge That Sells April 2012Knowledge That Sells April 2012
Knowledge That Sells April 2012
 
December 2011 Retail Sales
December 2011 Retail SalesDecember 2011 Retail Sales
December 2011 Retail Sales
 
US Office HIghlights Q3 2011
US Office HIghlights Q3 2011US Office HIghlights Q3 2011
US Office HIghlights Q3 2011
 
US Industrial Highlights Q3 2011
US Industrial Highlights Q3 2011US Industrial Highlights Q3 2011
US Industrial Highlights Q3 2011
 
US Retail Highlights Q3 2011
US Retail Highlights Q3 2011US Retail Highlights Q3 2011
US Retail Highlights Q3 2011
 

Último

VIP Call Girl Jamshedpur Aashi 8250192130 Independent Escort Service Jamshedpur
VIP Call Girl Jamshedpur Aashi 8250192130 Independent Escort Service JamshedpurVIP Call Girl Jamshedpur Aashi 8250192130 Independent Escort Service Jamshedpur
VIP Call Girl Jamshedpur Aashi 8250192130 Independent Escort Service JamshedpurSuhani Kapoor
 
Progress Report - Oracle Database Analyst Summit
Progress  Report - Oracle Database Analyst SummitProgress  Report - Oracle Database Analyst Summit
Progress Report - Oracle Database Analyst SummitHolger Mueller
 
Creating Low-Code Loan Applications using the Trisotech Mortgage Feature Set
Creating Low-Code Loan Applications using the Trisotech Mortgage Feature SetCreating Low-Code Loan Applications using the Trisotech Mortgage Feature Set
Creating Low-Code Loan Applications using the Trisotech Mortgage Feature SetDenis Gagné
 
Pharma Works Profile of Karan Communications
Pharma Works Profile of Karan CommunicationsPharma Works Profile of Karan Communications
Pharma Works Profile of Karan Communicationskarancommunications
 
Yaroslav Rozhankivskyy: Три складові і три передумови максимальної продуктивн...
Yaroslav Rozhankivskyy: Три складові і три передумови максимальної продуктивн...Yaroslav Rozhankivskyy: Три складові і три передумови максимальної продуктивн...
Yaroslav Rozhankivskyy: Три складові і три передумови максимальної продуктивн...Lviv Startup Club
 
Sales & Marketing Alignment: How to Synergize for Success
Sales & Marketing Alignment: How to Synergize for SuccessSales & Marketing Alignment: How to Synergize for Success
Sales & Marketing Alignment: How to Synergize for SuccessAggregage
 
Keppel Ltd. 1Q 2024 Business Update Presentation Slides
Keppel Ltd. 1Q 2024 Business Update  Presentation SlidesKeppel Ltd. 1Q 2024 Business Update  Presentation Slides
Keppel Ltd. 1Q 2024 Business Update Presentation SlidesKeppelCorporation
 
Regression analysis: Simple Linear Regression Multiple Linear Regression
Regression analysis:  Simple Linear Regression Multiple Linear RegressionRegression analysis:  Simple Linear Regression Multiple Linear Regression
Regression analysis: Simple Linear Regression Multiple Linear RegressionRavindra Nath Shukla
 
The Coffee Bean & Tea Leaf(CBTL), Business strategy case study
The Coffee Bean & Tea Leaf(CBTL), Business strategy case studyThe Coffee Bean & Tea Leaf(CBTL), Business strategy case study
The Coffee Bean & Tea Leaf(CBTL), Business strategy case studyEthan lee
 
0183760ssssssssssssssssssssssssssss00101011 (27).pdf
0183760ssssssssssssssssssssssssssss00101011 (27).pdf0183760ssssssssssssssssssssssssssss00101011 (27).pdf
0183760ssssssssssssssssssssssssssss00101011 (27).pdfRenandantas16
 
A DAY IN THE LIFE OF A SALESMAN / WOMAN
A DAY IN THE LIFE OF A  SALESMAN / WOMANA DAY IN THE LIFE OF A  SALESMAN / WOMAN
A DAY IN THE LIFE OF A SALESMAN / WOMANIlamathiKannappan
 
BEST ✨ Call Girls In Indirapuram Ghaziabad ✔️ 9871031762 ✔️ Escorts Service...
BEST ✨ Call Girls In  Indirapuram Ghaziabad  ✔️ 9871031762 ✔️ Escorts Service...BEST ✨ Call Girls In  Indirapuram Ghaziabad  ✔️ 9871031762 ✔️ Escorts Service...
BEST ✨ Call Girls In Indirapuram Ghaziabad ✔️ 9871031762 ✔️ Escorts Service...noida100girls
 
Mondelez State of Snacking and Future Trends 2023
Mondelez State of Snacking and Future Trends 2023Mondelez State of Snacking and Future Trends 2023
Mondelez State of Snacking and Future Trends 2023Neil Kimberley
 
Grateful 7 speech thanking everyone that has helped.pdf
Grateful 7 speech thanking everyone that has helped.pdfGrateful 7 speech thanking everyone that has helped.pdf
Grateful 7 speech thanking everyone that has helped.pdfPaul Menig
 
Vip Dewas Call Girls #9907093804 Contact Number Escorts Service Dewas
Vip Dewas Call Girls #9907093804 Contact Number Escorts Service DewasVip Dewas Call Girls #9907093804 Contact Number Escorts Service Dewas
Vip Dewas Call Girls #9907093804 Contact Number Escorts Service Dewasmakika9823
 
VIP Call Girls In Saharaganj ( Lucknow ) 🔝 8923113531 🔝 Cash Payment (COD) 👒
VIP Call Girls In Saharaganj ( Lucknow  ) 🔝 8923113531 🔝  Cash Payment (COD) 👒VIP Call Girls In Saharaganj ( Lucknow  ) 🔝 8923113531 🔝  Cash Payment (COD) 👒
VIP Call Girls In Saharaganj ( Lucknow ) 🔝 8923113531 🔝 Cash Payment (COD) 👒anilsa9823
 
Mysore Call Girls 8617370543 WhatsApp Number 24x7 Best Services
Mysore Call Girls 8617370543 WhatsApp Number 24x7 Best ServicesMysore Call Girls 8617370543 WhatsApp Number 24x7 Best Services
Mysore Call Girls 8617370543 WhatsApp Number 24x7 Best ServicesDipal Arora
 
Cash Payment 9602870969 Escort Service in Udaipur Call Girls
Cash Payment 9602870969 Escort Service in Udaipur Call GirlsCash Payment 9602870969 Escort Service in Udaipur Call Girls
Cash Payment 9602870969 Escort Service in Udaipur Call GirlsApsara Of India
 
Insurers' journeys to build a mastery in the IoT usage
Insurers' journeys to build a mastery in the IoT usageInsurers' journeys to build a mastery in the IoT usage
Insurers' journeys to build a mastery in the IoT usageMatteo Carbone
 
M.C Lodges -- Guest House in Jhang.
M.C Lodges --  Guest House in Jhang.M.C Lodges --  Guest House in Jhang.
M.C Lodges -- Guest House in Jhang.Aaiza Hassan
 

Último (20)

VIP Call Girl Jamshedpur Aashi 8250192130 Independent Escort Service Jamshedpur
VIP Call Girl Jamshedpur Aashi 8250192130 Independent Escort Service JamshedpurVIP Call Girl Jamshedpur Aashi 8250192130 Independent Escort Service Jamshedpur
VIP Call Girl Jamshedpur Aashi 8250192130 Independent Escort Service Jamshedpur
 
Progress Report - Oracle Database Analyst Summit
Progress  Report - Oracle Database Analyst SummitProgress  Report - Oracle Database Analyst Summit
Progress Report - Oracle Database Analyst Summit
 
Creating Low-Code Loan Applications using the Trisotech Mortgage Feature Set
Creating Low-Code Loan Applications using the Trisotech Mortgage Feature SetCreating Low-Code Loan Applications using the Trisotech Mortgage Feature Set
Creating Low-Code Loan Applications using the Trisotech Mortgage Feature Set
 
Pharma Works Profile of Karan Communications
Pharma Works Profile of Karan CommunicationsPharma Works Profile of Karan Communications
Pharma Works Profile of Karan Communications
 
Yaroslav Rozhankivskyy: Три складові і три передумови максимальної продуктивн...
Yaroslav Rozhankivskyy: Три складові і три передумови максимальної продуктивн...Yaroslav Rozhankivskyy: Три складові і три передумови максимальної продуктивн...
Yaroslav Rozhankivskyy: Три складові і три передумови максимальної продуктивн...
 
Sales & Marketing Alignment: How to Synergize for Success
Sales & Marketing Alignment: How to Synergize for SuccessSales & Marketing Alignment: How to Synergize for Success
Sales & Marketing Alignment: How to Synergize for Success
 
Keppel Ltd. 1Q 2024 Business Update Presentation Slides
Keppel Ltd. 1Q 2024 Business Update  Presentation SlidesKeppel Ltd. 1Q 2024 Business Update  Presentation Slides
Keppel Ltd. 1Q 2024 Business Update Presentation Slides
 
Regression analysis: Simple Linear Regression Multiple Linear Regression
Regression analysis:  Simple Linear Regression Multiple Linear RegressionRegression analysis:  Simple Linear Regression Multiple Linear Regression
Regression analysis: Simple Linear Regression Multiple Linear Regression
 
The Coffee Bean & Tea Leaf(CBTL), Business strategy case study
The Coffee Bean & Tea Leaf(CBTL), Business strategy case studyThe Coffee Bean & Tea Leaf(CBTL), Business strategy case study
The Coffee Bean & Tea Leaf(CBTL), Business strategy case study
 
0183760ssssssssssssssssssssssssssss00101011 (27).pdf
0183760ssssssssssssssssssssssssssss00101011 (27).pdf0183760ssssssssssssssssssssssssssss00101011 (27).pdf
0183760ssssssssssssssssssssssssssss00101011 (27).pdf
 
A DAY IN THE LIFE OF A SALESMAN / WOMAN
A DAY IN THE LIFE OF A  SALESMAN / WOMANA DAY IN THE LIFE OF A  SALESMAN / WOMAN
A DAY IN THE LIFE OF A SALESMAN / WOMAN
 
BEST ✨ Call Girls In Indirapuram Ghaziabad ✔️ 9871031762 ✔️ Escorts Service...
BEST ✨ Call Girls In  Indirapuram Ghaziabad  ✔️ 9871031762 ✔️ Escorts Service...BEST ✨ Call Girls In  Indirapuram Ghaziabad  ✔️ 9871031762 ✔️ Escorts Service...
BEST ✨ Call Girls In Indirapuram Ghaziabad ✔️ 9871031762 ✔️ Escorts Service...
 
Mondelez State of Snacking and Future Trends 2023
Mondelez State of Snacking and Future Trends 2023Mondelez State of Snacking and Future Trends 2023
Mondelez State of Snacking and Future Trends 2023
 
Grateful 7 speech thanking everyone that has helped.pdf
Grateful 7 speech thanking everyone that has helped.pdfGrateful 7 speech thanking everyone that has helped.pdf
Grateful 7 speech thanking everyone that has helped.pdf
 
Vip Dewas Call Girls #9907093804 Contact Number Escorts Service Dewas
Vip Dewas Call Girls #9907093804 Contact Number Escorts Service DewasVip Dewas Call Girls #9907093804 Contact Number Escorts Service Dewas
Vip Dewas Call Girls #9907093804 Contact Number Escorts Service Dewas
 
VIP Call Girls In Saharaganj ( Lucknow ) 🔝 8923113531 🔝 Cash Payment (COD) 👒
VIP Call Girls In Saharaganj ( Lucknow  ) 🔝 8923113531 🔝  Cash Payment (COD) 👒VIP Call Girls In Saharaganj ( Lucknow  ) 🔝 8923113531 🔝  Cash Payment (COD) 👒
VIP Call Girls In Saharaganj ( Lucknow ) 🔝 8923113531 🔝 Cash Payment (COD) 👒
 
Mysore Call Girls 8617370543 WhatsApp Number 24x7 Best Services
Mysore Call Girls 8617370543 WhatsApp Number 24x7 Best ServicesMysore Call Girls 8617370543 WhatsApp Number 24x7 Best Services
Mysore Call Girls 8617370543 WhatsApp Number 24x7 Best Services
 
Cash Payment 9602870969 Escort Service in Udaipur Call Girls
Cash Payment 9602870969 Escort Service in Udaipur Call GirlsCash Payment 9602870969 Escort Service in Udaipur Call Girls
Cash Payment 9602870969 Escort Service in Udaipur Call Girls
 
Insurers' journeys to build a mastery in the IoT usage
Insurers' journeys to build a mastery in the IoT usageInsurers' journeys to build a mastery in the IoT usage
Insurers' journeys to build a mastery in the IoT usage
 
M.C Lodges -- Guest House in Jhang.
M.C Lodges --  Guest House in Jhang.M.C Lodges --  Guest House in Jhang.
M.C Lodges -- Guest House in Jhang.
 

Q4 2011 - Columbus Industrial

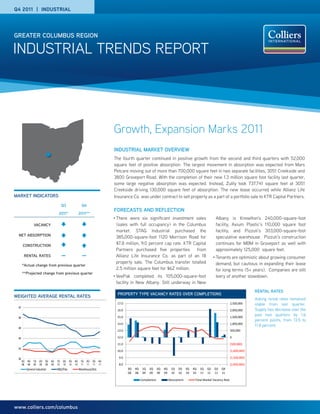
  • 1. Q4 2011 | INDUSTRIAL GREATER COLUMBUS REGION INDUSTRIAL TRENDS REPORT Growth, Expansion Marks 2011 INDUSTRIAL MARKET OVERVIEW The fourth quarter continued in positive growth from the second and third quarters with 52,000 square feet of positive absorption. The largest movement in absorption was expected from Mars Petcare moving out of more than 700,000 square feet in two separate facilities, 3051 Creekside and 3800 Groveport Road. With the completion of their new 1.3 million square foot facility last quarter, some large negative absorption was expected. Instead, Zulily took 737,741 square feet at 3051 Creekside driving 130,000 square feet of absorption. The new lease occurred while Allianz Life MARKET INDICATORS Insurance Co. was under contract to sell property as a part of a portfolio sale to KTR Capital Partners. Q3 Q4 FORECASTS AND REFLECTION 2011* 2011** • There were six significant investment sales Albany is Knowlton’s 240,000-square-foot VACANCY (sales with full occupancy) in the Columbus facility, Axium Plastic’s 110,000 square foot market. STAG Industrial purchased the facility, and Pizzuti’s 303,000-square-foot NET ABSORPTION 385,000-square-foot 1120 Morrison Road for speculative warehouse. Pizzuti’s construction CONSTRUCTION $7.8 million, 9.0 percent cap rate. KTR Capital continues for MBM in Groveport as well with Partners purchased five properties from approximately 125,000 square feet. RENTAL RATES — — Allianz Life Insurance Co. as part of an 18 • Tenants are optimistic about growing consumer property sale. The Columbus transfer totalled demand, but cautious in expanding their lease *Actual change from previous quarter 2.5 million square feet for $62 million. for long terms (5+ years). Companies are still **Projected change from previous quarter • VeePak completed its 105,000-square-foot leery of another slowdown. facility in New Albany. Still underway in New RENTAL RATES PROPERTY TYPE VACANCY RATES OVER COMPLETIONS WEIGHTED AVERAGE RENTAL RATES Asking rental rates remained Rates for the Major Product Types 17.0 2,500,000 stable from last quarter. $7 2.5 $2.20 16.0 2,000,000 Supply has decrease over the $2.15 15.0 1,500,000 past two quarters by 1.6 2.0 $6 $2.10 percent points, from 13.5 to $2.05 14.0 1,000,000 1.5 11.8 percent. $5 $2.00 1.0 13.0 500,000 $1.95 $1.90 12.0 0 0.5 $4 $1.85 11.0 (500,000) 0 $1.80 $33Q07 4Q07 1Q08 2Q08 3Q08 4Q08 1Q09 2Q09 3Q10 4Q10 10.0 (1,000,000) $2 9.0 (1,500,000) 3Q 4Q 1Q 2Q 3Q 4Q 1Q 2Q 3Q 4Q 1Q 2Q 3Q 4Q 08 08 09 09 09 09 10 10 10 10 11 11 11 11 8.0 (2,000,000) General Industrial R&D/Flex Warehouse/Dist. 3Q 4Q 1Q 2Q 3Q 4Q 1Q 2Q 3Q 4Q 1Q Q2 Q3 Q4 1 08 5 08 09 09 10 09 09 10 15 10 10 20 10 11 11 25 11 11 30 Completions Absorptions Total Market Vacancy Rate www.colliers.com/columbus
  • 2. RESEARCH & FORECAST REPORT | Q4 2011 | INDUSTRIAL | GREATER COLUMBUS REGION Delaware REGIONAL INDUSTRIAL ECONOMICS October, with an increase of 1.8 percent year County Union The Federal Reserve Bank of Cleveland reports over year. Mining, logging and construction County at least once a quarter in the Federal Reserve’s decreased by 1,000 employees from October North Beige Book about the economic activity of the and is up 13.9 percent year over year. Licking Madison County County fourth district, which includes the Columbus East Metropolitan Statistical Area (MSA). The Beige ASKING RATES West Book from January 2011 reported that industrial Average asking rental rates increased slightly CBD activity in the fourth district grew at a slow pace from the second quarter. R&D/Flex space in the six weeks previous to January 11. Freight increased by $0.38; general industrial decreased Southwest Southeast Fairfield transportation executives reported that transport by $0.17; and warehouse/distribution by $0.01. County volume slowed along seasonal trends. Capital General industrial prices did not change Pickaway County outlays are expected to increase during 2012 for significantly but the amount of available space at fleet expansion and replacement of aging higher prices did change. The R&D/Flex The Columbus industrial market consists equipment. increased substantially due to the actual change of 10 suburban submarkets and the in prices, the median price increased only by Central Business District. The total inventory for the region is 213 million Manufacturers reported that new orders were $0.20 and the non-weighted mean increased square feet of space mainly stable with any declines due to seasonal only by $0.10. As stated in the Q3 Market Report, factors. Demand is being driven by auto, energy the market has likely seen the end of bottoming and heavy equipment industries. Manufacturers prices and we expect that there will be slight remained committed to capital spending plans increases to asking rates. for 2012. Capacity utilization was below normal for all industries except for steel production. MARKET INTEL Hiring continued at a modest pace, but managers Market Activity Volume is the sum of the found it difficult to find high-skilled and absolute value of each absorption change in the professional workers. market. It tells us a little more about what exactly happened to the market behind the The Bureau of Labor Statistics reported that absorption number. The Market Activity Volume manufacturing employment of 63,100 employees was 3,654,787 square feet. With only 52,000 in November which was an increase of 800 over feet absorbed, the market seems to be settling October. Year over year manufacturing is down from the past two quarters, where large positive by 0.3 percent. Trade, transportation and utilities gains dominated the movement in the market. employment grew by 5,700 employees from MARKET ACTIVITY SALES ACTIVITY PROPERTY ADDRESS SALES DATE SALE PRICE SIZE SF GRANTOR GRANTEE PRICE / SF TYPE SUBMARKET 6766 Pontius Road November $17,000,000 754,000 Allianz Life Insurance Co KTR Capital Partners $22.55 Ware./Dist. Southeast 3051 Creekside November $18,500,000 737,000 Allianz Life Insurance Co KTR Capital Partners $25.10 Ware./Dist. Southeast Parkway 6250 Opus Drive October $13,739,300 676,564 CBRE Realty Trust Exeter Property Group $20.31 Ware./Dist. Southeast 5820 Opus Drive November $10,300,000 406,694 Allianz Life Insurance Co KTR Capital Partners $25.33 Ware./Dist. Southeast 1120 Morrison Road October $7,800,000 385,655 Hollingsworth Capital Partner STAG Industrial $20.23 Ware./Dist. East 5765 N Green Pointe November $8,900,000 358,760 Allianz Life Insurance Co KTR Capital Partners $24.81 Ware./Dist. Southeast Drive 5650 Green Pointe Drive November $7,300,000 270,000 Allianz Life Insurance Co KTR Capital Partners $27.04 Ware./Dist. Southeast 4252 Groves Road December $2,225,000 208,000 4252 Groves Road Equities City of Columbus $10.70 Ware./Dist. Southeast LEASE ACTIVITY PROPERTY ADDRESS LEASE SF LESSOR LESSEE ASKING PRICE (NNN) TYPE SUBMARKET 3051 Creekside Parkway 737,471 Allianz Life Insurance Co. Zulily $3.25 Warehouse/Distribution Southeast 3425 Urbancrest Industrial Dr 188,000 Security Capital Industrial Trust Round 2 - Warehouse/Distribution Southwest 3420 Urbancrest Industrial Drive 88,024 ProLogis Trust Exel $2.95 Warehouse/Distribution Southwest 111 Enterprise Drive 65,000 Paragano Nazario P.A.C. $2.70 Warehouse/Distribution Licking 2235 Southwest Boulevard 48,488 Industrial Southpark Owner LLC Cinco Electric $3.10 (MG) R&D/Flex Southwest P. 2 | COLLIERS INTERNATIONAL
  • 3. RESEARCH & FORECAST REPORT | Q4 2011 | INDUSTRIAL | GREATER COLUMBUS REGION UPDATE Market Comparisons INDUSTRIAL MARKET Net Absorption Construction Asking Rental Rates SUBMARKET Total SF Vacant SF Vacancy % Current Quarter Year-to-date Current Completions WH/Dist R&D/Flex CBD 5,907,062 685,817 11.6 30,500 392,858 - - - $6.59 EAST 20,682,243 4,238,914 20.5 1,756 (463,580) - - $3.25 $6.00 FAIRFIELD 6,771,842 617,675 9.1 (293,548) (214,948) - - $4.00 $6.90 LICKING 18,832,930 1,297,016 6.9 65,000 402,874 773,000 105,000 $2.90 - MADISON 8,148,397 - 0.0 - - - - - - NORTH 16,747,138 1,589,882 9.5 (22,600) (124,468) - 70,000 $3.18 $5.16 NORTH DELAWARE 9,132,849 1,057,267 11.6 (5,633) (175,016) - - $2.99 $6.75 PICKAWAY 3,550,850 71,900 2.0 - - - - $2.48 - SOUTHEAST 64,181,757 10,347,192 16.1 (263,857) 920,384 125,000 - $2.62 $3.22 SOUTHWEST 17,683,127 1,156,899 6.5 319,581 468,991 - - $2.92 $4.45 UNION 6,333,817 362,765 5.7 143,800 151,032 - - - $4.33 WEST 35,935,786 3,933,936 10.9 77,162 1,731,891 - - $2.34 $4.31 TOTALS 213,907,798 25,359,263 11.9 52,161 3,090,018 898,000 175,000 $2.69 $4.66 Net Absorption Construction Asking Rental Rates SUBMARKET Total SF Vacant SF Vacancy % Current Quarter Year-to-date Current Completions By Product Type R&D/FLEX 20,280,125 3,044,234 15.0 175,908 574,599 - 70,000 $4.66 GENERAL INDUSTRIAL 71,945,139 5,890,939 8.2 147,147 295,603 428,000 - $3.07 WAREHOUSE/ 121,752,534 16,424,090 13.5 (270,894) 2,219,816 470,000 105,000 $2.69 DISTRIBUTION TOTALS 213,977,798 25,359,263 11.9 52,161 3,090,018 898,000 175,000 $2.99 QUARTERLY COMPARISON AND TOTALS Net Absorption Construction Asking Rental Rates QUARTER, YEAR Total SF Vacant SF Vacancy % Current Quarter Year-to-date Current Completions ($) Q3, 2011 213,802,798 25,411,424 11.9 1,286,321 3,037,857 1,003,000 1,800,000 $2.80 Q2, 2011 211,998,240 26,697,745 12.6 2,113,899 1,751,536 1,992,000 - $2.80 Q1, 2011 211,923,599 28,974,755 13.5 (362,363) (362,363) 1,992,000 - $2.72 Q4, 2010 205,420,829 26,113,915 12.7 743,685 (766,901) 1,575,000 (536,292) $2.57 CONSTRUCTION McGraw-Hill Construction’s most recent report showed construction starts for commercial, industrial, hotel and institutional projects increased to $50 million in the eight-county region in September to $50 million, from $42.74 million in September 2010. The year to date total of nonresidential construction contracts through the first nine months of 2011 fell to $784.83 million which is 26 percent below 2010’s $1.07 billion. COLLIERS INTERNATIONAL | P. 3
  • 4. RESEARCH & FORECAST REPORT | Q4 2011 | INDUSTRIAL | GREATER COLUMBUS REGION CENTRAL BUSINESS DISTRICT feet of 3800 Groveport Road. Exel vacated 173,457 square feet 6360 Port Road. The Central Business District (CBD) added 30,500 square feet of positive absorption in the 512 offices in fourth quarter. The vacancy rate has steadily Construction continues on Pizzuti’s 125,000-square-foot facility for MBM in 61 countries on fallen over the past five quarters by 665 basis points to 11.6 percent. Buckeye Diamond Groveport at 2240 Creekside Parkway. 6 continents Logistics took 16,500 square feet at Techsouth SOUTH United States: 125 C. Canada: 38 The southern submarkets are Pickaway and Latin America: 18 EAST Fairfield counties. Fairfield lost 316,000 square Asia Pacific: 214 feet at 411 Ewing Street. No changes were EMEA: 117 The submarkets comprising eastern Columbus recorded in Pickaway. are East and Licking County. Construction has • $1.5 billion in annual revenue been completed for VeePak’s 105,000 square • 978.6 million square feet under SOUTHWEST management foot facility as well as the 70,000 square feet of The Southwest submarket showed absorption of Pharmaforce’s new R&D/Flex facility. • Over 12,500 professionals 319,581 square feet. The largest gains in absorption came from Round 2 moving into Quebec Ontario-based KDC is expected to UNITED STATES: 188,000 square feet of 3425 Urbancrest complete its 240,000-square-foot building in Industrial Drive. Exel moved into 88,000 square Columbus spring 2012. Mississauga, Canada-based Axium feet of 3420 Urbancrest Industrial Drive from Richard B. Schuen SIOR CCIM Plastics will complete a 110,000-square-foot CEO | Principal | Columbus the Southeast submarket. Cinco Electric facility in spring 2012, employing 165. 8800 Lyra Drive absorbed 48,488 square feet of 2235 Southwest Construction continues on Pizzuti’s Suite # 150 Boulevard through purchase. Columbus, Ohio 43240 303,000-square-foot speculative building TEL +1 614 410 5612 planned for spring 2012. Sonoco is constructing WEST a 120,000-square-foot facility and is also expected to be completed in 2012. The submarkets on the west side of Franklin Leslie Hobbs county are West, Madison and Union. The West Marketing and Research Manager NORTH gained marginally with 3701 Lacon Road, which 8800 Lyra Drive was sold to an owner/user. Aoki Manufacturing Suite #150 The submarkets comprising northern Columbus Columbus, Ohio, 43240 absorbed 55,470 square feet after purchasing are North and North Delaware. Both submarkets TEL +1 614 410 5640 1705 Atlas Street. lost a small amount of occupancy this quarter. In the North, DRC Automation moved out of 20,540 YEAR END WRAP-UP Jonathan Badgley square feet at 7830-7832 North Central Drive. The Columbus industrial market strengthened Research Analyst Carmel Pharma who had been leasing 13,120 175 South Third Street square feet at 7029 Huntley was bought out and throughout 2011. Strong leasing in the second Suite # 285 has been closed. In North Delaware, Granite Co. quarter and third quarter of 2,113,899 and Columbus, Ohio 43201 moved out of 15,673 square feet of space. 1,286,321 square feet respectively, drove the TEL +1 614 437 4495 Oxywater moved into 19,140 square feet at 8255 vacancy rate down 160 basis points. Green Meadows Drive. In 2010, the market had lost more than 2.5 SOUTHEAST million square feet of industrial space from the demolitions of a Big Bear distribution facility on This document/email has been prepared by Colliers The Southeast submarket incurred 263,857 International for advertising purposes. Colliers 3rd Avenue in Grandview and a property located International statistics and data are audited annually and square feet of negative absorption. 2175 Broehm at 200 Georgesville Road. In 2011, however, the may result in revisions to previously reported quarterly Road was purchased by an owner user adding and final year-end figures. Sources include Columbus market gained 1,975,000 square feet with Dispatch, Business First, Xceligent, and the Wall Street 203,000 to occupancy. 3051 Creekside Parkway 898,000 square feet still under construction in Journal. has been fully leased by Zulily netting 130,000 2012. square feet of absorption. 1662 Williams Road was purchased by an owner user and added The largest leases of the year were Thirty-One 96,034 square feet to occupancy. 4333 Directors Gifts leasing 750,000 square feet at 4545 Fisher Boulevard was purchased by an owner user Road; Zulily, leasing 737,000 square feet at 3051 adding 43,460 to occupancy. Creekside Parkway; and Sperian, leasing 500,000 square feet at 6766 Pontius Road. Significant negative absorption came from Mars Petcare’s vacancy of more than 700,000 square Accelerating success. www.colliers.com/columbus