Q3 2013 Houston Industrial Market Research Report
•
1 gostou•225 visualizações


Recomendados
Recomendados
Mais conteúdo relacionado
Mais procurados
Mais procurados (20)
Semelhante a Q3 2013 Houston Industrial Market Research Report
Semelhante a Q3 2013 Houston Industrial Market Research Report (17)
Mais de Colliers International | Houston
Mais de Colliers International | Houston (20)
Último
Último (20)
Q3 2013 Houston Industrial Market Research Report
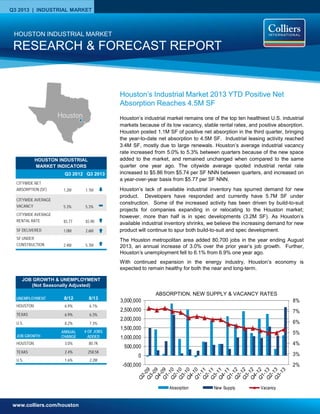
- 1. www.colliers.com/houston Q3 2013 | INDUSTRIAL MARKET 2% 3% 4% 5% 6% 7% 8% -500,000 0 500,000 1,000,000 1,500,000 2,000,000 2,500,000 3,000,000 Absorption New Supply Vacancy Houston’s industrial market remains one of the top ten healthiest U.S. industrial markets because of its low vacancy, stable rental rates, and positive absorption. Houston posted 1.1M SF of positive net absorption in the third quarter, bringing the year-to-date net absorption to 4.5M SF. Industrial leasing activity reached 3.4M SF, mostly due to large renewals. Houston’s average industrial vacancy rate increased from 5.0% to 5.3% between quarters because of the new space added to the market, and remained unchanged when compared to the same quarter one year ago. The citywide average quoted industrial rental rate increased to $5.86 from $5.74 per SF NNN between quarters, and increased on a year-over-year basis from $5.77 per SF NNN. Houston’s lack of available industrial inventory has spurred demand for new product. Developers have responded and currently have 5.7M SF under construction. Some of the increased activity has been driven by build-to-suit projects for companies expanding in or relocating to the Houston market; however, more than half is in spec developments (3.2M SF). As Houston’s available industrial inventory shrinks, we believe the increasing demand for new product will continue to spur both build-to-suit and spec development. The Houston metropolitan area added 80,700 jobs in the year ending August 2013, an annual increase of 3.0% over the prior year’s job growth. Further, Houston’s unemployment fell to 6.1% from 6.9% one year ago. With continued expansion in the energy industry, Houston’s economy is expected to remain healthy for both the near and long-term. RESEARCH & FORECAST REPORT HOUSTON INDUSTRIAL MARKET ABSORPTION, NEW SUPPLY & VACANCY RATES Houston’s Industrial Market 2013 YTD Positive Net Absorption Reaches 4.5M SF UNEMPLOYMENT 8/12 8/13 HOUSTON 6.9% 6.1% TEXAS 6.9% 6.3% U.S. 8.2% 7.3% JOB GROWTH ANNUAL CHANGE # OF JOBS ADDED HOUSTON 3.0% 80.7K TEXAS 2.4% 258.5K U.S. 1.6% 2.2M JOB GROWTH & UNEMPLOYMENT (Not Seasonally Adjusted) HOUSTON INDUSTRIAL MARKET INDICATORS Q3 2012 Q3 2013 CITYWIDE NET ABSORPTION (SF) 1.2M 1.1M CITYWIDE AVERAGE VACANCY 5.3% 5.3% CITYWIDE AVERAGE RENTAL RATE $5.77 $5.90 SF DELIVERED 1.0M 2.6M SF UNDER CONSTRUCTION 2.4M 5.7M Houston
- 2. RESEARCH & FORECAST REPORT | Q3 2013 | HOUSTON INDUSTRIAL MARKET COLLIERS INTERNATIONAL | P.2 Vacancy & Availability Although 2.6M SF of new inventory delivered during the third quarter, Houston’s industrial vacancy rate only increased from 5.0% to 5.3% between quarters. At the end of the second quarter, Houston had 25.5M SF of vacant industrial space citywide, 1.5M SF more than the previous quarter. Among the major industrial corridors, the Northeast Corridor has the lowest vacancy rate, 3.0%, followed by the Northwest Corridor at 4.2%. Houston’s industrial construction pipeline had 5.7M SF of projects underway at the end of the third quarter, including 3.2M SF of spec development. The largest project under construction is a 535,000-SF BTS distribution warehouse for Igloo, located in Katy, TX. A list of additional buildings currently under construction can be found on Page 4 of this report. The largest spec project in the pipeline is a 328,000-SF distribution warehouse located on Imperial Valley Drive in North Houston. Rental Rates Houston’s citywide average quoted industrial rental rate for all product types increased from $5.74 to $5.86 per SF NNN in the third quarter. By property type, the average quoted NNN rental rates are as follows: $5.52 per SF for Distribution space; $4.49 per SF for Bulk Logistics space; $6.00 per SF for Flex/Service space; with Tech/R&D space averaging $12.56 per SF. Absorption & Demand Houston’s industrial market posted 1.1M SF of positive net absorption in the third quarter, bringing the 2013 year-to-date total to 4.5M SF of positive net absorption. The North and Northwest Corridor submarkets out- performed all others in the third quarter, posting the largest positive net quarterly absorptions of 398K SF and 324K SF, respectively. There were several major tenant move-ins contributing to net absorption gains in the third quarter, including Crowley Maritime (128,500 SF); Favorite Brands (91,200 SF); Delta Petroleum (67,400 SF); Crane Worldwide (64,800 SF); and National Oilwell Varco ( 57,900 SF). Leasing Houston’s industrial leasing activity reached 3.4M SF in the third quarter. A list of select third quarter industrial lease transactions are included in the table below. 1 Colliers International transaction 2 Renewal 3 Expansion Building Name/Address Submarket SF Tenant Lease Date 4331 Underw ood Dr East-Southeast Far 300,000 A-International1, 2 Aug-13 9830 Rosprim St Northw est Inner Loop 119,700 Core Labratories2 Jul-13 7111-7251 Clinton Dr Dow ntow n 107,862 Chemtrusion, Inc.1, 2 Jul-13 12620 W Airport Blvd Sugar Land 71,162 Pharmedium Sep-13 3710 Cedar Blvd East-Southeast Far 67,427 Delta Petroleum LLC1 Jul-13 10225 Mula Rd Hw y 59/Hw y 90 (Alt) 65,130 EVS Valves, Inc.2 Sep-13 1601 Gillingham Ln Sugar Land 55,326 Ellen Lighting1 Aug-13 10739 W Little York Northw est Inner Loop 49,530 United Van Lines2 Sep-13 550 Canino Rd North Outer Loop 45,500 IFCO Systems North America Aug-13 10355 W Little York Rd, Suite 200 Northw est Inner Loop 32,045 IHS Global 2 Aug-13 3407 Navigation Blvd CBD-NW Inner Loop 31,972 Sam-Tex Exports LLC Sep-13 9000 Kirby Dr Southw est Far 30,271 Walgreens2 Sep-13 1315 W Sam Houston Pky N West Outer Loop 26,280 Cosentino Aug-13 6511 West Little York Northw est Near 22,939 Cameron International Corporation Jul-13 415-425 Blueberry St Northw est Near 20,708 A Finer Event Sep-13 Q3 2013 Top Industrial Leases
- 3. RESEARCH & FORECAST REPORT | Q3 2013 | HOUSTON INDUSTRIAL MARKET COLLIERS INTERNATIONAL | P.3 Houston Industrial Market Summary Houston industrial sales activity remained steady between quarters with 100 property sales recorded in Q3 2013, compared to 91 in Q2 2013. Two of this quarter’s sales transactions are summarized at right. Sales Activity Q3 2013 Total Sales : $45.8M No. of Properties: 100 Total SF: 7.4M Average $/SF: $66 Average Cap Rate: 7.3% Mac Process Inc. sold a 75,000-SF Class C industrial warehouse to Deepwater Corrosion Services, Inc. for $4.7M or $62 per SF. The building is located on FM 529 in the Northwest Industrial submarket. The buyer will occupy the building. Fairview Equity Holdings LLC sold a 22,500-SF Class A industrial warehouse to Laser Welding Solutions for $2.7M or $120 per SF. The building is located on Fairview in the Northwest Industrial submarket. The buyer will occupy the building. Sources: Real Capital Analytics; CoStar Comps Market Rentable Area Direct Vacant SF Direct Vacancy Rate Sublet Vacant SF Sublet Vacancy Rate Total Vacant SF Total Vacancy Rate 3Q13 Net Absorption YTD 2013 Net Absorption 3Q13 Completions YTD 2013 Completions SF Under Construction Greater Houston Total 483,182,085 25,011,430 5.2% 468,607 0.1% 25,480,037 5.3% 1,095,902 4,466,595 2,624,761 4,591,200 5,654,203 CBD-NW Inner Loop 11,717,053 609,777 5.2% 22,200 0.2% 631,977 5.4% 26,625 127,521 - - - Downtown 31,786,676 1,769,335 5.6% - 0.0% 1,769,335 5.6% 5,206 (9,286) - - - North Inner Loop 5,014,316 451,369 9.0% - 0.0% 451,369 9.0% - - - - 22,000 Southwest Inner Loop 7,771,455 77,649 1.0% - 0.0% 77,649 1.0% 40,918 53,864 - - - Total CBD Corridor 56,289,500 2,908,130 5.2% 22,200 0.0% 2,930,330 5.2% 72,749 172,099 - - 22,000 North Fwy/Tomball Pky 15,922,820 1,301,794 8.2% - 0.0% 1,301,794 8.2% 190,456 281,693 83,542 497,694 270,200 North Hardy Toll Rd 26,912,366 2,108,286 7.8% 28,750 0.1% 2,137,036 7.9% 213,372 393,098 761,807 1,429,957 1,422,142 North Outer Loop 18,240,752 1,212,371 6.6% - 0.0% 1,212,371 6.6% 25,345 (3,488) 150,189 246,616 410,310 The Woodlands/Conroe 14,033,747 613,407 4.4% - 0.0% 613,407 4.4% (31,496) 194,143 48,720 143,621 161,600 Total North Corridor 75,109,685 5,235,858 7.0% 28,750 0.0% 5,264,608 7.0% 397,677 865,446 1,044,258 2,317,888 2,264,252 Northeast Hwy 321 1,231,673 14,879 1.2% - 0.0% 14,879 1.2% 12,841 (5,399) - - - Northeast Hwy 90 16,057,844 220,221 1.4% 129,000 0.8% 349,221 2.2% 57,358 108,585 - 20,000 20,000 Northeast I-10 3,634,195 135,170 3.7% - 0.0% 135,170 3.7% 1,280 14,902 - 21,000 - Northeast Inner Loop 11,572,879 491,291 4.2% - 0.0% 491,291 4.2% 67,704 245,205 - - - Total Northeast Corridor 32,496,591 861,561 2.7% 129,000 0.4% 990,561 3.0% 139,183 363,293 - 41,000 20,000 Hwy 290/Tomball Pky 15,312,554 826,582 5.4% - 0.0% 826,582 5.4% 208,832 195,432 226,375 320,675 176,143 Northwest Hwy 6 4,109,096 133,170 3.2% - 0.0% 133,170 3.2% (21,947) (13,123) 14,400 14,400 30,000 Northwest Inner Loop 58,868,025 2,284,349 3.9% 74,126 0.1% 2,358,475 4.0% (115,584) 438,206 150,000 150,000 48,664 Northwest Near 16,772,428 960,014 5.7% 69,519 0.4% 1,029,533 6.1% (67,458) 27,763 299,840 317,840 - Northwest Outlier 15,220,274 956,351 6.3% - 0.0% 956,351 6.3% 226,688 633,805 771,393 355,034 1,682,731 West Outer Loop 23,204,871 221,653 1.0% 26,000 0.1% 247,653 1.1% 93,184 452,660 22,500 58,250 216,350 Total Northwest Corridor 133,487,248 5,382,119 4.0% 169,645 0.1% 5,551,764 4.2% 323,715 1,734,743 1,484,508 1,216,199 2,153,888 South Highway 35 30,781,977 1,038,098 3.4% 23,600 0.1% 1,061,698 3.4% 68,255 152,442 50,034 70,706 349,547 South Inner Loop 13,133,353 834,349 6.4% - 0.0% 834,349 6.4% (48,189) (159,862) - - - Total Southern Corridor 43,915,330 1,872,447 4.3% 23,600 0.1% 1,896,047 4.3% 20,066 (7,420) 50,034 70,706 349,547 East I-10 Outer Loop 13,560,049 195,135 1.4% - 0.0% 195,135 1.4% - (79,600) - - - East-Southeast Far 46,328,329 4,481,606 9.7% 13,000 0.0% 4,494,606 9.7% 2,319 308,526 - 325,446 502,818 Southeast Outer Loop 18,050,821 498,354 2.8% - 0.0% 498,354 2.8% 111,420 (125,232) - - - Total Southeast Corridor 77,939,199 5,175,095 6.6% 13,000 0.0% 5,188,095 6.7% 113,739 103,694 - 325,446 502,818 Highway 59/Highway 90 22,009,061 923,421 4.2% 50,372 0.2% 973,793 4.4% (60,685) 678,522 - 475,000 223,800 Southwest Far 10,471,766 848,475 8.1% 12,500 0.1% 860,975 8.2% 39,309 119,786 45,961 83,961 90,510 Southwest Outer Loop 12,826,512 770,021 6.0% 4,240 0.0% 774,261 6.0% 20,935 124,062 - - - Sugar Land/Ft Bend Co 18,637,193 1,034,303 5.5% 15,300 0.1% 1,049,603 5.6% 29,214 312,370 - 61,000 27,388 Total Southwest Corridor 63,944,532 3,576,220 5.6% 82,412 0.1% 3,658,632 5.7% 28,773 1,234,740 45,961 619,961 341,698 Houston Industrial Market Statistical Summary 3rd Quarter 2013
- 4. RESEARCH & FORECAST REPORT | Q3 2013 | HOUSTON INDUSTRIAL MARKET COLLIERS INTERNATIONAL | P.4 Q3 2013 Industrial Under Construction – 60,000 SF or greater Q3 2013 Industrial Deliveries - 60,000 SF or greater Submarket Cluster Submarket Building Address RBA % Pre- Leased Developer Estimated Delivery Northwest Corridor Northwest Outliers 28501 US-90 Hwy 535,000 100.0% Panattoni Nov-13 Northwest Corridor Northwest Outliers 28900 US-90 Hwy 500,000 100.0% Panattoni Oct-13 Northwest Corridor Northwest Outliers 30602 Mcallister Rd 400,000 100.0% KDW Ltd Nov-13 North Corridor North Hardy Toll Rd Imperial Valley Dr @ FM 1960 328,020 0.0% Avera Companies Dec-13 North Corridor North Hardy Toll Rd 110 Airtex Dr 267,170 0.0% DCT Industrial Trust Nov-13 North Corridor North Outer Loop 121 Esplanade 244,550 0.0% IDI Apr-14 Southeast Corridor East-Southeast Far 3750 Highway 225 185,168 0.0% The Carson Companies Feb-14 Northwest Corridor West Outer Loop 16257 Port NW 171,850 0.0% Transwestern Mar-14 North Corridor North Fwy/Tomball Pky 11220 Ella Blvd 163,000 0.0% Liberty Property Trust Dec-13 North Corridor North Outer Loop 13627 W Hardy Rd 151,339 100.0% TNRG Nov-13 Southern Corridor South Hwy 35 11951 Spectrum Blvd 150,000 100.0% Unknown Feb-14 North Corridor North Hardy Toll Road 525 Century Plaza Dr 149,760 100.0% Avera Companies Dec-13 Southern Corridor South Hwy 35 7232 Airport Blvd 137,297 100.0% Unknown Dec-14 North Corridor North Hardy Toll Road 16501 Central Green Blvd 129,112 0.0% Verde Nov-13 North Corridor North Hardy Toll Road 16507 Central Green Blvd 129,112 0.0% Verde Nov-13 Southwest Corridor Hwy 59/Hwy 90 (Alt) 13615 S Gessner Rd 123,300 0.0% Stream Realty Partners, L.P. Mar-14 Southeast Corridor East-Southeast Far 3700 Highway 225 118,500 0.0% The Carson Companies Feb-14 Southwest Corridor Hwy 59/Hwy 90 (Alt) 13721 S Gessner 85,500 0.0% Stream Realty Partners, L.P. Mar-14 North Corridor North Hardy Toll Road 19245 Kenswick Dr 74,880 0.0% Trammell Crow Company Nov-13 Northwest Corridor Hwy 290/Tomball Pky 7220 N Sam Houston Pky 70,000 100.0% TNRG Nov-13 Northwest Corridor Northwest Outliers 22220 Merchants Way 67,743 0.0% InSite Commercial Real Estat Oct-13 North Corridor Ind North Fwy/Tomball Pky 1050 Greens Pky 67,200 0.0% Liberty Property Trust Dec-13 Southwest Corridor South Main/Medical Center 9380 Kirby Dr 64,260 0.0% Warehouse Associates Jan-14 Northwest Corridor Northwest Outliers 461 Stonegate Dr 63,382 100.0% Clay Development Oct-13 Southeast Corridor East-Southeast Far 3800 Highway 225 61,794 0.0% The Carson Companies Feb-14 Submarket Cluster Submarket Building Address RBA % Pre- Leased Developer Delivered Northwest Corridor Northwest Outliers I-10 & Highway90 500,000 71.4% Medline Industries, Inc. Sep-13 Northwest Corridor Northwest Near 7310 Langfield - Bldg 200 299,840 0.0% Avera Companies Jul-13 North Corridor North HardyToll 8120 Humble Westfield Rd 240,000 0.0% Duke Realty Sep-13 North Corridor North HardyToll 16200 Central Green Blvd 181,067 100.0% LibertyPropertyTrust Sep-13 North Corridor North HardyToll 500 Northpark Central Dr 174,200 0.0% Prologis Inc. Jul-13 North Corridor North HardyToll 14650 Heathrow Forest Pky 121,919 100.0% Wolff Properties Aug-13 North Corridor North HardyToll 4730 Consulate Plaza Dr 101,200 0.0% EastGroup Properties Aug-13 North Corridor North Fwy/Tomball Pky 21200 Spring Plaza Dr 83,542 100.0% Unknown Jul-13 Northwest Corridor Northwest Outliers 21301 Park Row Rd 79,950 100.0% Transwestern Sep-13 Northwest Corridor Northwest Inner Loop 1315 W Sam Houston PkyN - 70,000 0.0% Caldwell Companies Jul-13 Northwest Corridor Northwest Outliers 21201-21601 Park Row Dr 64,350 100.0% Transwestern Sep-13
- 5. RESEARCH & FORECAST REPORT | Q3 2013 | HOUSTON INDUSTRIAL MARKET Accelerating success. COLLIERS INTERNATIONAL 1223 W. Loop South Suite 900 Houston, Texas 77027 Main +1 713 222 2111 LISA R. BRIDGES Director of Market Research | Houston Direct +1 713 830 2125 Fax +1 713 830 2118 lisa.bridges@colliers.com The Colliers Advantage Enterprising Culture Colliers International is a leader in global real estate services, defined by our spirit of enterprise. Through a culture of service excellence and a shared sense of initiative, we integrate the resources of real estate specialists worldwide to accelerate the success of our partners. When you choose to work with Colliers, you choose to work with the best. In addition to being highly skilled experts in their field, our people are passionate about what they do. And they know we are invested in their success just as much as we are in our clients’ success. This is evident throughout our platform—from Colliers University, our proprietary education and professional development platform, to our client engagement strategy that encourages cross-functional service integration, to our culture of caring. We connect through a shared set of values that shape a collaborative environment throughout our organization that is unsurpassed in the industry. That’s why we attract top recruits and have one of the highest retention rates in the industry. Colliers International has also been recognized as one of the “best places to work” by top business organizations in many of our markets across the globe. Colliers International offers a comprehensive portfolio of real estate services to occupiers, owners and investors on a local, regional, national and international basis. COLLIERS INTERNATIONAL | P. 5