1. Q3 2012 | OFFICE MARKET
HOUSTON OFFICE MARKET
RESEARCH & FORECAST REPORT
HOUSTON’S HEALTHY ECONOMY BOOSTS OFFICE
LEASING ACTIVITY
Houston’s strong job growth has boosted office leasing in 2012. Third quarter
leasing activity reached 2.6 million SF, 1.5 million SF of which was in Class B
product. The Houston metropolitan area added 89,500 jobs between August
MARKET INDICATORS
2011 and August 2012, an annual increase of 3.5% over the years prior job
Q3 2011 Q3 2012 growth. Further, Houston’s unemployment fell to 7.0% from 8.6% one year
CITYWIDE NET ago which has bolstered annual Houston area home sales by 20.0%.
ABSORPTION (SF) 957K 767K
)
Expansion in the energy industry has driven demand for new office
CITYWIDE AVERAGE development as tenants find it harder to locate blocks of quality office space.
VACANCY 16.0% 14.2% Currently, 4.1 million SF is in the office construction pipeline and 58.0% of the
space is pre-leased. A complete list of properties under construction can be
CITYWIDE AVERAGE
found on page 7 of this report.
RENTAL RATE $22.93 $23.61
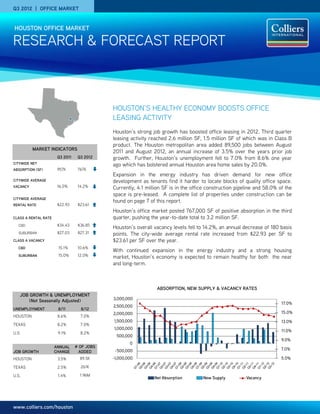
Houston’s office market posted 767,000 SF of positive absorption in the third
CLASS A RENTAL RATE quarter, pushing the year-to-date total to 3.2 million SF.
CBD $34.43 $36.85
Houston’s overall vacancy levels fell to 14.2%, an annual decrease of 180 basis
SUBURBAN $27.03 $27.31 points. The city-wide average rental rate increased from $22.93 per SF to
CLASS A VACANCY $23.61 per SF over the year.
CBD 15.1% 10.6%
With continued expansion in the energy industry and a strong housing
SUBURBAN 15.0% 12.0% market, Houston’s economy is expected to remain healthy for both the near
and long-term.
ABSORPTION, NEW SUPPLY & VACANCY RATES
JOB GROWTH & UNEMPLOYMENT
(Not Seasonally Adjusted) 3,000,000
17.0%
2,500,000
UNEMPLOYMENT 8/11 8/12
2,000,000 15.0%
HOUSTON 8.6% 7.0%
1,500,000 13.0%
TEXAS 8.2% 7.0%
1,000,000
11.0%
U.S. 9.1% 8.2%
500,000
9.0%
0
ANNUAL # OF JOBS
-500,000 7.0%
JOB GROWTH CHANGE ADDED
HOUSTON 3.5% 89.5K -1,000,000 5.0%
TEXAS 2.5% 261K
U.S. 1.4% 1.96M
Net Absorption New Supply Vacancy
www.colliers.com/houston
2. RESEARCH & FORECAST REPORT | Q3 2012 | HOUSTON OFFICE MARKET
VACANCY & AVAILABILITY ABSORPTION & DEMAND
CBD VS. SUBURBAN Houston’s average vacancy rate and the Houston recorded positive net absorption of
average suburban vacancy rate both decreased 767,000 SF in the third quarter, pushing the
CLASS A OFFICE VACANCY
by 30 basis points to 14.2% from 14.5% on a year-to-date absorption total to 3,211,000 SF.
20.0% quarterly basis. The average CBD vacancy rate Contributing to the third quarter’s positive gain
18.0% decreased by 50 basis points to 13.9% from was CBD Class A space with a positive net
16.0% 14.4% between quarters. On a year-over-year absorption of 292,000 SF, followed by
14.0% basis, the city-wide vacancy rate decreased by suburban Class A space with positive net
12.0% 180 basis points to 14.2% from 16.0%. The absorption of 281,000 SF. Some of the larger
10.0% average suburban vacancy rate decreased by tenants that moved into their space or expanded
8.0% 140 basis points to 14.2% from 15.6%, and the into additional space during the third quarter
6.0% average CBD vacancy rate decreased by 370 included Shell Oil relocating to 331,000 SF in
4.0% basis points to 13.9% from 17.6%. 1000 Main from 250,000 SF in 2 Houston
The CBD Class A vacancy rate decreased by 30 Center, Rosetta Resources relocating to
basis points to 10.6% from 10.9% between 109,000 in Heritage Plaza from 70,000 SF in
quarters, while the CBD Class B vacancy rate 717 Texas, and WorleyParsons moved into
CBD VACANCY SUBURBAN VACANCY
decreased 120 basis points to 18.0% from 130,000 SF in the Reserve at Park Ten.
19.2%. The suburban Class A vacancy rate
RENTAL RATES
decreased by 30 basis points to 12.0% from
The average citywide rental rate remained
12.3% between quarters, while the suburban
CLASS A OFFICE RENTS relatively flat between quarters decreasing to
Class B vacancy rate decreased to 16.5% from
$40.00 $23.61 from $23.66 per square foot. The CBD
16.9%.
$38.00 Class A average quoted rental rate increased to
Of the 1,709 buildings in the Houston office $36.85 from $36.80 per square foot, while the
$36.00 market, only 39 have 100,000 SF of contiguous suburban Class A average quoted rental rate
$34.00 space available for lease or sublease. decreased to $27.31 from $27.81 per square
$32.00
Further, only 12 have 200,000 SF contiguous foot.
available
$30.00 The CBD Class B average quoted rental rate
Available sublease space totals 3.2 million SF or increased to $24.00 from $23.61 per square
$28.00
1.7% of total inventory, of which 1.1 million SF is foot, while the suburban Class B average quoted
$26.00 currently vacant. rental rate increased to $18.74 from $18.54 per
square foot between quarters.
CBD RENTS SUBURBAN RENTS
QUOTED GROSS RENTAL RATES FOR TOP PERFORMING OFFICE BUILDINGS
YEAR AVAIL. RENT
BUILDING NAME ADDRESS SUBMARKET RBA (SF) LEASED OWNER
BUILT SF ($/SF)
5 Houston Center 1401 McKinney St CBD 600,000 2002 99.0% 61,071 $42.66 Wells Real Estate Funds
1000 Main 1000 Main St CBD 837,161 2003 98.3% 22,420 $42.00 INVESCO
Heritage Plaza 1111 Bagby CBD 1,089,266 1986 98.4% 45,007 $41.94 Brookfield Office Properties
BG Group Place 811 Main CBD 972,474 2011 77.2% 221,440 $41.87 CalPERS/Hines
Wells Fargo Bank Tower 1300 Post Oak Blvd. Galleria 491,254 1983 98.1% 13,784 $40.15 TIAA-CREF
Williams Tower 2800 Post Oak Blvd Galleria 1,476,973 1983 98.5% 31,133 $37.66 Hines REIT
9 Greenway Plaza 9 Greenway Greenway 746,824 1978 94.4% 66,017 $32.90 Crescent Real Estate Equities
Two Eldridge Place 757 N Eldridge Pky Katy Freeway 280,322 1986 98.3% 11,882 $34.45 Behringer Harvard REIT I, Inc.
San
San Felipe Plaza 5847 San Felipe St 980,472 1984 80.8% 199,272 $37.42 Thomas Properties Group, L.P.
Felipe/Voss
2000 W. Sam
One BriarLake Plaza Westchase 502,410 2000 100.0% 22,905 $44.55 Behringer Harvard Holdings
Houston
24 Waterway 24 Waterway Ave. Woodlands 311,938 2009 98.6% 12,250 $36.89 Black Forest Ventures LLC
Note: Avail. SF includes direct and sublet space.
Source: CoStar Property
COLLIERS INTERNATIONAL | P. 2
3. RESEARCH & FORECAST REPORT | Q3 2012 | HOUSTON OFFICE MARKET
SALES ACTIVITY
Houston’s office investment sales activity increased between quarters with 21 properties changing hands, compared to 15 in the
previous quarter. According to CoStar Comps, Houston office sales transactions had a total dollar volume of $1.2 billion, averaging
$228 per square foot.
Some of the more significant transactions that closed during the third quarter are listed below.
Q3 2012 SIGNIFICANT SALES TRANSACTIONS – (20,000 SF or greater)
YEAR SALE CAP
BUILDING NAME SUBMARKET RBA (SF) BUYER SELLER $/SF CLOSED
BUILT PRICE RATE
One & Two Shell
CBD 1,795,883 1970 Enterprise Products Hines Interests $550M $306 6.50% 8/2012
Plaza
Ashford Office Park Beacon Investment
Katy Freeway 566,308 1981 Falcon Southwest $81M $144 8.16% 8/2012
(3-bldg portfolio) Properties
Kirkwood Tower Katy Freeway 285,682 1984 Frontier Equity Equastone $32M $112 6.25% 7/2012
LEASING ACTIVITY
Houston’s office leasing activity reached 2.6 million SF in the third quarter, pushing the year-to-date total to over 9.75 million SF.
Below is a list of the significant 3Q 2012 lease transactions.
Q3 2012 SIGNIFICANT LEASE TRANSACTIONS
BUILDING NAME/ADDRESS SUBMARKET SF TENANT LEASE DATE
Westgate 2 & 3 Katy Freeway 340,000 Wood Group Mustang Aug-12
Westgate 1 Katy Freeway 100,000 Subsea 7 Inc Aug-12
Chase Tower CBD 58,944 Linn Energy2 Aug-12
1
Galleria Plaza I Galleria/West Loop 46,416 Just Energy TX, L.P. Aug-12
1,2
Halbouty Center Galleria/West Loop 30,907 Envoy Mortgage Jul-12
Heritage Plaza CBD 25,389 Tudor, Pickering & Holt1 Aug-12
2
Chase Tower CBD 22,561 Breitburn Energy Partners Aug-12
1,2
333 Northbelt North Belt/Greenspoint 22,518 Holloman Corporation Jul-12
1
Chase Tower CBD 21,900 Indigo Minerals Aug-12
Chase Tower CBD 21,900 M2 Midstream 1 Aug-12
5543 Westheimer Galleria/West Loop 19,870 Ruth's Chris Jul-12
1
Kirkwood Atrium Katy Freeway 19,675 Paychex Aug-12
Williams Tower Galleria/West Loop 17,057 Nathan Sommers Jacobs1 Aug-12
Park Ten Plaza Katy Freeway 16,634 MCS Kenny Aug-12
1
712 Main CBD 11,000 Chicago Title Aug-12
1,2
2100 West Loop South Galleria/West Loop 10,536 Platinum Energy Solutions, Inc. Sep-12
Space Park Office Bldg NASA/Clear Lake 10,032 Nassau Engineering Co. Aug-12
Marathon Oil Tower Galleria/West Loop 10,000 Texas Dow Employees Credit Jul-12
Granite Westchase I Westchase 9,779 Arup Texas Inc. Jul-12
Chase Tower CBD 9091 Angola LNG Supply Services LLC1 Aug-12
1
Renewal
2
Expansion
3
Sublease
COLLIERS INTERNATIONAL | P. 3
7. RESEARCH & FORECAST REPORT | Q3 2012 | HOUSTON OFFICE MARKET
HOUSTON SUBURBAN OFFICE MARKET SUMMARY - CONTINUED
Inventory Direct Vacancy Sublease Vacancy Vacancy Vacancy Rate (%) Net Absorption (SF) Rental Rate
Class # of Bldgs. Total (SF) (SF) Rate (%) (SF) Rate (%) Total (SF) Q3-2012 Q2-2012 Q3-2012 YTD-2012 AVG ($/SF)
West Loop/Galleria
A 35 14,696,357 1,419,599 9.7% 46,593 0.3% 1,466,192 10.0% 10.7% 25,200 146,148 $30.13
B 58 7,268,372 1,221,851 16.8% 5,721 0.1% 1,227,572 16.9% 18.8% -60,407 87,706 $23.47
C 3 147,042 433 0.3% 0 0.0% 433 0.3% 0.0% 0 -433 $18.79
Total 96 22,111,771 2,641,883 11.9% 52,314 0.2% 2,694,197 12.2% 13.2% -35,207 233,421 $27.25
Westchase
A 22 6,791,438 458,998 6.8% 73,347 1.1% 532,345 7.8% 12.2% 44,542 383,453 $29.98
B 59 6,168,349 842,554 13.7% 7,134 0.1% 849,688 13.8% 16.3% 60,397 118,450 $18.50
C 6 281,047 74,615 26.5% 0 0.0% 74,615 26.5% 18.3% -25,735 -30,227 $18.32
Total 87 13,240,834 1,376,167 10.4% 80,481 0.6% 1,456,648 11.0% 14.3% 79,204 471,676 $24.77
The Woodlands
A 16 3,198,900 56,519 1.8% 11,440 0.4% 67,959 2.1% 2.9% 15,539 61,675 $34.82
B 66 3,456,773 348,441 10.1% 21,078 0.6% 369,519 10.7% 12.7% 62,728 216,698 $21.19
C 5 341,192 0 0.0% 0 0.0% 0 0.0% 0.0% 0 918 -
Total 87 6,996,865 404,960 5.8% 32,518 0.5% 437,478 6.3% 7.6% 78,267 279,291 $24.63
OFFICE DEVELOPMENT PIPELINE
Houston’s construction pipeline continues to expand with 4.1 million square feet currently under construction. The table below includes buildings
50,000 square feet or larger.
PRE- EST.
BUILDING NAME ADDRESS SUBMARKET SF DEVELOPER
LEASED DELIVERY
Anadarko Tower 2 1201 Lake Robbins Dr Woodlands 550,000 100.0% Patrinely Group Inc 4/2014
Energy Tower III 11740 Katy Freeway Katy Freeway 428,831 0.0% Mac Haik Realty LLC 1/2014
Nexen Building 945 Bunker Hill Katy Freeway 331,513 72.9% MetroNational Corp 10/2012
Murphy Exploration 9805 Katy Freeway Katy Freeway 320,000 54.1% MetroNational Corp 10/2013
BBVA Compass/2200 Post Oak 2200 Post Oak Blvd Galleria/Uptown 306,012 59.3% Redstone and Stream 4/2013
Skanska Commercial
3009 Post Oak Blvd. 3009 Post Oak Blvd Galleria/Uptown 302,536 0.0% 7/2013
Development
Research Forest Lakeside –
2445 Technology Forest Blvd Woodlands 300,000 50.0% Warmack Investments 4/2013
Building 4
Granite Briarpark Green 3151 Briarpark Dr Westchase 299,664 2.1% Granite Properties 7/2013
The Woodlands Development
3 Waterway Square Place 3 Waterway Ave. Woodlands 233,844 90.0% 6/2013
Company, L.P.
8 West Centre 3505 W Sam Houston Pky N Katy Freeway 228,000 0.0% CORE Parkway Central, Ltd 7/2013
17320 Katy Freeway 17320 Katy Freeway Katy Freeway 182,000 1.1% Transwestern 12/2013
Sam Houston Crossing II 10344 Sam Houston Pky N Northwest Far 159,056 0.0% Duke Realty 5/2013
Mason Creek Office Center Mason Rd & Merchants Way Northwest Outlier 135,330 0.0% Myers, Crow & Saviers 4/2013
CityCentre Three 842 W Sam Houston Pky N Katy Freeway 120,211 46.5% Midway Companies 6/2013
CityCentre Four 840 W Sam Houston Pky N Katy Freeway 120,052 52.8% Midway Companies 6/2013
Halliburton North Belt Campus Milner Road North Belt/Greenspoint 100,000 100.0% - 12/2012
COLLIERS INTERNATIONAL | P. 7
8. RESEARCH & FORECAST REPORT | Q3 2012 | HOUSTON OFFICE MARKET
Colliers International Statistics
Revenues: $1.8 billion
Countries: 62
Offices: 522
Professionals & Staff: 12,300
Brokers: 4,800
Square Feet Managed: 1.25 billion*
Lease/Sale Transactions: 76,000
Total Transaction Value: $68 billion
(Based on 2011 results.)
*The combination of Colliers International and FirstService results in 2.5
billion under management (2nd largest in the world).
Lisa R. Bridges
Director of Market Research Houston
Direct +1 713 830 2125
Fax +1 713 830 2118
lisa.bridges@colliers.com
COLLIERS INTERNATIONAL | HOUSTON
1300 Post Oak Boulevard
Suite 200
Houston, Texas 77056
Main +1 713 222 2111
Accelerating success.
COLLIERS INTERNATIONAL | P. 8