2. Otolaryngology–
Head and Neck Surgery
Volume 123 Number 1 Part 1 XENELLIS et al 115
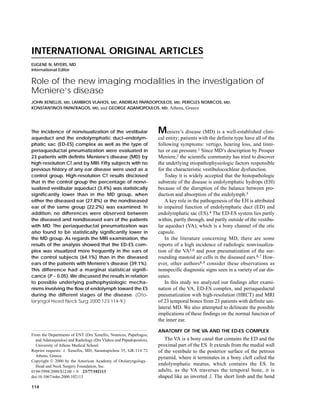
Fig 2. MRI of a normal ED-ES complex (arrow).
Fig 1. Transaxial HRCT of a normal VA (arrow).
VA, which also shows a narrow external aperture. In
MD there is a high incidence of type III pneumatiza-
of the VA together are called the isthmus, and this is the tion.6,7
most narrow part of it.
The distal end of the VA expands to accommodate METHODS AND MATERIAL
the terminal enlargement of the ED, the ES. Lund- Between 1994 and 1996, 23 patients with definite unilateral
quist10 divided the ES into 3 parts: (1) a proximal part MD were evaluated in the ENT Department of the University
located within the VA, (2) an intermediate part located of Athens. This group of patients constitutes the source of this
partially within the VA and partially between the layers study. The selection criteria for these patients conformed to
of dura mater outside the VA, and (3) a distal part rest- those proposed by the Committee on Hearing and Equilibrium
ing completely within layers of dura mater. of the American Academy of Otolaryngology–Head and Neck
The dimensions of the VA and the ED-ES complex Surgery.1 None of the patients expressed the so-called
render visualization of these structures by radiologic cochlear or vestibular types of MD.
methods technically feasible. The VA can be visualized The patient group included 10 men and 13 women. The
on CT, and the postisthmic part of the ED and the ES, right ear was involved in 12 patients, and the left ear was
along with their stroma, can be visualized on MRI. In involved in 11. The mean age of the patients was 48.6 years
this context, the degree and type of periaqueductal (range 19-72 years). In 12 patients (52%) the disease duration
pneumatization is crucial because it seems to have a ranged between 4 and 9 years, in 4 (17.4%) it was more than
direct influence on the appearance and the length of the 9 years, and in the remaining 7 (30.6%) it was less than 4
VA.6 years. The mean duration of symptoms was 5.3 years (range
In our study we classified the type of pneumatization 0.3-24 years).
of our patients according to the proposed scheme by The mean value of the pure-tone audiograms (500, 1000,
Stahle and Wilbrand.6 They considered 3 types of 2000, and 4000 Hz) was 48.2 dB, and the type of hearing loss
pneumatization: type I, with large-cell pneumatization; was flat in 14 patients (60.9%), downward sloping in 6 (26%),
type II, with small air cells or bone marrow spaces; and and upward sloping in 3 (13%). At the time of HRCT and
type III, with a complete absence of air cells. In type I MRI, the disease in all 23 patients was in an inactive phase,
the VA is longer, and its external aperture is wider. and none of them reported vertigo.
Contrary to type I, type III is compatible with a shorter As a control group, we used 50 patients who had no previ-
3. Otolaryngology–
Head and Neck Surgery
116 XENELLIS et al July 2000
Table 1. Frequency distribution of the pneumatiza- Table 3. Descriptive characteristics of the width of
tion type among control and MD groups the VA among control and MD groups
Control group MD group Average Minimum Maximum
Group n (mm) (mm) (mm)
Pneumatization
type n % n % P value
Control patient 56 1.08 0.50 2.00
Diseased ear 13 0.63 0.40 1.00
I 12 41.4 2 11.1 0.01
Nondiseased ear 14 0.83 0.60 1.20
II 10 34.5 6 33.3
III 7 24.1 10 55.5
Table 4. Frequency distribution of the visualization
Table 2. Frequency distribution of the visualization of the MR examination among control group, dis-
of the HRCT examination among control and MD eased and nondiseased ears from MD groups
groups MD group
MD group
Control Diseased Nondiseased
Control Diseased Nondiseased group* ear† ear‡
group* ear† ear‡
HRCT result n % n % n %
HRCT result n % n % n %
Visualized 25 64.1 9 39.1 14 63.6
Visualized 56 96.6 13 72.2 14 77.8 Nonvisualized 14 35.9 14 60.9 8 36.4
Nonvisualized 2 3.4 5 27.8 4 22.2 *P = 0.05 for control group versus diseased ear (Fisher exact test).
†P = 0.59 for control group versus nondiseased ear (Fisher exact test).
*P = 0.007 for control group versus diseased ear (Fisher exact test).
‡P = 0.08 for diseased versus nondiseased ear (Fisher exact test).
†P = 0.02 for control group versus nondiseased ear (Fisher exact test).
‡P = 0.78 for diseased versus nondiseased ear (Fisher exact test).
ous history of any ear disease and had CT and MRI examina- RESULTS
tion of the brain for other reasons. More precisely, 29 of them Table 1 shows the HRCT findings regarding the
had HRCT and the other 21 had MRI. pneumatization of the temporal bones in the diseased
HRCT of the petrous bone was performed on a 9800 GE and control groups. We did not consider separately the
scanner with the following technical characteristics: 1.5-mm 2 ears of the patients with MD because we found that
slice thickness, 1-mm table increment, 200 mA, 3 seconds, the pneumatization was similar between the two sites.
120 kV, 10-cm field of view (FOV), and bone algorithm. The From the univariate analysis and the χ2 test from trend,
section plane was 30° above the anthropologic line.11 For we found that there was statistically significant differ-
improved demonstration of the VA, reformed images were ence in the type of pneumatization between the control
obtained in the sagittal plane parallel to a line connecting the group and the MD group. Type I pneumatization was
external aperture of the VA and the common crus of the pos- found in 41.4% of the control group and only 11.1% of
terior and superior semicircular canals (Fig 1). the MD group. On the other hand, type III pneumatiza-
Measurements of the VA were made by one radiologist tion was found in 55.5% of patients with MD and only
blinded to any clinical information. Images were magnified by in 24.1% of control patients. Type II pneumatization
2, and the anteroposterior diameter of the VA was manually cal- was similar in both groups.
culated at the midpoint of the postisthmic segment of the VA. Table 2 shows the percentage of visualization of VA
MRI was performed on a Phillips 0.5-T Gyroscan unit. in the various groups after the tomographic examination
Two-dimensional Fourier transform images of the membra- of the temporal bone with HRCT. In the control group
nous labyrinth were obtained with an SE T1-weighted pulse both ears were considered together, whereas in the MD
sequence (recovery time, 700 ms; echo time, 15 ms; FOV, 20 group the two ears were evaluated separately.
cm; matrix, 192 × 256) and a GRE pulse sequence (recovery The VA was not visualized in 3.4% of the control
time, 40 ms; echo time, 17 ms; flip angle, 90°; FOV, 16 cm; group. In the MD group it was not visualized in the
matrix, 205 × 256). The section plane was 30° to the anthro- affected ears in 27.8% and in the ears on the opposite
pologic line. Slice thickness was 3 mm, and interslice gap was side in 22.2%.
0.3 mm for both sequences. All examinations were performed Both differences, between the control group and the
with a head coil (Fig 2). diseased and nondiseased ears of the MD group, were
4. Otolaryngology–
Head and Neck Surgery
Volume 123 Number 1 Part 1 XENELLIS et al 117
Fig 4. MRI of a patient with MD: ED-ES system is not visual-
Fig 3. HRCT of a patient with MD: VA is not visualized. Poor ized.
periaqueductal pneumatization (arrow).
found to be statistically significant. On the contrary, DISCUSSION
examining the affected and nonaffected ears of the MD The ED-ES complex has long been recognized as a
group, no statistically significant differences were possible explanation of the pathogenesis of EH, which
observed. is the histopathologic substrate of MD.4,12 Studies sug-
Performing the Mann-Whitney U and the Wilcoxon gest that the ED and ES are both actively involved in
nonparametric tests, we compared also the width of the endolymph regulation. In experimental animals it was
visualized VA between the control and the MD groups. proved that the destruction of the ES or obstruction of
More precisely, as shown in Table 3, the average width the ED resulted regularly in progressive EH.4
of the VAs in the control group was 1.08 mm (range Clemis and Valvassori5 first reported that there is a
0.50-2.0 mm), whereas it was only 0.63 mm (range higher incidence of nonvisualization of the VA in
0.40-1.0 mm) in the diseased ears (P < 0.001) and 0.83 patients with MD on conventional tomography. Their
mm (range 0.60-1.2 mm) in the nondiseased ears (P < observation was criticized by Yuen and Schuknecht,13
0.01) in the MD group. who reported that measurements of VAs in histologic
Table 4 depicts the percentages of visualized and sections of temporal bones of patients with MD failed to
nonvisualized ED-ES complex with MRI in the con- establish any statistical evidence of narrowing, in com-
trol and the MD group. In the latter group the dis- parison with measurements in normal temporal bones.
eased and nondiseased ears were also considered sep- However, these authors measured the isthmic and not
arately. the postisthmic part of the VA, as was recommended by
The ED-ES complex was visualized in 64.1% of the Clemis and Valvassori. Sando and Ikeda14 investigating
control group and only in 39.1% of the diseased ears. this controversy confirmed the finding of Clemis and
This difference was proved to have a marginally statis- Valvassori of hypoplasia of the postisthmic segment of
tical significance (P ~ 0.05). The visualization of the the VAs in histologic examinations of temporal bones of
ED-ES complex in the nondiseased ears of the MD patients with MD. Absence and morphologic abnormal-
group was almost similar to that of the control group ities of the VA-ES complex, along with poor pneumati-
(63.6%), without any statistical significance. zation of the periaqueductal mastoid air cells, have been
5. Otolaryngology–
Head and Neck Surgery
118 XENELLIS et al July 2000
correlated with ES fibrosis, which is one of the pro- of endolymph in cases of advanced EH. MRI when the
posed causes of MD.7 endolymph has no access to the ES may fail to depict
There is no universally accepted classification of the the ED-ES complex. However, the physician must
different morphology types of VAs, nor is there a stan- always keep in mind the small possibility of an anatomic
dard point where measurements should be taken. In this aberration of the ES20 as a cause of a failure in visual-
study we measured the width of the VA at the midpoint ization of the ED-ES complex. In our study we did not
of the postisthmic segment. find any statistically significant difference (P ~ 0.1) in
Valvassori and Dobben15 classified the VA into 5 visualization of ES between the diseased and nondis-
types, based on measurements at the anteroposterior eased ears and only a marginally statistical difference
diameter of the midpoint of the postisthmic segment, as between the diseased ears of the MD group and those of
follow: (1) normal, 0.5 to 1 mm; (2) filiform, less than the control group. In this particular group of patients,
0.3 mm; (3) large, 1.5 cm or more; and (4) obliterated, the disease was in an inactive phase, and no patients
when a portion of the postisthmic segment is not visu- showed hearing loss of more than 65 dB (mean value
alized; and (5) nonvisualized. 48.2 dB). In this context it is important to note the
Our data are in accordance with those of others,6,7 observation of Tanioka et al,17 who found that in
who found that MD is associated with an increased inci- patients having acute episodes of MD, the ED-ES com-
dence of abnormally decreased periaqueductal pneuma- plex was not adequately visible in the affected ear but
tization and small or nonvisualized VA (Fig 3). More was seen well in the unaffected ear; Tanioka et al also
precisely, type III was found in 55.5% of ears of found that during remission the ED-ES complex was
patients with MD and only 24.1% of the ears of control not visible in patients with clinically advanced disease
subjects (Table 1). Likewise the VA was not visualized but was seen well during the early-to-moderate stages
in 27.8% in the diseased ears and only 3.4% in the con- of disease.
trol group ears (Table 2). Table 3 displays 2 more
important findings. First, in the studied group the aver- CONCLUSIONS
age width of the VA is obviously smaller than in the 1. HRCT findings in our group of patients with defi-
healthy subjects, and second, the nondiseased ears in nite MD are in accordance with those of others,
the MD group show the same abnormalities as the who found that MD is associated with an in-
affected ones. This evidence supports the opinion that creased incidence of abnormally decreased peri-
the disease is bilateral and there is a progressively aqueductal pneumatization and small or nonvisu-
increasing incidence of involvement of the second ear if alized VA.
the patients with MD are followed up for many years.9 2. MRI is a sensitive examination of the membra-
Preliminary studies using MRI suggest that patients nous labyrinth and may contribute to better under-
with MD often have a small or nonvisualized ED-ES standing of the pathophysiology of the different
complex.16 Results of this study confirm the above stages and phases of MD.
observation (Fig 4). Visualization of the ED-ES system 3. HRCT and MRI may be used as confirmatory
between diseased ears and ears from the control group examination techniques when the diagnosis of MD
indicated a marginally statistically significant differ- is in question.
ence (P ~ 0.05). On the contrary, the visualization of the 4. Further studies are necessary to confirm the abili-
ED-ES in nondiseased ears of patients with MD was not ty of MRI to depict and differentiate the different
statistically different from that in ears of control sub- stages of MD. If this proves to be true, MRI may
jects. become a useful means for planning individually
It is probable that an adequately visible ED-ES com- the best therapeutical approach for each patient.
plex with MRI has to do with the stage and phase
REFERENCES
(active-nonactive) of the disease.17 Linthicum and
Xenellis18 disclosed that the temporal bones of patients 1. Committee on Hearing and Equilibrium guidelines for the diag-
nosis and evaluation of therapy in Meniere’s disease. Otolaryngol
with MD with hearing loss (0.5, 1.0, and 2.0 kHz) of 65 Head Neck Surg 1995;113:181-5.
dB or greater showed small or obliterated ES and a far 2. Meniere P. Sur une form de surdite grave dependant d’une lesion
advanced EH with a severe deformation of the normal de l’oreille interne. Gar Med Paris 1861;16:29.
3. Schuknecht HF. Disorders of unknown or multiple causes. In:
histoanatomic architecture of the membranous inner Schuknecht HF, editor. Pathology of the ear. 2nd ed. Philadel-
ear. Accordingly, the passage of endolymph from the phia: Lea and Febiger; 1993. p. 499-519.
pars superior and inferior to the ES in cases such is 4. Kimura RS. Experimental blockage of the endolymphatic duct and
sac and its effect on the inner ear of the guinea pig. A study on
probably obstructed. Schuknecht and Ruther19 described endolymphatic hydrops. Ann Otol Rhinol Laryngol 1967;76:664-87.
the possible areas of blockage of the longitudinal flow 5. Clemis SD, Valvassori GE. Recent radiographic and clinical
6. Otolaryngology–
Head and Neck Surgery
Volume 123 Number 1 Part 1 XENELLIS et al 119
observations on the vestibular aqueduct (a preliminary report). 13. Yuen SS, Schuknecht H. Vestibular aqueduct and endolymphatic
Otolaryngol Clin North Am 1968;1:339-46. duct in Meniere’s disease. Arch Otolaryngol 1972;96:553-5.
6. Stahle J, Wilbrand H. The vestibular aqueduct in patients with 14. Sando J, Ikeda M. The vestibular aqueduct in patients with
Meniere’s disease. A tomographic and clinical investigation. Acta Meniere’s disease: a temporal bone histopathological investiga-
Otolaryngol (Stockh) 1974;78:36-48. tion. Acta Otolaryngol (Stockh) 1984;97:558-70.
7. Stephen FH, Fitzgerald O’Connor, et al. Significance of tomog- 15. Valvassori G, Dobben G. Multidirectional and CT of the vestibu-
raphy in Meniere’s disease: periaqueductal pneumatization. lar aqueduct in Meniere’s disease. Ann Otol Rhinol Laryngol
Laryngoscope 1983;93:1551-3. 1983;93:547-50.
8. Kraus EM, Dubois PJ. Tomography of the vestibular aqueduct in 16. Tanioka H, Zusho H, Machida T et al. High resolution MR imag-
ear disease. Arch Otolaryngol 1979;105:91-8. ing of the inner ear: findings in Meniere’s disease. Eur J Radiol
9. Sackett JF, Korareck JA, Arenberg IK. The clinical significance 1992;15:83-8.
of tomographic visualization or nonvisualization of the vestibular 17. Tanioka H, Kimitaka K, Zusho H, et al. MR of the endolymphat-
aqueduct. Otolaryngol Clin North Am 1980;13:657-64. ic duct and sac: findings in Meniere disease. AJNR Am J
10. Lundquist PG. The endolymphatic duct and sac in the guinea pig. Neuroradiol 1997;18:45-51.
An electron microscopic and experimental investigation. Acta 18. Linthicum FH Jr, Xenellis JE. Pathophysiological mechanisms to
Otolaryngol (Stockh) 1965;Suppl 201:1. Meniere’s syndrome based on infrared oculography and
11. Brogan M, Chakeres DN, Schmalbrock P. High resolution 3DF histopathology. Proceedings of the 4th International Symposium
MR imaging of the endolymphatic duct and soft tissues of otic on Meniere’s disease.
capsule. AJNR Am J Neuroradiol 1991;12:1-11. 19. Schuknecht HF, Ruther A. Blockage of longitudinal flow in
12. Egami T, Sando I. Pathology of the vestibular aqueduct and endolymphatic hydrops. Eur Arch Otorhinolaryngol 1991;248:
endolymphatic sac in temporal bones with endolymphatic hy- 209-17.
drops. In: Hood JD, editor. Vestibular mechanisms in health and 20. Feghali JG, Linthicum FH Jr, Xenellis SE. Is the endolymphatic sac
disease. London: Academic Press; 1978. p. 122-8. always accessible? Otolaryngol Head Neck Surg 1985;93:21-4.
Brachytherapy Workshop
The 3rd Workshop on Brachytherapy in Head and Neck Cancer will be held August
27-29, 2000, in Kiel, Germany. Chairmen are Prof Dr H. Rudert and Prof Dr G.
Kovács.
For further information, contact S. Gottschlich, MD, Department of Otorhino-
laryngology–Head and Neck Surgery, University of Kiel, Arnold-Heller-Strasse 14, D-
24105 Kiel, Germany; phone, 49-431-5972321; fax, 49-431-5972272; e-mail, rud-
ert@hno-uni-kiel.de.