SlideShare uma empresa Scribd logo
1 de 1
Baixar para ler offline
Roads and deforestation in the Central Peruvian Amazon
                      Glenn Hyman and Elizabeth Barona, International Center for Tropical Agriculture (CIAT), Cali, Colombia

Since the middle of the last century road development has been a key proximate
cause of deforestation in the Central Peruvian Amazon. Less clear are the
underlying causes of deforestation and how they vary over time and across the
landscape. This study reconstructed the development of the road network in the
Aguaytia watershed and nearby Ucayali River floodplain since 1950. The study
uses remote sensing imagery, censuses and other secondary data to reveal the
proximate and underlying causes of deforestation. Road development, shifting
cultivation, cattle ranching, migration, population growth and government policies all
feature prominently in deforestation dynamics in the region. The study showed that
the proximate and underlying drivers of deforestation vary substantially across the
landscape and over the last 60 years. This case study links the spatial and temporal
pattern of deforestation to the development of the road network and the underlying
causes of deforestation in the region.

           Deforestation patterns
                                                                              Central Peruvian
                                                                              Amazon Study
                                                                              Area                                                                                                                                                                           1950’s
   Diffuse                                                                                                                                                                                                                                                   1960’s
                                                                              •Watershed and                                                                                 1970’s
                                                                              Floodplain area of                                                                             1980’s

                                                                              16, 970 km2                                                                                    1990’s

                                                                              •Floodplain area
                                                                              is 3,264 km2
                                                                              •Approximately      Road development
                                                                              300,000 people
                                                                              live in city of     1. Long trajectories connecting to rivers: the most important road connection in the region is
                                                  Geometric
     Corridor                                                                 Pucallpa               the Federico Basadre road connecting the Ucayali port town of Pucallpa to the Andes and
                                                                              •75,000 people         to Lima. In the 1960s, the government built connector roads between this main road and
                                                                              live in rural areas    the Aguaytia River to the north and the Ucayali to the South. Govenrment initiatives
                                                                              around the city        developed more recent connections between the Federico Basadre highway and the
                                                                                                     Aguaytia River to the North in the 1970s.
                              Island
                                                                                                       2. Incremental extension over decades: several roads extending perpendicular to the
                                                                                                          Federico Basdre highway have developed in an incremental manner over the decades.
Patterns of deforestation in the central Peruvian Amazon suggest several different
processes and driving forces. Diffuse patches suggest selective logging and possibly                   3. Logging roads in remote areas: many remote areas are marked by roads developed solely
illegal crop production. The island pattern also suggests the possibility of illegal                      for the extraction of timber.
production of coca plants.The corridor pattern shows government efforts to link a major
road to an important river in the region. The most prominent pattern is the large                                                            Proximate and underlying driving forces of deforestation in
geometric shapes that are associated with most of the land-use change in the area.                                                           the Central Peruvian Amazon
                                                                                                                                                                                 Proximate                                                      Underlying
            Primary Forest          Cleared Land
                                                      The geometric patterns described
                                                      above suggest a conceptual model                                                       1960’s                              •Road expansion                                                •migration
                                      T1              of land use change. The government                                                                                         •Colonization
                                            Urban
                                                      established land parcels for                                                                                               •Pasture expansion
                                           T2         distribution to colonists in their larger
                                             T3                                                                                              1970’s                              •Road expansion                                                •Migration
                                                      efforts to settle the Amazon. The first
Conceptual Model of                           T4
                                                      arrivals settled in the lots closest to                                                                                    •Timber extraction                                             •population growth
Settlement Over Time                                  cities or towns. Subsequent colonists                                                                                      •Colonization
                                                      settled progressively further from the                                                                                     •Shifting cultivation
                                                      urban area.                                                                                                                •Pasture expansion
                                                                                                                                             1980’s                              •Road expansion                                                •Agricultural credit policy
Land clearing advanced at a steady pace perpendicular to the road. Because both
                                                                                                                                                                                 •Timber extraction                                             •Forestry sector
settlement and land clearing advanced within a similar time frame, the resulting                                                                                                                                                                development
                                                                                                                                                                                 •Shifting cultivation
deforestation pattern resembles a triangle or pyramid.
                                                                                                                                                                                 •Coca production                                               •Migration
                                                                                                                                                                                                                                                •Population growth


                                                                                                                                             1990’s                              •Oil palm development                                          •Migration
                                                                                                                                                                                 •Shifting cultivation                                          •Population growth
                                                                                                                                                                                 •Coca production
                                                                                                                                             2000’s                              •Oil palm development                                          •Migration

                                                                                                                 The table above lists the proximate and underlying driving forces of deforestation in the
                                                                                                                 Central Peruvian Amazon. Road construction is clearly the dominant proximate driving
                                                                                                                 force. Timber extraction, shifting cultivation and pasture expansion also predominate.
                                                                                                                 Other key proximate forces are coca and oil palm production. The key underlying factors
                                                                                                                 in deforestation of this region are related to population. Migrants from the Andes, who
Represented dynamically, the deforestation pattern is similar to a boat’s bow wave.                              may have been pushed out by the lack of land there, have arrived to the Amazon in the
As settlement extends away from cities or towns deforestation advances                                           hopes of taking advantage of abundant natural resources. This region of the Amazon also
perpendicular to roads. Our research shows substantial differences in demographic                                has one of the highest fertility rates in all of Peru. Other underlying forces include
characteristics, living standards, livelihood activities and other characteristics                               changes in national agricultural and forestry development policies.
depending on where a village or household is situated along the spatial and temporal
land-use continuum.                                                                                                    600,000                                                                                       30,000,000
                                                                                                                                                                                                                                  A                            B
                                                                                                                       500,000                                                                                       25,000,000
                                                                                                   Miles de personas


                                                                                                                       400,000                                                                                       20,000,000

                                                      The photographs on the left shows some                           300,000                                                                                       15,000,000


                                                      typical road landscapes in the central                           200,000

                                                                                                                       100,000
                                                                                                                                                                                                                     10,000,000

                                                                                                                                                                                                                     5,000,000

                                                      Peruvian Amazon. Even the main road                                      0
                                                                                                                                     1940     1961     1972     1981      1993     2007      2010*   2015*   2020*
                                                                                                                                                                                                                     0


                                                      connecting Lima to Pucallpa has                                   Ucayali
                                                                                                                        Perú
                                                                                                                                    16,154   64,161   120,501 163,208 314,810 432,159 455,497 493,736 530,881
                                                                                                                                   6,207,9679,906,74613,538,20 17,005,2122,048,3527,412,15

                                                      substantial sections that have not yet                                                                                                                                                                          C
                                                      been paved. Most of the roads in the
                                                      region are gravel or improved dirt. Many
                                                      of the roads end at the site of activities                                                                                                                                  A – Aster image
                                                      such as timber extraction.                                                                                                                                                  B – Google Earth
                                                                                                                                                                                                                                  C – Google Earth close-up where you
                                                                                                                                                                                                                                  can see the palm plantation canopy

Mais conteúdo relacionado

Mais de Decision and Policy Analysis Program

Logros alcanzados en servicios climáticos en el sector agropecuario de la reg...
Logros alcanzados en servicios climáticos en el sector agropecuario de la reg...Logros alcanzados en servicios climáticos en el sector agropecuario de la reg...
Logros alcanzados en servicios climáticos en el sector agropecuario de la reg...Decision and Policy Analysis Program
 
Servicios Integrados Participativos de Clima para la Agricultura (PICSA)
Servicios Integrados Participativos de Clima para la Agricultura (PICSA)Servicios Integrados Participativos de Clima para la Agricultura (PICSA)
Servicios Integrados Participativos de Clima para la Agricultura (PICSA)Decision and Policy Analysis Program
 
Potencialidades y desafíos en el corredor seco Centroamericano frente al camb...
Potencialidades y desafíos en el corredor seco Centroamericano frente al camb...Potencialidades y desafíos en el corredor seco Centroamericano frente al camb...
Potencialidades y desafíos en el corredor seco Centroamericano frente al camb...Decision and Policy Analysis Program
 
Modelación de Cultivos para generar Servicios Agroclimáticos (Aquacrop V6.0)
Modelación de Cultivos para generar Servicios Agroclimáticos (Aquacrop V6.0)Modelación de Cultivos para generar Servicios Agroclimáticos (Aquacrop V6.0)
Modelación de Cultivos para generar Servicios Agroclimáticos (Aquacrop V6.0)Decision and Policy Analysis Program
 
Vulnerabilidad de los productores ante la variabilidad y el cambio climático
Vulnerabilidad de los productores ante la variabilidad y el cambio climáticoVulnerabilidad de los productores ante la variabilidad y el cambio climático
Vulnerabilidad de los productores ante la variabilidad y el cambio climáticoDecision and Policy Analysis Program
 
Introducción a la problemática del cambio climático global y observación de c...
Introducción a la problemática del cambio climático global y observación de c...Introducción a la problemática del cambio climático global y observación de c...
Introducción a la problemática del cambio climático global y observación de c...Decision and Policy Analysis Program
 
Importancia de los pronósticos aplicados al sector agrícola durante la crisis...
Importancia de los pronósticos aplicados al sector agrícola durante la crisis...Importancia de los pronósticos aplicados al sector agrícola durante la crisis...
Importancia de los pronósticos aplicados al sector agrícola durante la crisis...Decision and Policy Analysis Program
 
Training on Participatory Integrated Climate Services for Agriculture (PICSA)...
Training on Participatory Integrated Climate Services for Agriculture (PICSA)...Training on Participatory Integrated Climate Services for Agriculture (PICSA)...
Training on Participatory Integrated Climate Services for Agriculture (PICSA)...Decision and Policy Analysis Program
 
Perspectivas y escenario futuros de la producción de frijol ante el cambio cl...
Perspectivas y escenario futuros de la producción de frijol ante el cambio cl...Perspectivas y escenario futuros de la producción de frijol ante el cambio cl...
Perspectivas y escenario futuros de la producción de frijol ante el cambio cl...Decision and Policy Analysis Program
 
Apoyo en la toma de decisiones en agricultura a través de las Mesas Técnicas ...
Apoyo en la toma de decisiones en agricultura a través de las Mesas Técnicas ...Apoyo en la toma de decisiones en agricultura a través de las Mesas Técnicas ...
Apoyo en la toma de decisiones en agricultura a través de las Mesas Técnicas ...Decision and Policy Analysis Program
 

Mais de Decision and Policy Analysis Program (20)

Propuesta Servicios Climáticos región del SICA CAC/CIAT
Propuesta Servicios Climáticos región del SICA CAC/CIATPropuesta Servicios Climáticos región del SICA CAC/CIAT
Propuesta Servicios Climáticos región del SICA CAC/CIAT
 
Logros alcanzados en servicios climáticos en el sector agropecuario de la reg...
Logros alcanzados en servicios climáticos en el sector agropecuario de la reg...Logros alcanzados en servicios climáticos en el sector agropecuario de la reg...
Logros alcanzados en servicios climáticos en el sector agropecuario de la reg...
 
Servicios Integrados Participativos de Clima para la Agricultura (PICSA)
Servicios Integrados Participativos de Clima para la Agricultura (PICSA)Servicios Integrados Participativos de Clima para la Agricultura (PICSA)
Servicios Integrados Participativos de Clima para la Agricultura (PICSA)
 
Potencialidades y desafíos en el corredor seco Centroamericano frente al camb...
Potencialidades y desafíos en el corredor seco Centroamericano frente al camb...Potencialidades y desafíos en el corredor seco Centroamericano frente al camb...
Potencialidades y desafíos en el corredor seco Centroamericano frente al camb...
 
Servicios Climaticos para la Agricultura (FIMA)
Servicios Climaticos para la Agricultura (FIMA)Servicios Climaticos para la Agricultura (FIMA)
Servicios Climaticos para la Agricultura (FIMA)
 
Servicios Climaticos para la Agricultura (FAO-PLACA)
Servicios Climaticos para la Agricultura (FAO-PLACA)Servicios Climaticos para la Agricultura (FAO-PLACA)
Servicios Climaticos para la Agricultura (FAO-PLACA)
 
Modelación de impactos de cambio climático en agricultura
Modelación de impactos de cambio climático en agriculturaModelación de impactos de cambio climático en agricultura
Modelación de impactos de cambio climático en agricultura
 
Modelación de Cultivos para generar Servicios Agroclimáticos (Aquacrop V6.0)
Modelación de Cultivos para generar Servicios Agroclimáticos (Aquacrop V6.0)Modelación de Cultivos para generar Servicios Agroclimáticos (Aquacrop V6.0)
Modelación de Cultivos para generar Servicios Agroclimáticos (Aquacrop V6.0)
 
Servicios Climáticos para la Agricultura (ANSC-Guatemala)
Servicios Climáticos para la Agricultura (ANSC-Guatemala)Servicios Climáticos para la Agricultura (ANSC-Guatemala)
Servicios Climáticos para la Agricultura (ANSC-Guatemala)
 
Modelación climática; Cambio climático y agricultura
Modelación climática; Cambio climático y agriculturaModelación climática; Cambio climático y agricultura
Modelación climática; Cambio climático y agricultura
 
Vulnerabilidad de los productores ante la variabilidad y el cambio climático
Vulnerabilidad de los productores ante la variabilidad y el cambio climáticoVulnerabilidad de los productores ante la variabilidad y el cambio climático
Vulnerabilidad de los productores ante la variabilidad y el cambio climático
 
Modelacion de cultivos para generar servicios agroclimaticos
Modelacion de cultivos para generar servicios agroclimaticosModelacion de cultivos para generar servicios agroclimaticos
Modelacion de cultivos para generar servicios agroclimaticos
 
Introducción a los servicios climáticos
Introducción a los servicios climáticosIntroducción a los servicios climáticos
Introducción a los servicios climáticos
 
Introducción a la problemática del cambio climático global y observación de c...
Introducción a la problemática del cambio climático global y observación de c...Introducción a la problemática del cambio climático global y observación de c...
Introducción a la problemática del cambio climático global y observación de c...
 
Servicios climáticos para la agricultura en América Latina
Servicios climáticos para la agricultura en América LatinaServicios climáticos para la agricultura en América Latina
Servicios climáticos para la agricultura en América Latina
 
Importancia de los pronósticos aplicados al sector agrícola durante la crisis...
Importancia de los pronósticos aplicados al sector agrícola durante la crisis...Importancia de los pronósticos aplicados al sector agrícola durante la crisis...
Importancia de los pronósticos aplicados al sector agrícola durante la crisis...
 
Mesas Técnicas Agroclimáticas en Centro América
Mesas Técnicas Agroclimáticas en Centro AméricaMesas Técnicas Agroclimáticas en Centro América
Mesas Técnicas Agroclimáticas en Centro América
 
Training on Participatory Integrated Climate Services for Agriculture (PICSA)...
Training on Participatory Integrated Climate Services for Agriculture (PICSA)...Training on Participatory Integrated Climate Services for Agriculture (PICSA)...
Training on Participatory Integrated Climate Services for Agriculture (PICSA)...
 
Perspectivas y escenario futuros de la producción de frijol ante el cambio cl...
Perspectivas y escenario futuros de la producción de frijol ante el cambio cl...Perspectivas y escenario futuros de la producción de frijol ante el cambio cl...
Perspectivas y escenario futuros de la producción de frijol ante el cambio cl...
 
Apoyo en la toma de decisiones en agricultura a través de las Mesas Técnicas ...
Apoyo en la toma de decisiones en agricultura a través de las Mesas Técnicas ...Apoyo en la toma de decisiones en agricultura a través de las Mesas Técnicas ...
Apoyo en la toma de decisiones en agricultura a través de las Mesas Técnicas ...
 

Roads and deforestation in the central peruvian amazon

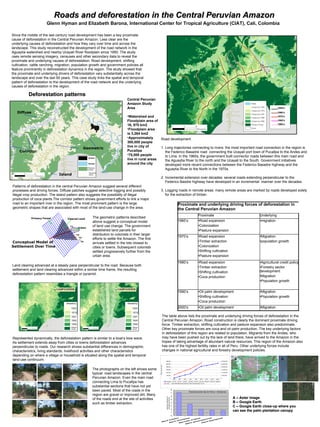
  • 1. Roads and deforestation in the Central Peruvian Amazon Glenn Hyman and Elizabeth Barona, International Center for Tropical Agriculture (CIAT), Cali, Colombia Since the middle of the last century road development has been a key proximate cause of deforestation in the Central Peruvian Amazon. Less clear are the underlying causes of deforestation and how they vary over time and across the landscape. This study reconstructed the development of the road network in the Aguaytia watershed and nearby Ucayali River floodplain since 1950. The study uses remote sensing imagery, censuses and other secondary data to reveal the proximate and underlying causes of deforestation. Road development, shifting cultivation, cattle ranching, migration, population growth and government policies all feature prominently in deforestation dynamics in the region. The study showed that the proximate and underlying drivers of deforestation vary substantially across the landscape and over the last 60 years. This case study links the spatial and temporal pattern of deforestation to the development of the road network and the underlying causes of deforestation in the region. Deforestation patterns Central Peruvian Amazon Study Area 1950’s Diffuse 1960’s •Watershed and 1970’s Floodplain area of 1980’s 16, 970 km2 1990’s •Floodplain area is 3,264 km2 •Approximately Road development 300,000 people live in city of 1. Long trajectories connecting to rivers: the most important road connection in the region is Geometric Corridor Pucallpa the Federico Basadre road connecting the Ucayali port town of Pucallpa to the Andes and •75,000 people to Lima. In the 1960s, the government built connector roads between this main road and live in rural areas the Aguaytia River to the north and the Ucayali to the South. Govenrment initiatives around the city developed more recent connections between the Federico Basadre highway and the Aguaytia River to the North in the 1970s. Island 2. Incremental extension over decades: several roads extending perpendicular to the Federico Basdre highway have developed in an incremental manner over the decades. Patterns of deforestation in the central Peruvian Amazon suggest several different processes and driving forces. Diffuse patches suggest selective logging and possibly 3. Logging roads in remote areas: many remote areas are marked by roads developed solely illegal crop production. The island pattern also suggests the possibility of illegal for the extraction of timber. production of coca plants.The corridor pattern shows government efforts to link a major road to an important river in the region. The most prominent pattern is the large Proximate and underlying driving forces of deforestation in geometric shapes that are associated with most of the land-use change in the area. the Central Peruvian Amazon Proximate Underlying Primary Forest Cleared Land The geometric patterns described above suggest a conceptual model 1960’s •Road expansion •migration T1 of land use change. The government •Colonization Urban established land parcels for •Pasture expansion T2 distribution to colonists in their larger T3 1970’s •Road expansion •Migration efforts to settle the Amazon. The first Conceptual Model of T4 arrivals settled in the lots closest to •Timber extraction •population growth Settlement Over Time cities or towns. Subsequent colonists •Colonization settled progressively further from the •Shifting cultivation urban area. •Pasture expansion 1980’s •Road expansion •Agricultural credit policy Land clearing advanced at a steady pace perpendicular to the road. Because both •Timber extraction •Forestry sector settlement and land clearing advanced within a similar time frame, the resulting development •Shifting cultivation deforestation pattern resembles a triangle or pyramid. •Coca production •Migration •Population growth 1990’s •Oil palm development •Migration •Shifting cultivation •Population growth •Coca production 2000’s •Oil palm development •Migration The table above lists the proximate and underlying driving forces of deforestation in the Central Peruvian Amazon. Road construction is clearly the dominant proximate driving force. Timber extraction, shifting cultivation and pasture expansion also predominate. Other key proximate forces are coca and oil palm production. The key underlying factors in deforestation of this region are related to population. Migrants from the Andes, who Represented dynamically, the deforestation pattern is similar to a boat’s bow wave. may have been pushed out by the lack of land there, have arrived to the Amazon in the As settlement extends away from cities or towns deforestation advances hopes of taking advantage of abundant natural resources. This region of the Amazon also perpendicular to roads. Our research shows substantial differences in demographic has one of the highest fertility rates in all of Peru. Other underlying forces include characteristics, living standards, livelihood activities and other characteristics changes in national agricultural and forestry development policies. depending on where a village or household is situated along the spatial and temporal land-use continuum. 600,000 30,000,000 A B 500,000 25,000,000 Miles de personas 400,000 20,000,000 The photographs on the left shows some 300,000 15,000,000 typical road landscapes in the central 200,000 100,000 10,000,000 5,000,000 Peruvian Amazon. Even the main road 0 1940 1961 1972 1981 1993 2007 2010* 2015* 2020* 0 connecting Lima to Pucallpa has Ucayali Perú 16,154 64,161 120,501 163,208 314,810 432,159 455,497 493,736 530,881 6,207,9679,906,74613,538,20 17,005,2122,048,3527,412,15 substantial sections that have not yet C been paved. Most of the roads in the region are gravel or improved dirt. Many of the roads end at the site of activities A – Aster image such as timber extraction. B – Google Earth C – Google Earth close-up where you can see the palm plantation canopy