Herrera b 2012_breve_turorial_openmodeller
•Transferir como PPTX, PDF•
0 gostou•307 visualizações

Este documento describe varias herramientas y métodos para generar recomendaciones de sitios específicos utilizando una variedad de modelos de distribución de especies en la plataforma de código abierto OpenModeller. Incluye información sobre el administrador de variables, administrador de algoritmos, buscador de localidades, formato de datos requeridos y cómo crear y correr proyectos de modelado, evaluar resultados e identificar puntos críticos.

Recomendados
Recomendados
Mais conteúdo relacionado
Mais de Decision and Policy Analysis Program
Mais de Decision and Policy Analysis Program (20)
Herrera b 2012_breve_turorial_openmodeller
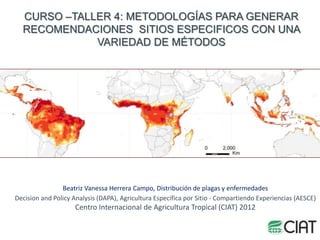
- 1. CURSO –TALLER 4: METODOLOGÍAS PARA GENERAR RECOMENDACIONES SITIOS ESPECIFICOS CON UNA VARIEDAD DE MÉTODOS Beatriz Vanessa Herrera Campo, Distribución de plagas y enfermedades Decision and Policy Analysis (DAPA), Agricultura Especifica por Sitio - Compartiendo Experiencias (AESCE) Centro Internacional de Agricultura Tropical (CIAT) 2012
- 2. Modelos de Distribución de Especies- Plataformas de libre acceso http://openmodeller.sourceforge.net/
- 4. Menú Administrador de juegos de variables (Layer set manager) Administrador de Algoritmos – Modelos (Algorithm profile) Nuevo Proyecto Pre-análisis (Jakniffe- Chi-square) Herramienta para busqueda de registros (Localities search tool) Split registers Hot spot mapping (selección de umbrales) Exportar archivos .csv Correr evaluación externa
- 5. Administrador de variables (Layer set manager) •Crear un nuevo conjunto de variables Detalles: •Nombrar el conjunto de variables •Agregar una descripción, aqui debe estar la resolución de las variables y una caracteristica. •Adicionar el directorio donde se encuentran las variables y seleccionar las variables que harán parte del juego de datos •Mask layer: seleccionar una de las variables que estan en el juego de datos
- 6. Administrador de variables (Layer set manager)
- 7. Administrador de Algoritmos – Modelos (Algorithm profile) Openmodeller es una libreria de modelos El administrador de algoritmos permite hacer copias de cada modelo y modificar los parámetros de acuerdo a criterios especificos “avanzado”
- 8. Buscador de localidades Esta ligado a la base de datos del Facilitador Global de Información de Biodiversidad (GBIF) •Elegir “GBIF REST” para resultados más optimos. •Adicionar el “termino de busqueda” •Seleccionar la ruta del archivo de salida •Ajustar el número mínimo de registros por especie
- 9. Antes de ir al administrador de nuevos proyectos… 1. Formato de los datos de Ocurrencia *Archivo .txt: debe contener las siguientes campos (separados por la tecla Tab), pero no debe contener encabezado! ID-tab-Nombre de la especie-tab-Longitud-tab-Latitud-tab-Abundancia (opcional) Acceso a bases de datos de GBIF directamente desde Openmodeller Desktop
- 10. Antes de ir al administrador de nuevos proyectos… 2. Formato de las variables ambientales Las variables ambientales deben de estar en formato ASCII GRID. Tamaño N col de celda N filas ND ND ND ND ND ND ND ND 5 5 5 ND ND ND ND ND 5 5 ND ND ND ND ND 5 5 85 25 ND ND ND 25 25 85 85 ND ND ND ND ND 25 90 ND ND ND ND ND ND 90 90 ND ND ND ND ND ND ND Algunas bases de datos de clima pueden descargarse directamente con el programa Worldclim http://www.worldclim.org/current Otras Climond https://www.climond.org/Download.aspx
- 12. Después de correr… •Explorar tabla de valores de cada variable sobre cada punto • Visualizar el mapa de cada especie por cada modelo •Exportar imagen del resultado de cada modelo
- 13. Otras funcionalidades Exportar a PDF Modificar el directorio de salida de archivos Imprimir un reporte de Modelos Imprimir un reporte del experimento
- 14. Mapeo de hotspots y umbrales Se debe seleccionar un umbral. Este valor se usa para determinar las áreas de coincidencia de los modelos. Seleccionar directorio de salida
- 15. Mapeo de hotspots y umbrales El mapa final muestra el número de modelos o de especies que coinciden en un mismo pixel por encima de un determinado umbral
Notas do Editor
- The project is currently being developed by the Centro de ReferênciaemInformaçãoAmbiental (CRIA), EscolaPolitécnicada USP (Poli), and InstitutoNacional de PesquisasEspaciais (INPE) as an open-source initiative. It is funded by Fundação de Amparo à Pesquisa do Estado de São Paulo (FAPESP), the Incofish project, and by individuals that have generously contributed their time. Previous collaborators include the BDWorld project (University of Reading), the University of Kansas Natural History Museum & Biodiversity Research Center (KU), and other individual participants.
- Layer Set ManagerUse the layer set manager to define layer sets. Layer sets are named groups of layers. In openModeller Desktop you use layer sets to specify the raster layers that should be used for creating models and for projecting models.Algorithm ManagerThe authors of openModeller algorithms provide sensible defaults for each algorithm. With the algorithm manager you can cutomise these defaults to make the algorithm perform in a way more suited to your needs. The default algorithm parameters are called 'System Profiles'. You can clone any profile using the algorithm manager to create a 'User Profile', and then customise the user profile as you like.Experiment DesignerOnce you have defined at least one layer set and have some occurrence data available, you can use the experiment designer to prepare an experiment. An experiment is a collection of models. Once the experiment has been created, it will be loaded in the experiment tree on the left of this window, and you will be asked if you wish to start running the experiment.Threshold ToolThe threshold tool creates boolean model projection rasters from probability range rasters using a Minimum Cut-off Threshold Percentage. Using this tool you can:Create a model projection map that shows only cells that were above a specific probabilty of occurrence.Create a 'hotspot' map showing predicted alpha biodiversity based on the number of thresholded probability layers for different taxa predicting presence in each cell.Create a 'consensus' model showing number of thresholded models predicting presence in each cell.To perform a threshold analysis, you can select any number of models from the experiment tree. Only succaessfully completed model projections are shown in the tree. A thumbnail preview of each model is drawn next to each entry in the tree. By sorting the tree by taxon or by algorithm, you can easily select a group of model projections. Selecting one or more taxa from the same algorithm group (sort by algorithm view) will effectively perform a 'hotspot' analysis, where each cell in the output raster represents the number of taxa predicted presence in that cell based on the defined Minimum Cut-off Threshold Percentage. Selecting one or more algorithms for a given taxon (sort by taxon view) will allow you to create a 'consensus model'.In a consensus model, the value of each cell in the output raster indicates the number of algorithms that predict presence for that cell - based on the Minimum Cut-off Threshold Percentage selected. Optionally you can write out each model projection as a boolean layer where 0 indicates absence and 1 indicates presence, based on the Minimum Cut-off Threshold Percentage selected.While the experiment is running you can browse the results of models as they are completed. Click on a taxon node (when sort by taxon is enabled) or an algorithm node (when sort by algorithm is enabled) for a thumbnail overview of completed model projections. Model nodes in the tree are marked with the following symbols according to the model status:
- Layer Set ManagerUse the layer set manager to define layer sets. Layer sets are named groups of layers. In openModeller Desktop you use layer sets to specify the raster layers that should be used for creating models and for projecting models.Algorithm ManagerThe authors of openModeller algorithms provide sensible defaults for each algorithm. With the algorithm manager you can cutomise these defaults to make the algorithm perform in a way more suited to your needs. The default algorithm parameters are called 'System Profiles'. You can clone any profile using the algorithm manager to create a 'User Profile', and then customise the user profile as you like.Experiment DesignerOnce you have defined at least one layer set and have some occurrence data available, you can use the experiment designer to prepare an experiment. An experiment is a collection of models. Once the experiment has been created, it will be loaded in the experiment tree on the left of this window, and you will be asked if you wish to start running the experiment.Threshold ToolThe threshold tool creates boolean model projection rasters from probability range rasters using a Minimum Cut-off Threshold Percentage. Using this tool you can:Create a model projection map that shows only cells that were above a specific probabilty of occurrence.Create a 'hotspot' map showing predicted alpha biodiversity based on the number of thresholded probability layers for different taxa predicting presence in each cell.Create a 'consensus' model showing number of thresholded models predicting presence in each cell.To perform a threshold analysis, you can select any number of models from the experiment tree. Only succaessfully completed model projections are shown in the tree. A thumbnail preview of each model is drawn next to each entry in the tree. By sorting the tree by taxon or by algorithm, you can easily select a group of model projections. Selecting one or more taxa from the same algorithm group (sort by algorithm view) will effectively perform a 'hotspot' analysis, where each cell in the output raster represents the number of taxa predicted presence in that cell based on the defined Minimum Cut-off Threshold Percentage. Selecting one or more algorithms for a given taxon (sort by taxon view) will allow you to create a 'consensus model'.In a consensus model, the value of each cell in the output raster indicates the number of algorithms that predict presence for that cell - based on the Minimum Cut-off Threshold Percentage selected. Optionally you can write out each model projection as a boolean layer where 0 indicates absence and 1 indicates presence, based on the Minimum Cut-off Threshold Percentage selected.While the experiment is running you can browse the results of models as they are completed. Click on a taxon node (when sort by taxon is enabled) or an algorithm node (when sort by algorithm is enabled) for a thumbnail overview of completed model projections. Model nodes in the tree are marked with the following symbols according to the model status:
- localities search tool to automatically retrieve species occurrence data. The localities search tool is plugin based so we provide search functionality against various online resources such as GBIF and speciesLink. More data sources will be added over time. If you need a custom search plugin for your institution please contact us (tim@linfiniti.com) - we may be able to help
- occurrence files need to be in the following format:#ID-tab-Taxon Name-tab-Longitude-tab-Latitude-tab-Abundance (optional) Lines starting with # are ignored.The -tab- markers above should be the inserted by pressing the tab key on your keyboard.The Id can be a number, text or combination there-of.The taxon name should be separated with spaces and may include specific and subspecific epithet. Note that names should be identical for the ths same taxon otherwise openModeller Desktop will treat each name variation as a separate taxon.The abundance column is optional. An abundance of 0 is used to indicate an absence record. Note that not all openModeller algorithms support the use of absence data.You can automatically retrieve occurrence data using the openModeller Desktop localities search tool (see below). We recommend using the 'GBIF Rest' option for best results.Here is a worked example of a typical occurrences file:#ID Taxon Name Longitude Latitude Abundance 23842684 Acacia cyclops 115.76 -31.98 1 23842770 Acacia cyclops 120.867 -33.7166 1 23842772 Acacia cyclops 121.33 -33.8 1 23842910 Acacia cyclops 115.767 -32.115 0 23843184 Acacia cyclops 115.733 -32.05 1
- Layer Set ManagerUse the layer set manager to define layer sets. Layer sets are named groups of layers. In openModeller Desktop you use layer sets to specify the raster layers that should be used for creating models and for projecting models.Algorithm ManagerThe authors of openModeller algorithms provide sensible defaults for each algorithm. With the algorithm manager you can cutomise these defaults to make the algorithm perform in a way more suited to your needs. The default algorithm parameters are called 'System Profiles'. You can clone any profile using the algorithm manager to create a 'User Profile', and then customise the user profile as you like.Experiment DesignerOnce you have defined at least one layer set and have some occurrence data available, you can use the experiment designer to prepare an experiment. An experiment is a collection of models. Once the experiment has been created, it will be loaded in the experiment tree on the left of this window, and you will be asked if you wish to start running the experiment.Threshold ToolThe threshold tool creates boolean model projection rasters from probability range rasters using a Minimum Cut-off Threshold Percentage. Using this tool you can:Create a model projection map that shows only cells that were above a specific probabilty of occurrence.Create a 'hotspot' map showing predicted alpha biodiversity based on the number of thresholded probability layers for different taxa predicting presence in each cell.Create a 'consensus' model showing number of thresholded models predicting presence in each cell.To perform a threshold analysis, you can select any number of models from the experiment tree. Only succaessfully completed model projections are shown in the tree. A thumbnail preview of each model is drawn next to each entry in the tree. By sorting the tree by taxon or by algorithm, you can easily select a group of model projections. Selecting one or more taxa from the same algorithm group (sort by algorithm view) will effectively perform a 'hotspot' analysis, where each cell in the output raster represents the number of taxa predicted presence in that cell based on the defined Minimum Cut-off Threshold Percentage. Selecting one or more algorithms for a given taxon (sort by taxon view) will allow you to create a 'consensus model'.In a consensus model, the value of each cell in the output raster indicates the number of algorithms that predict presence for that cell - based on the Minimum Cut-off Threshold Percentage selected. Optionally you can write out each model projection as a boolean layer where 0 indicates absence and 1 indicates presence, based on the Minimum Cut-off Threshold Percentage selected.While the experiment is running you can browse the results of models as they are completed. Click on a taxon node (when sort by taxon is enabled) or an algorithm node (when sort by algorithm is enabled) for a thumbnail overview of completed model projections. Model nodes in the tree are marked with the following symbols according to the model status:
- Layer Set ManagerUse the layer set manager to define layer sets. Layer sets are named groups of layers. In openModeller Desktop you use layer sets to specify the raster layers that should be used for creating models and for projecting models.Algorithm ManagerThe authors of openModeller algorithms provide sensible defaults for each algorithm. With the algorithm manager you can cutomise these defaults to make the algorithm perform in a way more suited to your needs. The default algorithm parameters are called 'System Profiles'. You can clone any profile using the algorithm manager to create a 'User Profile', and then customise the user profile as you like.Experiment DesignerOnce you have defined at least one layer set and have some occurrence data available, you can use the experiment designer to prepare an experiment. An experiment is a collection of models. Once the experiment has been created, it will be loaded in the experiment tree on the left of this window, and you will be asked if you wish to start running the experiment.Threshold ToolThe threshold tool creates boolean model projection rasters from probability range rasters using a Minimum Cut-off Threshold Percentage. Using this tool you can:Create a model projection map that shows only cells that were above a specific probabilty of occurrence.Create a 'hotspot' map showing predicted alpha biodiversity based on the number of thresholded probability layers for different taxa predicting presence in each cell.Create a 'consensus' model showing number of thresholded models predicting presence in each cell.To perform a threshold analysis, you can select any number of models from the experiment tree. Only succaessfully completed model projections are shown in the tree. A thumbnail preview of each model is drawn next to each entry in the tree. By sorting the tree by taxon or by algorithm, you can easily select a group of model projections. Selecting one or more taxa from the same algorithm group (sort by algorithm view) will effectively perform a 'hotspot' analysis, where each cell in the output raster represents the number of taxa predicted presence in that cell based on the defined Minimum Cut-off Threshold Percentage. Selecting one or more algorithms for a given taxon (sort by taxon view) will allow you to create a 'consensus model'.In a consensus model, the value of each cell in the output raster indicates the number of algorithms that predict presence for that cell - based on the Minimum Cut-off Threshold Percentage selected. Optionally you can write out each model projection as a boolean layer where 0 indicates absence and 1 indicates presence, based on the Minimum Cut-off Threshold Percentage selected.While the experiment is running you can browse the results of models as they are completed. Click on a taxon node (when sort by taxon is enabled) or an algorithm node (when sort by algorithm is enabled) for a thumbnail overview of completed model projections. Model nodes in the tree are marked with the following symbols according to the model status: