SlideShare uma empresa Scribd logo
1 de 19
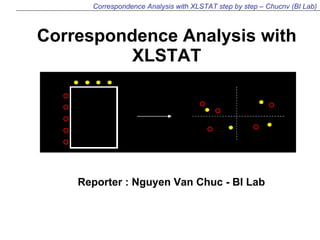
Correspondence Analysis with XLSTAT Reporter : Nguyen Van Chuc - BI Lab
Summarization theory of  Correspondence  Analysis (CA) ,[object Object],[object Object],[object Object],[object Object]
Two stages and three steps of each stage in CA process
Basic concepts
Basic concepts
How to run Correspondence Analysis with XLSTAT Now, we use XLSTAT Tool to describe how to run CA and explain the result base on an example step by step. In order to illustrate the interpretation of output from correspondence analysis, the following example is worked through in detail.
The following contingency table showing the frequency of usage of four brands of toothpaste in three geographic regions among a random sample of 120 users Table 1. Brand by Region Contingency table
Analyzing Data – Correspondence Analysis CA
Table 2. Row and Column profiles
1.Significance of Dependencies The first step in the interpretation of correspondence analysis is to establish whether  there is a significance dependency between rows and columns
2.Dimensionality of the solution The second step in interpretation is to determine the appropriate number of dimension to use to describe the points. This is achieved by examining eigenvalue and percentage of inertia In this example, two dimensions explain 100% of inertia since two dimensions are sufficient to explain the total inertia
2.Dimensionality of the solution In this example two dimensions are sufficient to explain the total inertia
3. Interpreting the axes The axes are interpreted by way of the contribution that each element (in this case each Brand) makes towards the total inertia accounted for by the axis. In this example there are 4 brands, thus, any distribution greater than 100/4 = 25% would represent significance greater than what would be expected  in the case of a purely random distribution of Brands over axes. In this case, brand A meets (satisfies) this criterion and determines the first axis and Brand B determines the second axis
3. Interpreting the axes Likewise, for columns, Region 3 determines the first axis and the second axis is determined by Region 2 and Region 1 (Because of the contributions > 100/3=33.3%) Note that, Brand A determines the first axis(F1) and F1 is determined by Region 3, thus it is obvious to understand that Brand A strongly associated with region 3 (see symmetric plot).
4. Graphical Representation of a contingency table Brands C and D are positioned relatively closely indicates a similarity in their regional usage profiles (60%, 75% respectively) and Brand A is positioned relatively far away from Brands C and D indicates that Brand A has a very different regional usage profile from Brands C and D Categories with similar distributions will be represented as points that are close in space, and categories that have very dissimilar distributions will be positioned far apart If a profile is very  different from the average profile (centroid) , then the  point will lie far from the origin , whereas, profile that are close to the average will be represented  by points close to the centroid. If all the categories have equal profiles then all the points will fall in the centroid.
4. Graphical Representation of a contingency table The proximity of Brand A to the Region 3 indicates that  Brand A is strongly associated with Region 3  which is clearly because profile presented in table 2 with 75 % brand A users reside in region 3. Likewise, the proximity of brand B with region 2 and Brands C and D with region 1 indicate that the higher frequency of usage  of those brands in those regions. The positions of the points in the map tell you something about similarities between the rows, similarities between the columns and the association between rows and columns
4. Graphical Representation of a contingency table In the Asymmetric row plot map, rows are plotted base on principal coordinates and columns are plotted base on standard coordinates.
4. The quality of representation The higher of total of two (or first n dimensions) the higher quality of the representation. In this example, two axes explain 100% of the inertia  (The first dimension explains 61.8% of inertia and the second dimension explains 38.2% of the inertia).
4. The quality of representation The quality of representation is easily calculated from the  correlations  or  squared correlations  given in the output. The squared correlation presented for any column measures the degree of association between that column and a particular axis. So, for instance, the squared correlation between Brand A and the first and second axes is 0.986 and 0.014 respectively. This implies that Brand A are  strongly associated with the first axis (Region 3)   but only weakly associated with the second axis (Region 1 and Region 2).

Mais conteúdo relacionado

Mais procurados

Ordinal logistic regression
Ordinal logistic regression Ordinal logistic regression
Ordinal logistic regression Dr Athar Khan
 
Multiple Linear Regression II and ANOVA I
Multiple Linear Regression II and ANOVA IMultiple Linear Regression II and ANOVA I
Multiple Linear Regression II and ANOVA IJames Neill
 
Principal Component Analysis (PCA) and LDA PPT Slides
Principal Component Analysis (PCA) and LDA PPT SlidesPrincipal Component Analysis (PCA) and LDA PPT Slides
Principal Component Analysis (PCA) and LDA PPT SlidesAbhishekKumar4995
 
Monotone likelihood ratio test
Monotone likelihood ratio testMonotone likelihood ratio test
Monotone likelihood ratio testSohel rana
 
Topological data analysis
Topological data analysisTopological data analysis
Topological data analysisSunghyon Kyeong
 
Topic 15 correlation spss
Topic 15 correlation spssTopic 15 correlation spss
Topic 15 correlation spssSizwan Ahammed
 
Cluster analysis
Cluster analysisCluster analysis
Cluster analysissaba khan
 
Introduction to Principle Component Analysis
Introduction to Principle Component AnalysisIntroduction to Principle Component Analysis
Introduction to Principle Component AnalysisSunjeet Jena
 
The Wishart and inverse-wishart distribution
 The Wishart and inverse-wishart distribution The Wishart and inverse-wishart distribution
The Wishart and inverse-wishart distributionPankaj Das
 
Partial correlation
Partial correlationPartial correlation
Partial correlationDwaitiRoy
 
Cannonical correlation
Cannonical correlationCannonical correlation
Cannonical correlationdomsr
 
Logistic regression
Logistic regressionLogistic regression
Logistic regressionsaba khan
 
Multiple linear regression
Multiple linear regressionMultiple linear regression
Multiple linear regressionJames Neill
 
Logistic regression
Logistic regressionLogistic regression
Logistic regressionDrZahid Khan
 

Mais procurados (20)

07 Whole Network Descriptive Statistics
07 Whole Network Descriptive Statistics07 Whole Network Descriptive Statistics
07 Whole Network Descriptive Statistics
 
Ordinal logistic regression
Ordinal logistic regression Ordinal logistic regression
Ordinal logistic regression
 
Logistic regression
Logistic regressionLogistic regression
Logistic regression
 
Point estimation
Point estimationPoint estimation
Point estimation
 
Multiple Linear Regression II and ANOVA I
Multiple Linear Regression II and ANOVA IMultiple Linear Regression II and ANOVA I
Multiple Linear Regression II and ANOVA I
 
Principal Component Analysis (PCA) and LDA PPT Slides
Principal Component Analysis (PCA) and LDA PPT SlidesPrincipal Component Analysis (PCA) and LDA PPT Slides
Principal Component Analysis (PCA) and LDA PPT Slides
 
Monotone likelihood ratio test
Monotone likelihood ratio testMonotone likelihood ratio test
Monotone likelihood ratio test
 
Factor analysis
Factor analysisFactor analysis
Factor analysis
 
Expectation maximization
Expectation maximizationExpectation maximization
Expectation maximization
 
Topological data analysis
Topological data analysisTopological data analysis
Topological data analysis
 
Topic 15 correlation spss
Topic 15 correlation spssTopic 15 correlation spss
Topic 15 correlation spss
 
Cluster analysis
Cluster analysisCluster analysis
Cluster analysis
 
Introduction to Principle Component Analysis
Introduction to Principle Component AnalysisIntroduction to Principle Component Analysis
Introduction to Principle Component Analysis
 
The Wishart and inverse-wishart distribution
 The Wishart and inverse-wishart distribution The Wishart and inverse-wishart distribution
The Wishart and inverse-wishart distribution
 
Partial correlation
Partial correlationPartial correlation
Partial correlation
 
Cannonical correlation
Cannonical correlationCannonical correlation
Cannonical correlation
 
Logistic regression
Logistic regressionLogistic regression
Logistic regression
 
Multiple linear regression
Multiple linear regressionMultiple linear regression
Multiple linear regression
 
Priya
PriyaPriya
Priya
 
Logistic regression
Logistic regressionLogistic regression
Logistic regression
 

Semelhante a Correspondence analysis(step by step)

Statistik Chapter 2
Statistik Chapter 2Statistik Chapter 2
Statistik Chapter 2WanBK Leo
 
2.4 Scatterplots, correlation, and regression
2.4 Scatterplots, correlation, and regression2.4 Scatterplots, correlation, and regression
2.4 Scatterplots, correlation, and regressionLong Beach City College
 
For Problem 2, you are to evaluate the given analysis and inte.docx
For Problem 2, you are to evaluate the given analysis and inte.docxFor Problem 2, you are to evaluate the given analysis and inte.docx
For Problem 2, you are to evaluate the given analysis and inte.docxAKHIL969626
 
Churn Analysis in Telecom Industry
Churn Analysis in Telecom IndustryChurn Analysis in Telecom Industry
Churn Analysis in Telecom IndustrySatyam Barsaiyan
 
PG STAT 531 Lecture 3 Graphical and Diagrammatic Representation of Data
PG STAT 531 Lecture 3 Graphical and Diagrammatic Representation of DataPG STAT 531 Lecture 3 Graphical and Diagrammatic Representation of Data
PG STAT 531 Lecture 3 Graphical and Diagrammatic Representation of DataAashish Patel
 
how do you interpret a scatter gramSolution Contents Quality.pdf
how do you interpret a scatter gramSolution  Contents  Quality.pdfhow do you interpret a scatter gramSolution  Contents  Quality.pdf
how do you interpret a scatter gramSolution Contents Quality.pdfAMITJWELLER123
 
Fill in the blanks8.1.      The magnitude of the correlation .docx
Fill in the blanks8.1.      The magnitude of the correlation .docxFill in the blanks8.1.      The magnitude of the correlation .docx
Fill in the blanks8.1.      The magnitude of the correlation .docxmglenn3
 
Alg II 2-5 Linear Models
Alg II 2-5 Linear ModelsAlg II 2-5 Linear Models
Alg II 2-5 Linear Modelsjtentinger
 
Quantitative techniques in business
Quantitative techniques in businessQuantitative techniques in business
Quantitative techniques in businesssameer sheikh
 
Chapter Two PPT Lecture - Part One.ppt
Chapter Two PPT Lecture - Part One.pptChapter Two PPT Lecture - Part One.ppt
Chapter Two PPT Lecture - Part One.pptjosh658552
 
Qt graphical representation of data
Qt   graphical representation of dataQt   graphical representation of data
Qt graphical representation of dataJoel Pais
 
Qt graphical representation of data
Qt   graphical representation of dataQt   graphical representation of data
Qt graphical representation of dataJoel Pais
 
Simple lin regress_inference
Simple lin regress_inferenceSimple lin regress_inference
Simple lin regress_inferenceKemal İnciroğlu
 
PRESENTATION OF DATA.pptx
PRESENTATION OF DATA.pptxPRESENTATION OF DATA.pptx
PRESENTATION OF DATA.pptxajesh ps
 

Semelhante a Correspondence analysis(step by step) (20)

Statistik Chapter 2
Statistik Chapter 2Statistik Chapter 2
Statistik Chapter 2
 
2.4 Scatterplots, correlation, and regression
2.4 Scatterplots, correlation, and regression2.4 Scatterplots, correlation, and regression
2.4 Scatterplots, correlation, and regression
 
Statistics
StatisticsStatistics
Statistics
 
Charts in excel
Charts in excelCharts in excel
Charts in excel
 
Relational Algebra-23-04-2023.pdf
Relational Algebra-23-04-2023.pdfRelational Algebra-23-04-2023.pdf
Relational Algebra-23-04-2023.pdf
 
For Problem 2, you are to evaluate the given analysis and inte.docx
For Problem 2, you are to evaluate the given analysis and inte.docxFor Problem 2, you are to evaluate the given analysis and inte.docx
For Problem 2, you are to evaluate the given analysis and inte.docx
 
Churn Analysis in Telecom Industry
Churn Analysis in Telecom IndustryChurn Analysis in Telecom Industry
Churn Analysis in Telecom Industry
 
PG STAT 531 Lecture 3 Graphical and Diagrammatic Representation of Data
PG STAT 531 Lecture 3 Graphical and Diagrammatic Representation of DataPG STAT 531 Lecture 3 Graphical and Diagrammatic Representation of Data
PG STAT 531 Lecture 3 Graphical and Diagrammatic Representation of Data
 
Data Mind Traps
Data Mind TrapsData Mind Traps
Data Mind Traps
 
Graphs in Biostatistics
Graphs in Biostatistics Graphs in Biostatistics
Graphs in Biostatistics
 
how do you interpret a scatter gramSolution Contents Quality.pdf
how do you interpret a scatter gramSolution  Contents  Quality.pdfhow do you interpret a scatter gramSolution  Contents  Quality.pdf
how do you interpret a scatter gramSolution Contents Quality.pdf
 
Fill in the blanks8.1.      The magnitude of the correlation .docx
Fill in the blanks8.1.      The magnitude of the correlation .docxFill in the blanks8.1.      The magnitude of the correlation .docx
Fill in the blanks8.1.      The magnitude of the correlation .docx
 
Alg II 2-5 Linear Models
Alg II 2-5 Linear ModelsAlg II 2-5 Linear Models
Alg II 2-5 Linear Models
 
Quantitative techniques in business
Quantitative techniques in businessQuantitative techniques in business
Quantitative techniques in business
 
Chapter05
Chapter05Chapter05
Chapter05
 
Chapter Two PPT Lecture - Part One.ppt
Chapter Two PPT Lecture - Part One.pptChapter Two PPT Lecture - Part One.ppt
Chapter Two PPT Lecture - Part One.ppt
 
Qt graphical representation of data
Qt   graphical representation of dataQt   graphical representation of data
Qt graphical representation of data
 
Qt graphical representation of data
Qt   graphical representation of dataQt   graphical representation of data
Qt graphical representation of data
 
Simple lin regress_inference
Simple lin regress_inferenceSimple lin regress_inference
Simple lin regress_inference
 
PRESENTATION OF DATA.pptx
PRESENTATION OF DATA.pptxPRESENTATION OF DATA.pptx
PRESENTATION OF DATA.pptx
 

Último

Scanning the Internet for External Cloud Exposures via SSL Certs
Scanning the Internet for External Cloud Exposures via SSL CertsScanning the Internet for External Cloud Exposures via SSL Certs
Scanning the Internet for External Cloud Exposures via SSL CertsRizwan Syed
 
Are Multi-Cloud and Serverless Good or Bad?
Are Multi-Cloud and Serverless Good or Bad?Are Multi-Cloud and Serverless Good or Bad?
Are Multi-Cloud and Serverless Good or Bad?Mattias Andersson
 
"Subclassing and Composition – A Pythonic Tour of Trade-Offs", Hynek Schlawack
"Subclassing and Composition – A Pythonic Tour of Trade-Offs", Hynek Schlawack"Subclassing and Composition – A Pythonic Tour of Trade-Offs", Hynek Schlawack
"Subclassing and Composition – A Pythonic Tour of Trade-Offs", Hynek SchlawackFwdays
 
Tampa BSides - Chef's Tour of Microsoft Security Adoption Framework (SAF)
Tampa BSides - Chef's Tour of Microsoft Security Adoption Framework (SAF)Tampa BSides - Chef's Tour of Microsoft Security Adoption Framework (SAF)
Tampa BSides - Chef's Tour of Microsoft Security Adoption Framework (SAF)Mark Simos
 
DSPy a system for AI to Write Prompts and Do Fine Tuning
DSPy a system for AI to Write Prompts and Do Fine TuningDSPy a system for AI to Write Prompts and Do Fine Tuning
DSPy a system for AI to Write Prompts and Do Fine TuningLars Bell
 
DevEX - reference for building teams, processes, and platforms
DevEX - reference for building teams, processes, and platformsDevEX - reference for building teams, processes, and platforms
DevEX - reference for building teams, processes, and platformsSergiu Bodiu
 
Merck Moving Beyond Passwords: FIDO Paris Seminar.pptx
Merck Moving Beyond Passwords: FIDO Paris Seminar.pptxMerck Moving Beyond Passwords: FIDO Paris Seminar.pptx
Merck Moving Beyond Passwords: FIDO Paris Seminar.pptxLoriGlavin3
 
Powerpoint exploring the locations used in television show Time Clash
Powerpoint exploring the locations used in television show Time ClashPowerpoint exploring the locations used in television show Time Clash
Powerpoint exploring the locations used in television show Time Clashcharlottematthew16
 
TrustArc Webinar - How to Build Consumer Trust Through Data Privacy
TrustArc Webinar - How to Build Consumer Trust Through Data PrivacyTrustArc Webinar - How to Build Consumer Trust Through Data Privacy
TrustArc Webinar - How to Build Consumer Trust Through Data PrivacyTrustArc
 
Artificial intelligence in cctv survelliance.pptx
Artificial intelligence in cctv survelliance.pptxArtificial intelligence in cctv survelliance.pptx
Artificial intelligence in cctv survelliance.pptxhariprasad279825
 
How AI, OpenAI, and ChatGPT impact business and software.
How AI, OpenAI, and ChatGPT impact business and software.How AI, OpenAI, and ChatGPT impact business and software.
How AI, OpenAI, and ChatGPT impact business and software.Curtis Poe
 
Ensuring Technical Readiness For Copilot in Microsoft 365
Ensuring Technical Readiness For Copilot in Microsoft 365Ensuring Technical Readiness For Copilot in Microsoft 365
Ensuring Technical Readiness For Copilot in Microsoft 3652toLead Limited
 
Designing IA for AI - Information Architecture Conference 2024
Designing IA for AI - Information Architecture Conference 2024Designing IA for AI - Information Architecture Conference 2024
Designing IA for AI - Information Architecture Conference 2024Enterprise Knowledge
 
How to write a Business Continuity Plan
How to write a Business Continuity PlanHow to write a Business Continuity Plan
How to write a Business Continuity PlanDatabarracks
 
SAP Build Work Zone - Overview L2-L3.pptx
SAP Build Work Zone - Overview L2-L3.pptxSAP Build Work Zone - Overview L2-L3.pptx
SAP Build Work Zone - Overview L2-L3.pptxNavinnSomaal
 
Dev Dives: Streamline document processing with UiPath Studio Web
Dev Dives: Streamline document processing with UiPath Studio WebDev Dives: Streamline document processing with UiPath Studio Web
Dev Dives: Streamline document processing with UiPath Studio WebUiPathCommunity
 
Vertex AI Gemini Prompt Engineering Tips
Vertex AI Gemini Prompt Engineering TipsVertex AI Gemini Prompt Engineering Tips
Vertex AI Gemini Prompt Engineering TipsMiki Katsuragi
 
Connect Wave/ connectwave Pitch Deck Presentation
Connect Wave/ connectwave Pitch Deck PresentationConnect Wave/ connectwave Pitch Deck Presentation
Connect Wave/ connectwave Pitch Deck PresentationSlibray Presentation
 
TeamStation AI System Report LATAM IT Salaries 2024
TeamStation AI System Report LATAM IT Salaries 2024TeamStation AI System Report LATAM IT Salaries 2024
TeamStation AI System Report LATAM IT Salaries 2024Lonnie McRorey
 

Último (20)

Scanning the Internet for External Cloud Exposures via SSL Certs
Scanning the Internet for External Cloud Exposures via SSL CertsScanning the Internet for External Cloud Exposures via SSL Certs
Scanning the Internet for External Cloud Exposures via SSL Certs
 
Are Multi-Cloud and Serverless Good or Bad?
Are Multi-Cloud and Serverless Good or Bad?Are Multi-Cloud and Serverless Good or Bad?
Are Multi-Cloud and Serverless Good or Bad?
 
"Subclassing and Composition – A Pythonic Tour of Trade-Offs", Hynek Schlawack
"Subclassing and Composition – A Pythonic Tour of Trade-Offs", Hynek Schlawack"Subclassing and Composition – A Pythonic Tour of Trade-Offs", Hynek Schlawack
"Subclassing and Composition – A Pythonic Tour of Trade-Offs", Hynek Schlawack
 
Tampa BSides - Chef's Tour of Microsoft Security Adoption Framework (SAF)
Tampa BSides - Chef's Tour of Microsoft Security Adoption Framework (SAF)Tampa BSides - Chef's Tour of Microsoft Security Adoption Framework (SAF)
Tampa BSides - Chef's Tour of Microsoft Security Adoption Framework (SAF)
 
DSPy a system for AI to Write Prompts and Do Fine Tuning
DSPy a system for AI to Write Prompts and Do Fine TuningDSPy a system for AI to Write Prompts and Do Fine Tuning
DSPy a system for AI to Write Prompts and Do Fine Tuning
 
DevEX - reference for building teams, processes, and platforms
DevEX - reference for building teams, processes, and platformsDevEX - reference for building teams, processes, and platforms
DevEX - reference for building teams, processes, and platforms
 
Merck Moving Beyond Passwords: FIDO Paris Seminar.pptx
Merck Moving Beyond Passwords: FIDO Paris Seminar.pptxMerck Moving Beyond Passwords: FIDO Paris Seminar.pptx
Merck Moving Beyond Passwords: FIDO Paris Seminar.pptx
 
Powerpoint exploring the locations used in television show Time Clash
Powerpoint exploring the locations used in television show Time ClashPowerpoint exploring the locations used in television show Time Clash
Powerpoint exploring the locations used in television show Time Clash
 
TrustArc Webinar - How to Build Consumer Trust Through Data Privacy
TrustArc Webinar - How to Build Consumer Trust Through Data PrivacyTrustArc Webinar - How to Build Consumer Trust Through Data Privacy
TrustArc Webinar - How to Build Consumer Trust Through Data Privacy
 
Artificial intelligence in cctv survelliance.pptx
Artificial intelligence in cctv survelliance.pptxArtificial intelligence in cctv survelliance.pptx
Artificial intelligence in cctv survelliance.pptx
 
How AI, OpenAI, and ChatGPT impact business and software.
How AI, OpenAI, and ChatGPT impact business and software.How AI, OpenAI, and ChatGPT impact business and software.
How AI, OpenAI, and ChatGPT impact business and software.
 
DMCC Future of Trade Web3 - Special Edition
DMCC Future of Trade Web3 - Special EditionDMCC Future of Trade Web3 - Special Edition
DMCC Future of Trade Web3 - Special Edition
 
Ensuring Technical Readiness For Copilot in Microsoft 365
Ensuring Technical Readiness For Copilot in Microsoft 365Ensuring Technical Readiness For Copilot in Microsoft 365
Ensuring Technical Readiness For Copilot in Microsoft 365
 
Designing IA for AI - Information Architecture Conference 2024
Designing IA for AI - Information Architecture Conference 2024Designing IA for AI - Information Architecture Conference 2024
Designing IA for AI - Information Architecture Conference 2024
 
How to write a Business Continuity Plan
How to write a Business Continuity PlanHow to write a Business Continuity Plan
How to write a Business Continuity Plan
 
SAP Build Work Zone - Overview L2-L3.pptx
SAP Build Work Zone - Overview L2-L3.pptxSAP Build Work Zone - Overview L2-L3.pptx
SAP Build Work Zone - Overview L2-L3.pptx
 
Dev Dives: Streamline document processing with UiPath Studio Web
Dev Dives: Streamline document processing with UiPath Studio WebDev Dives: Streamline document processing with UiPath Studio Web
Dev Dives: Streamline document processing with UiPath Studio Web
 
Vertex AI Gemini Prompt Engineering Tips
Vertex AI Gemini Prompt Engineering TipsVertex AI Gemini Prompt Engineering Tips
Vertex AI Gemini Prompt Engineering Tips
 
Connect Wave/ connectwave Pitch Deck Presentation
Connect Wave/ connectwave Pitch Deck PresentationConnect Wave/ connectwave Pitch Deck Presentation
Connect Wave/ connectwave Pitch Deck Presentation
 
TeamStation AI System Report LATAM IT Salaries 2024
TeamStation AI System Report LATAM IT Salaries 2024TeamStation AI System Report LATAM IT Salaries 2024
TeamStation AI System Report LATAM IT Salaries 2024
 

Correspondence analysis(step by step)

  • 1. Correspondence Analysis with XLSTAT Reporter : Nguyen Van Chuc - BI Lab
  • 2.
  • 3. Two stages and three steps of each stage in CA process
  • 6. How to run Correspondence Analysis with XLSTAT Now, we use XLSTAT Tool to describe how to run CA and explain the result base on an example step by step. In order to illustrate the interpretation of output from correspondence analysis, the following example is worked through in detail.
  • 7. The following contingency table showing the frequency of usage of four brands of toothpaste in three geographic regions among a random sample of 120 users Table 1. Brand by Region Contingency table
  • 8. Analyzing Data – Correspondence Analysis CA
  • 9. Table 2. Row and Column profiles
  • 10. 1.Significance of Dependencies The first step in the interpretation of correspondence analysis is to establish whether there is a significance dependency between rows and columns
  • 11. 2.Dimensionality of the solution The second step in interpretation is to determine the appropriate number of dimension to use to describe the points. This is achieved by examining eigenvalue and percentage of inertia In this example, two dimensions explain 100% of inertia since two dimensions are sufficient to explain the total inertia
  • 12. 2.Dimensionality of the solution In this example two dimensions are sufficient to explain the total inertia
  • 13. 3. Interpreting the axes The axes are interpreted by way of the contribution that each element (in this case each Brand) makes towards the total inertia accounted for by the axis. In this example there are 4 brands, thus, any distribution greater than 100/4 = 25% would represent significance greater than what would be expected in the case of a purely random distribution of Brands over axes. In this case, brand A meets (satisfies) this criterion and determines the first axis and Brand B determines the second axis
  • 14. 3. Interpreting the axes Likewise, for columns, Region 3 determines the first axis and the second axis is determined by Region 2 and Region 1 (Because of the contributions > 100/3=33.3%) Note that, Brand A determines the first axis(F1) and F1 is determined by Region 3, thus it is obvious to understand that Brand A strongly associated with region 3 (see symmetric plot).
  • 15. 4. Graphical Representation of a contingency table Brands C and D are positioned relatively closely indicates a similarity in their regional usage profiles (60%, 75% respectively) and Brand A is positioned relatively far away from Brands C and D indicates that Brand A has a very different regional usage profile from Brands C and D Categories with similar distributions will be represented as points that are close in space, and categories that have very dissimilar distributions will be positioned far apart If a profile is very different from the average profile (centroid) , then the point will lie far from the origin , whereas, profile that are close to the average will be represented by points close to the centroid. If all the categories have equal profiles then all the points will fall in the centroid.
  • 16. 4. Graphical Representation of a contingency table The proximity of Brand A to the Region 3 indicates that Brand A is strongly associated with Region 3 which is clearly because profile presented in table 2 with 75 % brand A users reside in region 3. Likewise, the proximity of brand B with region 2 and Brands C and D with region 1 indicate that the higher frequency of usage of those brands in those regions. The positions of the points in the map tell you something about similarities between the rows, similarities between the columns and the association between rows and columns
  • 17. 4. Graphical Representation of a contingency table In the Asymmetric row plot map, rows are plotted base on principal coordinates and columns are plotted base on standard coordinates.
  • 18. 4. The quality of representation The higher of total of two (or first n dimensions) the higher quality of the representation. In this example, two axes explain 100% of the inertia (The first dimension explains 61.8% of inertia and the second dimension explains 38.2% of the inertia).
  • 19. 4. The quality of representation The quality of representation is easily calculated from the correlations or squared correlations given in the output. The squared correlation presented for any column measures the degree of association between that column and a particular axis. So, for instance, the squared correlation between Brand A and the first and second axes is 0.986 and 0.014 respectively. This implies that Brand A are strongly associated with the first axis (Region 3) but only weakly associated with the second axis (Region 1 and Region 2).