SlideShare uma empresa Scribd logo
1 de 19
Baixar para ler offline
SAFETY AND ECONOMIC
BENEFITS OF ROAD DIETS
WITH BIKE LANES
Cynthia Hoyle, FAICP
Transportation Planning Consultant
Safety Benefits of Bike Lanes
 Large body of research and evidence shows that properly
   designed and installed bike lanes reduce crashes1:
  When the city of Corvallis, OR installed 13 miles of bicycle
   lanes in one year, the number of bicycle crashes fell from
   40 in the year prior to the installation to just 16 in the year
   afterwards…2
  The addition of bicycle lanes in Davis, California reduced
   crashes by 31 percent.3
  A comparison of crash rates of all types in major cities has
   shown that cities with higher bicycle use have lower traffic
   crash rates of all types than cities with lower bicycle use. 4
1. Federal Highway Administration, Safety Effectiveness of Highway Design Features, Volume VI, Pedestrians and Bicyclists, FHWA-RD-91-049,
   1991.
2. Federal Highway Administration, Bicycle Safety-Related Research Synthesis, 1995.
3. Ibid.
4. Federal Highway Administration, Bicycle Lanes versus Wide Curb Lanes: Operational and Safety Findings, May 1998.
Bike Lanes Improve                                                   Behavior1


     Cambridge, MA - sidewalk bicycling cut in half after the installation
      of bicycle lanes on Mass. Ave. in Central Square.2
     Wrong-way riding was significantly lower on the streets with bike
      lanes.3
     On streets with bike lanes, 81% of cyclists obeyed stop signs, vs.
      55% on streets without.4
     Corvallis and Eugene, Oregon, cities with good bikeway networks,
      have the highest number of riders and rider behavior is the best:
      wrong-way riding is minimal, fewer ride on the sidewalk than in
      other Oregon cities.5
1.   Federal Highway Administration, Bicycle Lanes versus Wide Curb Lanes: Operational and Safety Findings, May 1998.
2.   City of Cambridge data, unpublished.
3.   Federal Highway Administration, Bicycle Lanes versus Wide Curb Lanes: Operational and Safety Findings, May 1998.
4.   Ibid.
5.   Ibid.
Elgin, IL
Elgin Bicycle and Pedestrian Safety Campaign
2009
Bikeway Master Plan Adopted 2008
Elgin Bikeway Master Plan

   Created bicycle
    network throughout
    community
   Bike routes/lanes and
    sharrows installed
   Connection to regional
    bike trail in downtown
   Multi-use trails
2009 Elgin Bicycle and Pedestrian
Safety Campaign
                      Elgin Bicycling
                       Ambassadors Program
                      Community education
                       campaign
                      Elgin by Bike – Bike
                       and Dine events
                 “From my point of view I thought it
                 went well. About two-thirds of the
                 riders had not been in our shop, so
                 that was great to see new potential
                 customers.” -Ravenheart Coffee
Gleason Street, Portland
Portland Bicycle Program
       Since 1996 Portland has
        doubled the miles of bike
        lanes
       Added thousands of bike
        parking spaces
       Had a 4-fold increase in
        bicycling
       Dramatic decrease in
        bicycle crashes and
        fatalities (79% of bicycle
        fatalities occurred outside
        of a bike lane.1)
1. Portland Master Bicycle Plan – Existing Conditions Report, Chapter 6: Bicycle
Safety, pg. 6-19.
Portland Bicycle Infrastructure
Improved Bicycle Safety
“Portland’s decline in traffic fatalities is a public
  health triumph. Portland demonstrates that a
  transportation system emphasizing walking,
  bicycling and transit can achieve many public health
  goals - physical activity, clean air, and safety.
  Congratulations to the leaders and people of
  Portland.”
Dr. Howard Frumkin, Centers for Disease Control
  (CDC)
Gleason Street, Portland
Oregon
   Neighborhood retail
    area
   Bike lanes installed
   Bike Corral installed at
    merchant/property
    owner request
   Merchants had more
    customers when
    vehicular parking was
    replaced by bicycle
    parking (12 bikes per 1
    car space)
Valencia Street, San Francisco
Economic Effects of Traffic Calming on Small Urban
Businesses
Emily Drennen
2003
Valencia Street, San Francisco
               California

Before
  -62.5 ft wide
street with
metered parking
on street on both          21’              10’3’’          10’3’’              21’
sides, four lanes
with an average
ADT of 22,000
VPD
                    Designing Streets for Pedestrian Safety-Reducing Crossing Crashes
Valencia Street, San Francisco
                California

After
-Two lanes were
removed, bicycle
lanes installed and
medians were used
for left turns.
                        8’ 5’9’’      10’6’’          14’          10’6’’     5’9’’ 8’
-Changes were
made to signal
                      Designing Streets for Pedestrian Safety – Reducing Crossing Crashes
timing.
Merchant Response to Bike Lanes

27 merchants interviewed 4 ½ years after installation
  of bike lanes found:
 62% believed bike lanes had overall positive

  impact on business
 37% said bike lanes increased their sales

 73% said bike lanes made street more attractive

 2/3 said they would support more traffic calming
  on street
Bloor Street, Toronto
Bike Lanes, On-Street Parking, and Business
A Study of Bloor Street in Toronto’s Annex
Neighborhood
February, 2009
Spending Analyzed by Mode

Walkers
and
bicyclists
spent the
most
money
shopping
in the
area.
Study Conclusions

   The addition of bike lanes would be unlikely to
    harm local business and predicted that commercial
    activity on the street would likely increase.
   Three-quarters of merchants surveyed on the street
    believed that business activity would improve or
    stay the same if a bike lane replaced half of the
    on-street parking.
Thank You!
             Cynthia Hoyle, FAICP
             Hoyle Consulting
             Urbana, IL 61801
             www.cynthiahoyle.com
             choyle57@comcast.net

Mais conteúdo relacionado

Mais procurados

Backgrounder_Bikeway-Options_Final_revised
Backgrounder_Bikeway-Options_Final_revisedBackgrounder_Bikeway-Options_Final_revised
Backgrounder_Bikeway-Options_Final_revised
Neluka Leanage
 
Walking in College Station – Development Standards and Safety
Walking in College Station – Development Standards and SafetyWalking in College Station – Development Standards and Safety
Walking in College Station – Development Standards and Safety
City of College Station
 
Effland.presentation
Effland.presentationEffland.presentation
Effland.presentation
Trailnet
 

Mais procurados (13)

Backgrounder_Bikeway-Options_Final_revised
Backgrounder_Bikeway-Options_Final_revisedBackgrounder_Bikeway-Options_Final_revised
Backgrounder_Bikeway-Options_Final_revised
 
WALKABILITY ASSESSMENT OF DELHI
WALKABILITY ASSESSMENT OF DELHIWALKABILITY ASSESSMENT OF DELHI
WALKABILITY ASSESSMENT OF DELHI
 
Livable Burbank
Livable BurbankLivable Burbank
Livable Burbank
 
Pedestrian safety, India
Pedestrian safety, IndiaPedestrian safety, India
Pedestrian safety, India
 
Walking in College Station – Development Standards and Safety
Walking in College Station – Development Standards and SafetyWalking in College Station – Development Standards and Safety
Walking in College Station – Development Standards and Safety
 
Cities Safer by Design: Real-world guide on designing safer streets and commu...
Cities Safer by Design: Real-world guide on designing safer streets and commu...Cities Safer by Design: Real-world guide on designing safer streets and commu...
Cities Safer by Design: Real-world guide on designing safer streets and commu...
 
Pune Pedestrians Day - December 11 2021
Pune Pedestrians Day - December 11 2021Pune Pedestrians Day - December 11 2021
Pune Pedestrians Day - December 11 2021
 
Bike Plan Presentation Master
Bike Plan Presentation   MasterBike Plan Presentation   Master
Bike Plan Presentation Master
 
Walkability R Bloodworth
Walkability R BloodworthWalkability R Bloodworth
Walkability R Bloodworth
 
Road sharing in Metro manila EDSA
Road sharing in Metro manila  EDSARoad sharing in Metro manila  EDSA
Road sharing in Metro manila EDSA
 
Effland.presentation
Effland.presentationEffland.presentation
Effland.presentation
 
Pedestrian and Bicycle facility planning for kochi city region, part 2 data ...
Pedestrian and Bicycle facility planning for kochi city region, part 2  data ...Pedestrian and Bicycle facility planning for kochi city region, part 2  data ...
Pedestrian and Bicycle facility planning for kochi city region, part 2 data ...
 
Trans Wars - A New Hope
Trans Wars - A New HopeTrans Wars - A New Hope
Trans Wars - A New Hope
 

Semelhante a Safety and economic benefits of road diets 5 10

Ward 30 bike reportv3
Ward 30 bike reportv3Ward 30 bike reportv3
Ward 30 bike reportv3
bikingtoronto
 
Pacers Bike Share Final Project in SPEA
Pacers Bike Share Final Project in SPEAPacers Bike Share Final Project in SPEA
Pacers Bike Share Final Project in SPEA
Anthony Watts
 
Creating Livable Communities Through Road Diets
Creating Livable Communities Through Road DietsCreating Livable Communities Through Road Diets
Creating Livable Communities Through Road Diets
Cynthia Hoyle
 

Semelhante a Safety and economic benefits of road diets 5 10 (20)

Bike Count Report
Bike Count ReportBike Count Report
Bike Count Report
 
Ward 30 bike reportv3
Ward 30 bike reportv3Ward 30 bike reportv3
Ward 30 bike reportv3
 
BicycleTourism
BicycleTourismBicycleTourism
BicycleTourism
 
Complete Freeways: Evaluation of Florida's Bicycles on Limited Access Facilit...
Complete Freeways: Evaluation of Florida's Bicycles on Limited Access Facilit...Complete Freeways: Evaluation of Florida's Bicycles on Limited Access Facilit...
Complete Freeways: Evaluation of Florida's Bicycles on Limited Access Facilit...
 
Bike DFW
Bike DFWBike DFW
Bike DFW
 
The Minneapolis Bicycle Story David Peterson
The Minneapolis Bicycle Story David PetersonThe Minneapolis Bicycle Story David Peterson
The Minneapolis Bicycle Story David Peterson
 
Bike East Bay
Bike East BayBike East Bay
Bike East Bay
 
CSI Student Design Competition 2012
CSI Student Design Competition 2012CSI Student Design Competition 2012
CSI Student Design Competition 2012
 
LSCOG Bike and Pedestrian Regional Plan Executive Summary
LSCOG Bike and Pedestrian Regional Plan Executive SummaryLSCOG Bike and Pedestrian Regional Plan Executive Summary
LSCOG Bike and Pedestrian Regional Plan Executive Summary
 
Pacers Bike Share Final Project in SPEA
Pacers Bike Share Final Project in SPEAPacers Bike Share Final Project in SPEA
Pacers Bike Share Final Project in SPEA
 
Fairfax County Bicycle Master Plan
Fairfax County Bicycle Master PlanFairfax County Bicycle Master Plan
Fairfax County Bicycle Master Plan
 
Road Diet: Improving Safety, Livability, and Economic Development
Road Diet: Improving Safety, Livability, and Economic DevelopmentRoad Diet: Improving Safety, Livability, and Economic Development
Road Diet: Improving Safety, Livability, and Economic Development
 
Creating Livable Communities Through Road Diets
Creating Livable Communities Through Road DietsCreating Livable Communities Through Road Diets
Creating Livable Communities Through Road Diets
 
Congestion Paper M R A A
Congestion Paper  M R A ACongestion Paper  M R A A
Congestion Paper M R A A
 
Coast Bike Share Sponsorship Opportunities
Coast Bike Share Sponsorship OpportunitiesCoast Bike Share Sponsorship Opportunities
Coast Bike Share Sponsorship Opportunities
 
Pwpb chattanooga
Pwpb chattanoogaPwpb chattanooga
Pwpb chattanooga
 
Bicycle Safety
Bicycle SafetyBicycle Safety
Bicycle Safety
 
Bike Plan Presentation Master
Bike Plan Presentation   MasterBike Plan Presentation   Master
Bike Plan Presentation Master
 
First last mile
First last mile First last mile
First last mile
 
2017 VDOT Repaving and Restriping Reston: Bicycle, Pedestrian and Traffic Saf...
2017 VDOT Repaving and Restriping Reston: Bicycle, Pedestrian and Traffic Saf...2017 VDOT Repaving and Restriping Reston: Bicycle, Pedestrian and Traffic Saf...
2017 VDOT Repaving and Restriping Reston: Bicycle, Pedestrian and Traffic Saf...
 

Mais de Cynthia Hoyle

Public Transit: Not Just Trains
Public Transit:  Not Just TrainsPublic Transit:  Not Just Trains
Public Transit: Not Just Trains
Cynthia Hoyle
 
Mobility In The 21st Century ITE Conference 2010final
Mobility In The 21st Century ITE Conference 2010finalMobility In The 21st Century ITE Conference 2010final
Mobility In The 21st Century ITE Conference 2010final
Cynthia Hoyle
 
Growing An Active Transportation System
Growing An Active Transportation SystemGrowing An Active Transportation System
Growing An Active Transportation System
Cynthia Hoyle
 

Mais de Cynthia Hoyle (9)

A Tale of Two Streets - Indiana Walk-Bike Summit.pptx
A Tale of Two Streets - Indiana Walk-Bike Summit.pptxA Tale of Two Streets - Indiana Walk-Bike Summit.pptx
A Tale of Two Streets - Indiana Walk-Bike Summit.pptx
 
IDOT Pedestrian Safety Peer Exchange.pptx
IDOT Pedestrian Safety Peer Exchange.pptxIDOT Pedestrian Safety Peer Exchange.pptx
IDOT Pedestrian Safety Peer Exchange.pptx
 
Starting a Youth Education Program - IL Bike Summit 2016
Starting a Youth Education Program - IL Bike Summit 2016Starting a Youth Education Program - IL Bike Summit 2016
Starting a Youth Education Program - IL Bike Summit 2016
 
Resilient Transportation Systems OKAPA October 2014
Resilient Transportation Systems OKAPA October 2014Resilient Transportation Systems OKAPA October 2014
Resilient Transportation Systems OKAPA October 2014
 
Micro Urbana Communities- Creating and Implementing Livable Transportatino So...
Micro Urbana Communities- Creating and Implementing Livable Transportatino So...Micro Urbana Communities- Creating and Implementing Livable Transportatino So...
Micro Urbana Communities- Creating and Implementing Livable Transportatino So...
 
Transit and Pedestrian Safety - 2014 Public Transportation & Universities Con...
Transit and Pedestrian Safety - 2014 Public Transportation & Universities Con...Transit and Pedestrian Safety - 2014 Public Transportation & Universities Con...
Transit and Pedestrian Safety - 2014 Public Transportation & Universities Con...
 
Public Transit: Not Just Trains
Public Transit:  Not Just TrainsPublic Transit:  Not Just Trains
Public Transit: Not Just Trains
 
Mobility In The 21st Century ITE Conference 2010final
Mobility In The 21st Century ITE Conference 2010finalMobility In The 21st Century ITE Conference 2010final
Mobility In The 21st Century ITE Conference 2010final
 
Growing An Active Transportation System
Growing An Active Transportation SystemGrowing An Active Transportation System
Growing An Active Transportation System
 

Safety and economic benefits of road diets 5 10

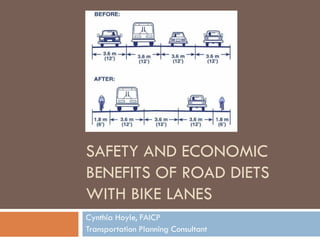
  • 1. SAFETY AND ECONOMIC BENEFITS OF ROAD DIETS WITH BIKE LANES Cynthia Hoyle, FAICP Transportation Planning Consultant
  • 2. Safety Benefits of Bike Lanes Large body of research and evidence shows that properly designed and installed bike lanes reduce crashes1:  When the city of Corvallis, OR installed 13 miles of bicycle lanes in one year, the number of bicycle crashes fell from 40 in the year prior to the installation to just 16 in the year afterwards…2  The addition of bicycle lanes in Davis, California reduced crashes by 31 percent.3  A comparison of crash rates of all types in major cities has shown that cities with higher bicycle use have lower traffic crash rates of all types than cities with lower bicycle use. 4 1. Federal Highway Administration, Safety Effectiveness of Highway Design Features, Volume VI, Pedestrians and Bicyclists, FHWA-RD-91-049, 1991. 2. Federal Highway Administration, Bicycle Safety-Related Research Synthesis, 1995. 3. Ibid. 4. Federal Highway Administration, Bicycle Lanes versus Wide Curb Lanes: Operational and Safety Findings, May 1998.
  • 3. Bike Lanes Improve Behavior1  Cambridge, MA - sidewalk bicycling cut in half after the installation of bicycle lanes on Mass. Ave. in Central Square.2  Wrong-way riding was significantly lower on the streets with bike lanes.3  On streets with bike lanes, 81% of cyclists obeyed stop signs, vs. 55% on streets without.4  Corvallis and Eugene, Oregon, cities with good bikeway networks, have the highest number of riders and rider behavior is the best: wrong-way riding is minimal, fewer ride on the sidewalk than in other Oregon cities.5 1. Federal Highway Administration, Bicycle Lanes versus Wide Curb Lanes: Operational and Safety Findings, May 1998. 2. City of Cambridge data, unpublished. 3. Federal Highway Administration, Bicycle Lanes versus Wide Curb Lanes: Operational and Safety Findings, May 1998. 4. Ibid. 5. Ibid.
  • 4. Elgin, IL Elgin Bicycle and Pedestrian Safety Campaign 2009 Bikeway Master Plan Adopted 2008
  • 5. Elgin Bikeway Master Plan  Created bicycle network throughout community  Bike routes/lanes and sharrows installed  Connection to regional bike trail in downtown  Multi-use trails
  • 6. 2009 Elgin Bicycle and Pedestrian Safety Campaign  Elgin Bicycling Ambassadors Program  Community education campaign  Elgin by Bike – Bike and Dine events “From my point of view I thought it went well. About two-thirds of the riders had not been in our shop, so that was great to see new potential customers.” -Ravenheart Coffee
  • 8. Portland Bicycle Program  Since 1996 Portland has doubled the miles of bike lanes  Added thousands of bike parking spaces  Had a 4-fold increase in bicycling  Dramatic decrease in bicycle crashes and fatalities (79% of bicycle fatalities occurred outside of a bike lane.1) 1. Portland Master Bicycle Plan – Existing Conditions Report, Chapter 6: Bicycle Safety, pg. 6-19.
  • 9.
  • 10. Portland Bicycle Infrastructure Improved Bicycle Safety “Portland’s decline in traffic fatalities is a public health triumph. Portland demonstrates that a transportation system emphasizing walking, bicycling and transit can achieve many public health goals - physical activity, clean air, and safety. Congratulations to the leaders and people of Portland.” Dr. Howard Frumkin, Centers for Disease Control (CDC)
  • 11. Gleason Street, Portland Oregon  Neighborhood retail area  Bike lanes installed  Bike Corral installed at merchant/property owner request  Merchants had more customers when vehicular parking was replaced by bicycle parking (12 bikes per 1 car space)
  • 12. Valencia Street, San Francisco Economic Effects of Traffic Calming on Small Urban Businesses Emily Drennen 2003
  • 13. Valencia Street, San Francisco California Before -62.5 ft wide street with metered parking on street on both 21’ 10’3’’ 10’3’’ 21’ sides, four lanes with an average ADT of 22,000 VPD Designing Streets for Pedestrian Safety-Reducing Crossing Crashes
  • 14. Valencia Street, San Francisco California After -Two lanes were removed, bicycle lanes installed and medians were used for left turns. 8’ 5’9’’ 10’6’’ 14’ 10’6’’ 5’9’’ 8’ -Changes were made to signal Designing Streets for Pedestrian Safety – Reducing Crossing Crashes timing.
  • 15. Merchant Response to Bike Lanes 27 merchants interviewed 4 ½ years after installation of bike lanes found:  62% believed bike lanes had overall positive impact on business  37% said bike lanes increased their sales  73% said bike lanes made street more attractive  2/3 said they would support more traffic calming on street
  • 16. Bloor Street, Toronto Bike Lanes, On-Street Parking, and Business A Study of Bloor Street in Toronto’s Annex Neighborhood February, 2009
  • 17. Spending Analyzed by Mode Walkers and bicyclists spent the most money shopping in the area.
  • 18. Study Conclusions  The addition of bike lanes would be unlikely to harm local business and predicted that commercial activity on the street would likely increase.  Three-quarters of merchants surveyed on the street believed that business activity would improve or stay the same if a bike lane replaced half of the on-street parking.
  • 19. Thank You! Cynthia Hoyle, FAICP Hoyle Consulting Urbana, IL 61801 www.cynthiahoyle.com choyle57@comcast.net