More Related Content
Similar to H W 2010 07 At (20)
H W 2010 07 At
- 1. The Chicagoland Monthly Housing Market Pulse
Attached Properties - July 1, 2010 Report
The monthly analysis of inventory levels by price range
Sponsored by:
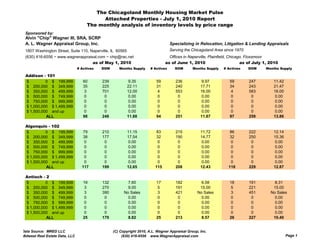
Alvin "Chip" Wagner III, SRA, SCRP
A. L. Wagner Appraisal Group, Inc. Specializing in Relocation, Litigation & Lending Appraisals
1807 Washington Street, Suite 110, Naperville, IL 60565 Serving the Chicagoland Area since 1970
(630) 416-6556 ~ www.wagnerappraisal.com ~ chip@rac.net Offices in Naperville, Plainfield, Chicago, Flossmoor
as of May 1, 2010 as of June 1, 2010 as of July 1, 2010
# Actives DOM Months Supply # Actives DOM Months Supply # Actives DOM Months Supply
Addison - 101
$ 0 $ 199,999 60 239 9.35 59 236 9.97 59 247 11.42
$ 200,000 $ 349,999 35 225 22.11 31 240 17.71 34 243 21.47
$ 350,000 $ 499,999 3 701 12.00 4 553 16.00 4 583 16.00
$ 500,000 $ 749,999 0 0 0.00 0 0 0.00 0 0 0.00
$ 750,000 $ 999,999 0 0 0.00 0 0 0.00 0 0 0.00
$ 1,000,000 $ 1,499,999 0 0 0.00 0 0 0.00 0 0 0.00
$ 1,500,000 and up 0 0 0.00 0 0 0.00 0 0 0.00
ALL 98 248 11.88 94 251 11.87 97 259 13.86
Algonquin - 102
$ 0 $ 199,999 79 210 11.15 83 215 11.72 86 222 12.14
$ 200,000 $ 349,999 38 177 17.54 32 190 14.77 32 250 15.36
$ 350,000 $ 499,999 0 0 0.00 0 0 0.00 0 0 0.00
$ 500,000 $ 749,999 0 0 0.00 0 0 0.00 0 0 0.00
$ 750,000 $ 999,999 0 0 0.00 0 0 0.00 0 0 0.00
$ 1,000,000 $ 1,499,999 0 0 0.00 0 0 0.00 0 0 0.00
$ 1,500,000 and up 0 0 0.00 0 0 0.00 0 0 0.00
ALL 117 199 12.65 115 208 12.43 118 229 12.87
Antioch - 2
$ 0 $ 199,999 19 132 7.60 17 182 6.58 18 191 8.31
$ 200,000 $ 349,999 3 270 9.00 5 191 15.00 5 221 15.00
$ 350,000 $ 499,999 3 390 No Sales 3 421 No Sales 3 451 No Sales
$ 500,000 $ 749,999 0 0 0.00 0 0 0.00 0 0 0.00
$ 750,000 $ 999,999 0 0 0.00 0 0 0.00 0 0 0.00
$ 1,000,000 $ 1,499,999 0 0 0.00 0 0 0.00 0 0 0.00
$ 1,500,000 and up 0 0 0.00 0 0 0.00 0 0 0.00
ALL 25 179 8.82 25 213 8.57 26 227 10.40
Data Source: MRED LLC (C) Copyright 2010, A.L. Wagner Appraisal Group, Inc.
Midwest Real Estate Data, LLC (630) 416-6556 www.WagnerAppraisal.com Page 1
- 2. as of May 1, 2010 as of June 1, 2010 as of July 1, 2010
# Actives DOM Months Supply # Actives DOM Months Supply # Actives DOM Months Supply
Arlington Heights - 5
$ 0 $ 199,999 267 233 11.82 280 236 12.49 271 242 12.32
$ 200,000 $ 349,999 109 224 10.90 99 228 10.15 100 234 10.81
$ 350,000 $ 499,999 17 265 20.40 18 306 30.86 19 272 38.00
$ 500,000 $ 749,999 7 320 42.00 6 397 36.00 5 435 30.00
$ 750,000 $ 999,999 2 111 No Sales 2 142 No Sales 2 172 No Sales
$ 1,000,000 $ 1,499,999 1 97 No Sales 1 128 No Sales 1 158 No Sales
$ 1,500,000 and up 0 0 0.00 0 0 0.00 0 0 0.00
ALL 403 232 12.00 406 239 12.33 398 244 12.47
Aurora - 507
$ 0 $ 199,999 426 181 9.03 433 186 9.31 450 184 10.53
$ 200,000 $ 349,999 75 284 10.23 78 264 11.01 68 275 9.60
$ 350,000 $ 499,999 11 336 66.00 10 350 60.00 8 265 48.00
$ 500,000 $ 749,999 3 622 36.00 3 452 36.00 3 482 36.00
$ 750,000 $ 999,999 0 0 0.00 0 0 0.00 0 0 0.00
$ 1,000,000 $ 1,499,999 0 0 0.00 0 0 0.00 0 0 0.00
$ 1,500,000 and up 0 0 0.00 0 0 0.00 0 0 0.00
ALL 515 202 9.41 524 203 9.73 529 199 10.56
Barrington A
B i t Area - 10
$ 0 $ 199,999 31 177 9.30 30 198 8.57 31 207 7.75
$ 200,000 $ 349,999 53 209 19.27 63 192 21.60 63 187 21.00
$ 350,000 $ 499,999 19 134 9.50 18 140 9.82 21 143 12.60
$ 500,000 $ 749,999 3 467 36.00 5 382 60.00 5 412 60.00
$ 750,000 $ 999,999 1 375 No Sales 0 0 0.00 0 0 0.00
$ 1,000,000 $ 1,499,999 0 0 0.00 0 0 0.00 0 0 0.00
$ 1,500,000 and up 0 0 0.00 0 0 0.00 0 0 0.00
ALL 107 195 13.10 116 194 13.92 120 194 13.71
Bartlett - 104
$ 0 $ 199,999 82 191 10.47 88 205 11.60 94 198 13.43
$ 200,000 $ 349,999 87 175 23.73 80 193 21.82 73 196 19.47
$ 350,000 $ 499,999 1 107 12.00 1 138 12.00 2 86 24.00
$ 500,000 $ 749,999 0 0 0.00 0 0 0.00 0 0 0.00
$ 750,000 $ 999,999 0 0 0.00 0 0 0.00 0 0 0.00
$ 1,000,000 $ 1,499,999 0 0 0.00 0 0 0.00 0 0 0.00
$ 1,500,000 and up 0 0 0.00 0 0 0.00 0 0 0.00
ALL 170 183 14.68 169 199 14.91 169 196 15.60
Data Source: MRED LLC (C) Copyright 2010, A.L. Wagner Appraisal Group, Inc.
Midwest Real Estate Data, LLC (630) 416-6556 www.WagnerAppraisal.com Page 2
- 3. as of May 1, 2010 as of June 1, 2010 as of July 1, 2010
# Actives DOM Months Supply # Actives DOM Months Supply # Actives DOM Months Supply
Batavia - 510
$ 0 $ 199,999 24 204 8.73 25 233 8.33 22 222 8.25
$ 200,000 $ 349,999 18 261 10.80 16 230 9.60 18 200 12.71
$ 350,000 $ 499,999 9 605 108.00 9 636 108.00 8 730 96.00
$ 500,000 $ 749,999 1 451 No Sales 1 482 No Sales 1 512 No Sales
$ 750,000 $ 999,999 0 0 0.00 0 0 0.00 0 0 0.00
$ 1,000,000 $ 1,499,999 0 0 0.00 0 0 0.00 0 0 0.00
$ 1,500,000 and up 0 0 0.00 0 0 0.00 0 0 0.00
ALL 52 298 11.56 51 308 10.74 49 303 11.76
Bensenville - 106
$ 0 $ 199,999 35 276 21.00 34 268 19.43 36 331 22.74
$ 200,000 $ 349,999 1 80 4.00 3 47 9.00 3 77 12.00
$ 350,000 $ 499,999 0 0 0.00 0 0 0.00 0 0 0.00
$ 500,000 $ 749,999 0 0 0.00 0 0 0.00 0 0 0.00
$ 750,000 $ 999,999 0 0 0.00 0 0 0.00 0 0 0.00
$ 1,000,000 $ 1,499,999 0 0 0.00 0 0 0.00 0 0 0.00
$ 1,500,000 and up 0 0 0.00 0 0 0.00 0 0 0.00
ALL 36 271 18.78 37 250 17.76 39 311 21.27
Berwyn - 402
B
$ 0 $ 199,999 54 230 12.71 62 220 17.30 64 235 19.20
$ 200,000 $ 349,999 9 163 4.15 9 194 27.00 9 224 27.00
$ 350,000 $ 499,999 0 0 0.00 0 0 0.00 0 0 0.00
$ 500,000 $ 749,999 0 0 0.00 0 0 0.00 0 0 0.00
$ 750,000 $ 999,999 0 0 0.00 0 0 0.00 0 0 0.00
$ 1,000,000 $ 1,499,999 0 0 0.00 0 0 0.00 0 0 0.00
$ 1,500,000 and up 0 0 0.00 0 0 0.00 0 0 0.00
ALL 63 220 9.82 71 217 18.13 73 234 19.91
Bloomingdale - 108
$ 0 $ 199,999 83 217 10.48 93 183 11.51 98 211 12.92
$ 200,000 $ 349,999 54 235 15.43 54 235 16.62 56 218 17.23
$ 350,000 $ 499,999 16 283 27.43 16 266 32.00 15 253 36.00
$ 500,000 $ 749,999 0 0 0.00 1 19 No Sales 1 49 No Sales
$ 750,000 $ 999,999 0 0 0.00 0 0 0.00 0 0 0.00
$ 1,000,000 $ 1,499,999 0 0 0.00 0 0 0.00 0 0 0.00
$ 1,500,000 and up 0 0 0.00 0 0 0.00 0 0 0.00
ALL 153 230 12.75 164 207 13.86 170 216 15.11
Data Source: MRED LLC (C) Copyright 2010, A.L. Wagner Appraisal Group, Inc.
Midwest Real Estate Data, LLC (630) 416-6556 www.WagnerAppraisal.com Page 3
- 4. as of May 1, 2010 as of June 1, 2010 as of July 1, 2010
# Actives DOM Months Supply # Actives DOM Months Supply # Actives DOM Months Supply
Bolingbrook - 440
$ 0 $ 199,999 116 191 6.41 113 190 6.19 121 178 6.66
$ 200,000 $ 349,999 21 241 22.91 17 217 18.55 17 185 18.55
$ 350,000 $ 499,999 0 0 0.00 0 0 0.00 0 0 0.00
$ 500,000 $ 749,999 0 0 0.00 0 0 0.00 0 0 0.00
$ 750,000 $ 999,999 0 0 0.00 0 0 0.00 0 0 0.00
$ 1,000,000 $ 1,499,999 0 0 0.00 0 0 0.00 0 0 0.00
$ 1,500,000 and up 0 0 0.00 0 0 0.00 0 0 0.00
ALL 137 199 7.21 130 193 6.78 138 179 7.23
Brookfield - 513
$ 0 $ 199,999 18 153 16.62 17 179 15.69 18 186 15.43
$ 200,000 $ 349,999 13 131 11.14 16 120 10.11 16 146 9.14
$ 350,000 $ 499,999 0 0 0.00 0 0 0.00 0 0 0.00
$ 500,000 $ 749,999 0 0 0.00 0 0 0.00 0 0 0.00
$ 750,000 $ 999,999 0 0 0.00 0 0 0.00 0 0 0.00
$ 1,000,000 $ 1,499,999 0 0 0.00 0 0 0.00 0 0 0.00
$ 1,500,000 and up 0 0 0.00 0 0 0.00 0 0 0.00
ALL 31 144 13.29 33 151 12.00 34 167 11.33
Buffalo G
B ff l Grove - 89
$ 0 $ 199,999 169 228 10.40 175 222 10.71 178 223 10.47
$ 200,000 $ 349,999 92 176 11.27 106 158 14.45 105 162 14.65
$ 350,000 $ 499,999 14 172 12.92 8 177 8.00 13 119 19.50
$ 500,000 $ 749,999 1 73 No Sales 1 104 No Sales 0 0 0.00
$ 750,000 $ 999,999 0 0 0.00 0 0 0.00 0 0 0.00
$ 1,000,000 $ 1,499,999 0 0 0.00 0 0 0.00 0 0 0.00
$ 1,500,000 and up 0 0 0.00 0 0 0.00 0 0 0.00
ALL 276 208 10.82 290 197 11.76 296 197 11.92
Burr Ridge - 522
$ 0 $ 199,999 5 510 7.50 8 436 12.00 8 369 10.67
$ 200,000 $ 349,999 10 162 5.71 14 143 8.40 16 143 10.11
$ 350,000 $ 499,999 10 211 15.00 11 216 14.67 12 221 14.40
$ 500,000 $ 749,999 14 346 24.00 12 347 16.00 11 314 16.50
$ 750,000 $ 999,999 1 285 No Sales 1 316 No Sales 0 0 0.00
$ 1,000,000 $ 1,499,999 1 272 No Sales 1 303 No Sales 0 0 0.00
$ 1,500,000 and up 0 0 0.00 0 0 0.00 0 0 0.00
ALL 41 285 11.18 47 269 12.26 47 241 12.26
Data Source: MRED LLC (C) Copyright 2010, A.L. Wagner Appraisal Group, Inc.
Midwest Real Estate Data, LLC (630) 416-6556 www.WagnerAppraisal.com Page 4
- 5. as of May 1, 2010 as of June 1, 2010 as of July 1, 2010
# Actives DOM Months Supply # Actives DOM Months Supply # Actives DOM Months Supply
Carol Stream - 188
$ 0 $ 199,999 103 204 8.35 106 200 9.02 112 208 9.74
$ 200,000 $ 349,999 37 185 16.44 42 163 21.00 40 182 26.67
$ 350,000 $ 499,999 3 412 No Sales 3 443 No Sales 2 114 No Sales
$ 500,000 $ 749,999 0 0 0.00 0 0 0.00 0 0 0.00
$ 750,000 $ 999,999 0 0 0.00 0 0 0.00 0 0 0.00
$ 1,000,000 $ 1,499,999 0 0 0.00 0 0 0.00 0 0 0.00
$ 1,500,000 and up 0 0 0.00 0 0 0.00 0 0 0.00
ALL 143 204 9.81 151 195 10.98 154 200 11.85
Carpentersville, Lake Marion - 110
$ 0 $ 199,999 95 196 9.19 90 212 8.64 96 194 9.29
$ 200,000 $ 349,999 0 0 0.00 0 0 0.00 0 0 0.00
$ 350,000 $ 499,999 0 0 0.00 0 0 0.00 0 0 0.00
$ 500,000 $ 749,999 0 0 0.00 0 0 0.00 0 0 0.00
$ 750,000 $ 999,999 0 0 0.00 0 0 0.00 0 0 0.00
$ 1,000,000 $ 1,499,999 0 0 0.00 0 0 0.00 0 0 0.00
$ 1,500,000 and up 0 0 0.00 0 0 0.00 0 0 0.00
ALL 95 196 9.12 90 212 8.57 96 194 9.22
Cary, Oakwood Hill - 13
C O k d Hills
$ 0 $ 199,999 35 154 7.12 35 171 7.00 38 164 7.48
$ 200,000 $ 349,999 6 115 6.55 5 96 5.45 6 153 7.20
$ 350,000 $ 499,999 0 0 0.00 0 0 0.00 0 0 0.00
$ 500,000 $ 749,999 0 0 0.00 0 0 0.00 0 0 0.00
$ 750,000 $ 999,999 0 0 0.00 0 0 0.00 0 0 0.00
$ 1,000,000 $ 1,499,999 0 0 0.00 0 0 0.00 0 0 0.00
$ 1,500,000 and up 0 0 0.00 0 0 0.00 0 0 0.00
ALL 41 149 7.03 40 162 6.76 44 162 7.44
Cicero - 650
$ 0 $ 199,999 13 134 7.80 12 153 6.26 12 160 6.26
$ 200,000 $ 349,999 0 0 0.00 0 0 0.00 0 0 0.00
$ 350,000 $ 499,999 0 0 0.00 0 0 0.00 0 0 0.00
$ 500,000 $ 749,999 0 0 0.00 0 0 0.00 0 0 0.00
$ 750,000 $ 999,999 0 0 0.00 0 0 0.00 0 0 0.00
$ 1,000,000 $ 1,499,999 0 0 0.00 0 0 0.00 0 0 0.00
$ 1,500,000 and up 0 0 0.00 0 0 0.00 0 0 0.00
ALL 13 134 7.80 12 153 6.26 12 160 6.26
Data Source: MRED LLC (C) Copyright 2010, A.L. Wagner Appraisal Group, Inc.
Midwest Real Estate Data, LLC (630) 416-6556 www.WagnerAppraisal.com Page 5
- 6. as of May 1, 2010 as of June 1, 2010 as of July 1, 2010
# Actives DOM Months Supply # Actives DOM Months Supply # Actives DOM Months Supply
Clarendon Hills - 514
$ 0 $ 199,999 17 202 22.67 18 193 24.00 17 232 22.67
$ 200,000 $ 349,999 21 262 42.00 19 291 32.57 19 242 32.57
$ 350,000 $ 499,999 6 527 18.00 7 342 16.80 8 330 32.00
$ 500,000 $ 749,999 0 0 0.00 0 0 0.00 0 0 0.00
$ 750,000 $ 999,999 0 0 0.00 0 0 0.00 0 0 0.00
$ 1,000,000 $ 1,499,999 0 0 0.00 0 0 0.00 0 0 0.00
$ 1,500,000 and up 1 520 No Sales 1 552 No Sales 1 582 No Sales
ALL 45 280 27.00 45 266 24.55 45 262 27.00
Countryside - 527
$ 0 $ 199,999 28 333 17.68 27 352 18.00 29 348 18.32
$ 200,000 $ 349,999 3 182 36.00 3 213 No Sales 2 248 24.00
$ 350,000 $ 499,999 3 156 36.00 4 102 48.00 3 137 36.00
$ 500,000 $ 749,999 1 552 No Sales 2 302 No Sales 2 332 No Sales
$ 750,000 $ 999,999 0 0 0.00 0 0 0.00 0 0 0.00
$ 1,000,000 $ 1,499,999 0 0 0.00 0 0 0.00 0 0 0.00
$ 1,500,000 and up 0 0 0.00 0 0 0.00 0 0 0.00
ALL 35 311 20.00 36 310 22.74 36 324 20.57
Crest Hill - 498
C t
$ 0 $ 199,999 89 235 9.98 91 210 11.14 92 214 11.15
$ 200,000 $ 349,999 4 167 24.00 5 159 30.00 2 150 24.00
$ 350,000 $ 499,999 0 0 0.00 0 0 0.00 0 0 0.00
$ 500,000 $ 749,999 0 0 0.00 0 0 0.00 0 0 0.00
$ 750,000 $ 999,999 0 0 0.00 0 0 0.00 0 0 0.00
$ 1,000,000 $ 1,499,999 0 0 0.00 0 0 0.00 0 0 0.00
$ 1,500,000 and up 0 0 0.00 0 0 0.00 0 0 0.00
ALL 93 232 10.24 96 207 11.52 94 213 11.28
Crystal Lake, Lakewood - 14
$ 0 $ 199,999 119 219 11.70 125 234 12.40 127 228 12.19
$ 200,000 $ 349,999 18 158 12.71 17 166 11.33 16 162 12.80
$ 350,000 $ 499,999 3 170 12.00 2 185 12.00 1 73 4.00
$ 500,000 $ 749,999 0 0 0.00 0 0 0.00 0 0 0.00
$ 750,000 $ 999,999 0 0 0.00 0 0 0.00 0 0 0.00
$ 1,000,000 $ 1,499,999 0 0 0.00 0 0 0.00 0 0 0.00
$ 1,500,000 and up 0 0 0.00 0 0 0.00 0 0 0.00
ALL 140 210 11.83 144 225 12.26 144 220 12.08
Data Source: MRED LLC (C) Copyright 2010, A.L. Wagner Appraisal Group, Inc.
Midwest Real Estate Data, LLC (630) 416-6556 www.WagnerAppraisal.com Page 6
- 7. as of May 1, 2010 as of June 1, 2010 as of July 1, 2010
# Actives DOM Months Supply # Actives DOM Months Supply # Actives DOM Months Supply
Darien - 562
$ 0 $ 199,999 52 210 10.58 57 208 11.03 54 231 10.80
$ 200,000 $ 349,999 42 138 7.20 46 141 8.00 50 135 9.52
$ 350,000 $ 499,999 6 172 24.00 5 172 15.00 7 140 16.80
$ 500,000 $ 749,999 0 0 0.00 0 0 0.00 0 0 0.00
$ 750,000 $ 999,999 0 0 0.00 0 0 0.00 0 0 0.00
$ 1,000,000 $ 1,499,999 0 0 0.00 0 0 0.00 0 0 0.00
$ 1,500,000 and up 0 0 0.00 0 0 0.00 0 0 0.00
ALL 100 177 9.09 108 178 9.60 111 182 10.41
Deerfield - 15
$ 0 $ 199,999 29 200 6.82 33 188 7.76 33 216 8.25
$ 200,000 $ 349,999 34 207 12.75 34 217 12.00 40 221 15.00
$ 350,000 $ 499,999 15 208 20.00 16 162 19.20 13 112 15.60
$ 500,000 $ 749,999 2 261 6.00 2 292 24.00 2 322 24.00
$ 750,000 $ 999,999 0 0 0.00 0 0 0.00 0 0 0.00
$ 1,000,000 $ 1,499,999 0 0 0.00 0 0 0.00 0 0 0.00
$ 1,500,000 and up 0 0 0.00 0 0 0.00 0 0 0.00
ALL 80 206 10.00 85 197 10.63 88 205 11.60
Des Pl i
D Plaines - 16
$ 0 $ 199,999 334 252 8.26 364 253 9.14 386 255 9.75
$ 200,000 $ 349,999 106 222 10.78 121 282 15.45 118 293 17.70
$ 350,000 $ 499,999 7 206 84.00 9 187 108.00 10 183 120.00
$ 500,000 $ 749,999 1 824 6.00 0 0 0.00 0 0 0.00
$ 750,000 $ 999,999 0 0 0.00 0 0 0.00 0 0 0.00
$ 1,000,000 $ 1,499,999 0 0 0.00 0 0 0.00 0 0 0.00
$ 1,500,000 and up 0 0 0.00 0 0 0.00 0 0 0.00
ALL 448 245 8.87 494 259 10.33 514 262 11.07
Downers Grove - 515
$ 0 $ 199,999 170 274 16.06 169 291 16.35 172 293 16.65
$ 200,000 $ 349,999 52 275 14.18 54 280 14.73 59 300 16.47
$ 350,000 $ 499,999 29 265 24.86 34 354 25.50 37 363 29.60
$ 500,000 $ 749,999 9 434 108.00 15 566 180.00 15 570 90.00
$ 750,000 $ 999,999 0 0 0.00 0 0 0.00 0 0 0.00
$ 1,000,000 $ 1,499,999 0 0 0.00 0 0 0.00 0 0 0.00
$ 1,500,000 and up 0 0 0.00 0 0 0.00 0 0 0.00
ALL 260 279 16.77 272 312 17.64 283 319 18.46
Data Source: MRED LLC (C) Copyright 2010, A.L. Wagner Appraisal Group, Inc.
Midwest Real Estate Data, LLC (630) 416-6556 www.WagnerAppraisal.com Page 7
- 8. as of May 1, 2010 as of June 1, 2010 as of July 1, 2010
# Actives DOM Months Supply # Actives DOM Months Supply # Actives DOM Months Supply
East & West Dundee, Sleepy Hollow - 118
$ 0 $ 199,999 40 234 18.46 35 276 14.48 35 259 14.48
$ 200,000 $ 349,999 9 239 36.00 8 257 48.00 6 325 72.00
$ 350,000 $ 499,999 0 0 0.00 0 0 0.00 0 0 0.00
$ 500,000 $ 749,999 0 0 0.00 0 0 0.00 0 0 0.00
$ 750,000 $ 999,999 0 0 0.00 0 0 0.00 0 0 0.00
$ 1,000,000 $ 1,499,999 0 0 0.00 0 0 0.00 0 0 0.00
$ 1,500,000 and up 0 0 0.00 0 0 0.00 0 0 0.00
ALL 49 235 20.28 43 273 16.65 41 268 16.40
Elgin - 123
$ 0 $ 199,999 260 196 11.30 271 208 11.96 254 211 11.25
$ 200,000 $ 349,999 85 258 18.55 84 273 19.76 75 250 18.75
$ 350,000 $ 499,999 2 336 24.00 3 268 36.00 2 397 24.00
$ 500,000 $ 749,999 0 0 0.00 0 0 0.00 0 0 0.00
$ 750,000 $ 999,999 0 0 0.00 0 0 0.00 0 0 0.00
$ 1,000,000 $ 1,499,999 0 0 0.00 0 0 0.00 0 0 0.00
$ 1,500,000 and up 0 0 0.00 0 0 0.00 0 0 0.00
ALL 347 212 12.54 358 224 13.26 331 221 12.41
Elk Grove Village - 7
G Vill
$ 0 $ 199,999 111 251 10.09 109 273 10.06 127 268 12.81
$ 200,000 $ 349,999 53 184 15.14 62 165 22.55 61 181 23.61
$ 350,000 $ 499,999 0 0 0.00 0 0 0.00 0 0 0.00
$ 500,000 $ 749,999 0 0 0.00 0 0 0.00 0 0 0.00
$ 750,000 $ 999,999 0 0 0.00 0 0 0.00 0 0 0.00
$ 1,000,000 $ 1,499,999 0 0 0.00 0 0 0.00 0 0 0.00
$ 1,500,000 and up 0 0 0.00 0 0 0.00 0 0 0.00
ALL 164 229 11.31 171 234 12.59 188 240 15.04
Elmhurst - 126
$ 0 $ 199,999 33 312 15.84 35 335 16.80 39 333 19.50
$ 200,000 $ 349,999 41 255 19.68 40 258 20.87 41 253 18.92
$ 350,000 $ 499,999 7 159 12.00 8 195 13.71 7 236 14.00
$ 500,000 $ 749,999 4 137 16.00 4 168 16.00 4 199 16.00
$ 750,000 $ 999,999 1 320 No Sales 1 351 No Sales 0 0 0.00
$ 1,000,000 $ 1,499,999 0 0 0.00 0 0 0.00 0 0 0.00
$ 1,500,000 and up 0 0 0.00 0 0 0.00 0 0 0.00
ALL 86 265 17.20 88 280 18.21 91 284 18.51
Data Source: MRED LLC (C) Copyright 2010, A.L. Wagner Appraisal Group, Inc.
Midwest Real Estate Data, LLC (630) 416-6556 www.WagnerAppraisal.com Page 8
- 9. as of May 1, 2010 as of June 1, 2010 as of July 1, 2010
# Actives DOM Months Supply # Actives DOM Months Supply # Actives DOM Months Supply
Elmwood Park - 635
$ 0 $ 199,999 80 243 12.63 72 258 10.67 77 267 11.13
$ 200,000 $ 349,999 19 179 11.40 19 192 12.67 13 197 8.21
$ 350,000 $ 499,999 0 0 0.00 0 0 0.00 0 0 0.00
$ 500,000 $ 749,999 0 0 0.00 0 0 0.00 0 0 0.00
$ 750,000 $ 999,999 0 0 0.00 0 0 0.00 0 0 0.00
$ 1,000,000 $ 1,499,999 0 0 0.00 0 0 0.00 0 0 0.00
$ 1,500,000 and up 0 0 0.00 0 0 0.00 0 0 0.00
ALL 99 231 12.38 91 244 11.03 90 257 10.59
Evanston - 201
$ 0 $ 199,999 172 226 10.02 171 241 9.91 182 247 10.45
$ 200,000 $ 349,999 209 174 10.76 202 172 10.77 186 183 9.92
$ 350,000 $ 499,999 78 183 12.00 83 204 12.30 71 214 10.92
$ 500,000 $ 749,999 29 256 12.43 34 196 15.11 34 195 13.16
$ 750,000 $ 999,999 6 225 9.00 6 167 7.20 7 165 9.33
$ 1,000,000 $ 1,499,999 9 224 13.50 8 283 13.71 6 297 9.00
$ 1,500,000 and up 1 74 6.00 1 105 6.00 1 135 6.00
ALL 504 199 10.74 505 204 10.84 487 213 10.40
Flossmoor - 422
Fl
$ 0 $ 199,999 29 312 15.82 26 345 13.57 32 297 15.36
$ 200,000 $ 349,999 4 175 24.00 3 139 12.00 3 120 12.00
$ 350,000 $ 499,999 0 0 0.00 0 0 0.00 0 0 0.00
$ 500,000 $ 749,999 0 0 0.00 0 0 0.00 0 0 0.00
$ 750,000 $ 999,999 0 0 0.00 0 0 0.00 0 0 0.00
$ 1,000,000 $ 1,499,999 0 0 0.00 0 0 0.00 0 0 0.00
$ 1,500,000 and up 0 0 0.00 0 0 0.00 0 0 0.00
ALL 33 295 16.50 29 323 13.38 35 281 15.00
Fox Lake - 20
$ 0 $ 199,999 89 223 13.35 91 237 12.85 92 237 13.46
$ 200,000 $ 349,999 6 552 72.00 6 575 72.00 7 521 42.00
$ 350,000 $ 499,999 1 3 No Sales 0 0 0.00 2 37 No Sales
$ 500,000 $ 749,999 0 0 0.00 0 0 0.00 0 0 0.00
$ 750,000 $ 999,999 0 0 0.00 0 0 0.00 0 0 0.00
$ 1,000,000 $ 1,499,999 0 0 0.00 0 0 0.00 0 0 0.00
$ 1,500,000 and up 0 0 0.00 0 0 0.00 0 0 0.00
ALL 96 241 14.22 97 258 13.38 101 253 14.43
Data Source: MRED LLC (C) Copyright 2010, A.L. Wagner Appraisal Group, Inc.
Midwest Real Estate Data, LLC (630) 416-6556 www.WagnerAppraisal.com Page 9
- 10. as of May 1, 2010 as of June 1, 2010 as of July 1, 2010
# Actives DOM Months Supply # Actives DOM Months Supply # Actives DOM Months Supply
Frankfort, Green Garden - 423
$ 0 $ 199,999 26 162 10.06 24 197 9.93 24 149 8.73
$ 200,000 $ 349,999 48 387 15.16 47 388 17.09 48 410 18.00
$ 350,000 $ 499,999 16 580 64.00 18 575 54.00 13 675 39.00
$ 500,000 $ 749,999 5 294 No Sales 4 346 No Sales 5 355 No Sales
$ 750,000 $ 999,999 0 0 0.00 0 0 0.00 0 0 0.00
$ 1,000,000 $ 1,499,999 0 0 0.00 0 0 0.00 0 0 0.00
$ 1,500,000 and up 0 0 0.00 0 0 0.00 0 0 0.00
ALL 95 353 15.83 93 373 16.91 90 376 15.65
Geneva - 134
$ 0 $ 199,999 21 189 15.75 20 222 13.33 19 237 14.25
$ 200,000 $ 349,999 54 249 21.60 55 252 19.41 52 258 17.33
$ 350,000 $ 499,999 11 194 44.00 12 208 48.00 12 238 48.00
$ 500,000 $ 749,999 0 0 0.00 0 0 0.00 0 0 0.00
$ 750,000 $ 999,999 0 0 0.00 0 0 0.00 0 0 0.00
$ 1,000,000 $ 1,499,999 0 0 0.00 0 0 0.00 0 0 0.00
$ 1,500,000 and up 0 0 0.00 0 0 0.00 0 0 0.00
ALL 86 227 20.64 87 239 18.64 83 250 17.79
Gilberts
Gilb t - 136
$ 0 $ 199,999 31 184 11.27 31 140 11.27 34 171 11.66
$ 200,000 $ 349,999 11 260 4.71 16 208 6.86 14 257 6.00
$ 350,000 $ 499,999 1 542 No Sales 1 573 No Sales 1 603 No Sales
$ 500,000 $ 749,999 0 0 0.00 0 0 0.00 0 0 0.00
$ 750,000 $ 999,999 0 0 0.00 0 0 0.00 0 0 0.00
$ 1,000,000 $ 1,499,999 0 0 0.00 0 0 0.00 0 0 0.00
$ 1,500,000 and up 0 0 0.00 0 0 0.00 0 0 0.00
ALL 43 212 8.46 48 172 9.44 49 204 9.33
Glen Ellyn - 137
$ 0 $ 199,999 97 305 12.52 105 318 14.32 108 318 15.43
$ 200,000 $ 349,999 48 329 30.32 43 363 32.25 46 349 34.50
$ 350,000 $ 499,999 18 341 9.82 20 360 10.43 22 320 12.57
$ 500,000 $ 749,999 11 765 13.20 11 796 13.20 10 770 13.33
$ 750,000 $ 999,999 3 488 36.00 3 519 36.00 3 549 36.00
$ 1,000,000 $ 1,499,999 0 0 0.00 0 0 0.00 0 0 0.00
$ 1,500,000 and up 0 0 0.00 0 0 0.00 0 0 0.00
ALL 177 347 14.65 182 366 15.83 189 353 17.31
Data Source: MRED LLC (C) Copyright 2010, A.L. Wagner Appraisal Group, Inc.
Midwest Real Estate Data, LLC (630) 416-6556 www.WagnerAppraisal.com Page 10
- 11. as of May 1, 2010 as of June 1, 2010 as of July 1, 2010
# Actives DOM Months Supply # Actives DOM Months Supply # Actives DOM Months Supply
Glendale Heights - 139
$ 0 $ 199,999 145 194 7.77 141 183 7.39 141 189 7.29
$ 200,000 $ 349,999 32 207 48.00 29 205 38.67 21 267 36.00
$ 350,000 $ 499,999 0 0 0.00 0 0 0.00 0 0 0.00
$ 500,000 $ 749,999 0 0 0.00 0 0 0.00 0 0 0.00
$ 750,000 $ 999,999 0 0 0.00 0 0 0.00 0 0 0.00
$ 1,000,000 $ 1,499,999 0 0 0.00 0 0 0.00 0 0 0.00
$ 1,500,000 and up 0 0 0.00 0 0 0.00 0 0 0.00
ALL 177 196 9.16 170 186 8.57 162 199 8.13
Glenview, Golf - 25
$ 0 $ 199,999 78 212 8.59 84 235 9.60 95 241 11.29
$ 200,000 $ 349,999 61 233 12.62 60 205 12.20 59 203 12.87
$ 350,000 $ 499,999 45 229 13.17 51 245 15.69 55 212 17.84
$ 500,000 $ 749,999 40 160 21.82 37 161 19.30 40 159 20.87
$ 750,000 $ 999,999 6 104 72.00 5 114 60.00 5 144 60.00
$ 1,000,000 $ 1,499,999 0 0 0.00 0 0 0.00 0 0 0.00
$ 1,500,000 and up 0 0 0.00 0 0 0.00 0 0 0.00
ALL 230 209 11.95 237 215 12.53 254 211 14.05
Glenwood - 425
Gl d
$ 0 $ 199,999 31 220 17.71 33 237 19.80 34 217 20.40
$ 200,000 $ 349,999 0 0 0.00 0 0 0.00 0 0 0.00
$ 350,000 $ 499,999 0 0 0.00 0 0 0.00 0 0 0.00
$ 500,000 $ 749,999 0 0 0.00 0 0 0.00 0 0 0.00
$ 750,000 $ 999,999 0 0 0.00 0 0 0.00 0 0 0.00
$ 1,000,000 $ 1,499,999 0 0 0.00 0 0 0.00 0 0 0.00
$ 1,500,000 and up 0 0 0.00 0 0 0.00 0 0 0.00
ALL 31 220 17.71 33 237 19.80 34 217 20.40
Grayslake, Hainesville - 30
$ 0 $ 199,999 116 168 11.14 127 187 12.60 125 200 12.93
$ 200,000 $ 349,999 22 226 33.00 22 179 37.71 21 195 36.00
$ 350,000 $ 499,999 3 99 36.00 3 130 36.00 3 56 18.00
$ 500,000 $ 749,999 0 0 0.00 0 0 0.00 0 0 0.00
$ 750,000 $ 999,999 0 0 0.00 0 0 0.00 0 0 0.00
$ 1,000,000 $ 1,499,999 0 0 0.00 0 0 0.00 0 0 0.00
$ 1,500,000 and up 0 0 0.00 0 0 0.00 0 0 0.00
ALL 141 175 12.63 152 185 14.14 149 197 14.30
Data Source: MRED LLC (C) Copyright 2010, A.L. Wagner Appraisal Group, Inc.
Midwest Real Estate Data, LLC (630) 416-6556 www.WagnerAppraisal.com Page 11
- 12. as of May 1, 2010 as of June 1, 2010 as of July 1, 2010
# Actives DOM Months Supply # Actives DOM Months Supply # Actives DOM Months Supply
Gurnee - 31
$ 0 $ 199,999 118 181 10.65 115 181 10.07 142 156 12.62
$ 200,000 $ 349,999 20 170 15.00 18 148 14.40 15 171 15.00
$ 350,000 $ 499,999 2 20 No Sales 0 0 0.00 0 0 0.00
$ 500,000 $ 749,999 0 0 0.00 0 0 0.00 0 0 0.00
$ 750,000 $ 999,999 0 0 0.00 0 0 0.00 0 0 0.00
$ 1,000,000 $ 1,499,999 0 0 0.00 0 0 0.00 0 0 0.00
$ 1,500,000 and up 0 0 0.00 0 0 0.00 0 0 0.00
ALL 140 177 11.28 133 176 10.50 157 158 12.82
Hanover Park - 103
$ 0 $ 199,999 132 175 7.76 138 166 7.96 134 181 7.55
$ 200,000 $ 349,999 16 164 19.20 16 172 24.00 16 194 21.33
$ 350,000 $ 499,999 0 0 0.00 0 0 0.00 0 0 0.00
$ 500,000 $ 749,999 0 0 0.00 0 0 0.00 0 0 0.00
$ 750,000 $ 999,999 0 0 0.00 0 0 0.00 0 0 0.00
$ 1,000,000 $ 1,499,999 0 0 0.00 0 0 0.00 0 0 0.00
$ 1,500,000 and up 0 0 0.00 0 0 0.00 0 0 0.00
ALL 148 174 8.30 154 167 8.56 150 183 8.11
Highland Park
Hi hl d P k - 35
$ 0 $ 199,999 19 307 10.36 18 334 9.00 20 265 10.43
$ 200,000 $ 349,999 41 239 23.43 43 237 24.57 41 261 23.43
$ 350,000 $ 499,999 24 218 36.00 22 216 26.40 22 244 26.40
$ 500,000 $ 749,999 19 176 57.00 18 205 30.86 16 225 21.33
$ 750,000 $ 999,999 6 361 36.00 5 239 30.00 6 116 24.00
$ 1,000,000 $ 1,499,999 2 272 No Sales 2 303 No Sales 4 178 No Sales
$ 1,500,000 and up 2 774 No Sales 2 805 No Sales 2 835 No Sales
ALL 113 252 23.79 110 255 20.63 111 253 20.18
Hinsdale - 521
$ 0 $ 199,999 3 104 3.60 5 101 6.00 5 131 6.67
$ 200,000 $ 349,999 23 380 13.14 22 417 13.20 26 396 18.35
$ 350,000 $ 499,999 9 254 21.60 9 256 21.60 9 278 36.00
$ 500,000 $ 749,999 14 385 56.00 16 366 64.00 16 377 38.40
$ 750,000 $ 999,999 0 0 0.00 0 0 0.00 0 0 0.00
$ 1,000,000 $ 1,499,999 2 44 24.00 2 75 24.00 2 105 24.00
$ 1,500,000 and up 0 0 0.00 0 0 0.00 0 0 0.00
ALL 51 330 14.57 54 333 15.80 58 340 18.81
Data Source: MRED LLC (C) Copyright 2010, A.L. Wagner Appraisal Group, Inc.
Midwest Real Estate Data, LLC (630) 416-6556 www.WagnerAppraisal.com Page 12
- 13. as of May 1, 2010 as of June 1, 2010 as of July 1, 2010
# Actives DOM Months Supply # Actives DOM Months Supply # Actives DOM Months Supply
Hoffman Estates - 194
$ 0 $ 199,999 156 204 10.12 149 223 10.10 152 239 10.54
$ 200,000 $ 349,999 74 139 13.66 72 137 12.90 69 137 12.94
$ 350,000 $ 499,999 0 0 0.00 0 0 0.00 0 0 0.00
$ 500,000 $ 749,999 0 0 0.00 0 0 0.00 0 0 0.00
$ 750,000 $ 999,999 0 0 0.00 0 0 0.00 0 0 0.00
$ 1,000,000 $ 1,499,999 0 0 0.00 0 0 0.00 0 0 0.00
$ 1,500,000 and up 0 0 0.00 0 0 0.00 0 0 0.00
ALL 230 183 11.04 221 195 10.87 221 207 11.19
Homewood - 430
$ 0 $ 199,999 56 288 15.63 60 276 16.36 77 249 19.66
$ 200,000 $ 349,999 0 0 0.00 0 0 0.00 0 0 0.00
$ 350,000 $ 499,999 0 0 0.00 0 0 0.00 0 0 0.00
$ 500,000 $ 749,999 0 0 0.00 0 0 0.00 0 0 0.00
$ 750,000 $ 999,999 0 0 0.00 0 0 0.00 0 0 0.00
$ 1,000,000 $ 1,499,999 0 0 0.00 0 0 0.00 0 0 0.00
$ 1,500,000 and up 0 0 0.00 0 0 0.00 0 0 0.00
ALL 56 288 15.63 60 276 16.36 77 249 19.66
Huntley - 142
H tl
$ 0 $ 199,999 76 242 10.99 73 253 10.31 79 249 11.29
$ 200,000 $ 349,999 5 254 12.00 3 355 9.00 3 385 9.00
$ 350,000 $ 499,999 0 0 0.00 0 0 0.00 0 0 0.00
$ 500,000 $ 749,999 0 0 0.00 0 0 0.00 0 0 0.00
$ 750,000 $ 999,999 0 0 0.00 0 0 0.00 0 0 0.00
$ 1,000,000 $ 1,499,999 0 0 0.00 0 0 0.00 0 0 0.00
$ 1,500,000 and up 0 0 0.00 0 0 0.00 0 0 0.00
ALL 81 243 11.05 76 257 10.25 82 254 11.18
Indian Head Park - 531
$ 0 $ 199,999 14 422 4.94 14 369 4.94 14 316 4.94
$ 200,000 $ 349,999 25 176 12.00 22 216 9.78 23 244 10.22
$ 350,000 $ 499,999 2 67 4.80 2 98 4.80 3 89 7.20
$ 500,000 $ 749,999 0 0 0.00 0 0 0.00 1 22 4.00
$ 750,000 $ 999,999 0 0 0.00 0 0 0.00 0 0 0.00
$ 1,000,000 $ 1,499,999 0 0 0.00 0 0 0.00 0 0 0.00
$ 1,500,000 and up 0 0 0.00 0 0 0.00 0 0 0.00
ALL 41 255 7.24 38 266 6.61 41 252 7.13
Data Source: MRED LLC (C) Copyright 2010, A.L. Wagner Appraisal Group, Inc.
Midwest Real Estate Data, LLC (630) 416-6556 www.WagnerAppraisal.com Page 13
- 14. as of May 1, 2010 as of June 1, 2010 as of July 1, 2010
# Actives DOM Months Supply # Actives DOM Months Supply # Actives DOM Months Supply
Itasca - 143
$ 0 $ 199,999 14 101 21.00 15 138 25.71 13 173 19.50
$ 200,000 $ 349,999 34 227 12.75 33 248 13.20 31 263 12.83
$ 350,000 $ 499,999 3 381 12.00 2 442 8.00 2 472 8.00
$ 500,000 $ 749,999 1 25 No Sales 1 56 No Sales 1 86 No Sales
$ 750,000 $ 999,999 0 0 0.00 0 0 0.00 0 0 0.00
$ 1,000,000 $ 1,499,999 0 0 0.00 0 0 0.00 0 0 0.00
$ 1,500,000 and up 0 0 0.00 0 0 0.00 0 0 0.00
ALL 52 198 14.51 51 219 15.30 47 243 14.10
Joliet - 499
$ 0 $ 199,999 164 244 8.67 168 226 9.16 184 221 10.56
$ 200,000 $ 349,999 26 175 52.00 25 212 50.00 20 145 40.00
$ 350,000 $ 499,999 0 0 0.00 0 0 0.00 0 0 0.00
$ 500,000 $ 749,999 0 0 0.00 0 0 0.00 0 0 0.00
$ 750,000 $ 999,999 0 0 0.00 0 0 0.00 0 0 0.00
$ 1,000,000 $ 1,499,999 0 0 0.00 0 0 0.00 0 0 0.00
$ 1,500,000 and up 0 0 0.00 0 0 0.00 0 0 0.00
ALL 190 234 9.79 193 224 10.25 204 214 11.39
LaGrange - 525
L G
$ 0 $ 199,999 33 158 15.84 33 188 16.50 31 238 13.29
$ 200,000 $ 349,999 19 219 28.50 18 212 27.00 16 221 19.20
$ 350,000 $ 499,999 3 284 7.20 3 285 6.00 3 315 6.00
$ 500,000 $ 749,999 0 0 0.00 0 0 0.00 0 0 0.00
$ 750,000 $ 999,999 0 0 0.00 0 0 0.00 0 0 0.00
$ 1,000,000 $ 1,499,999 0 0 0.00 0 0 0.00 0 0 0.00
$ 1,500,000 and up 0 0 0.00 0 0 0.00 0 0 0.00
ALL 55 186 17.37 54 201 17.05 50 237 13.64
Lake Bluff - 44
$ 0 $ 199,999 23 210 16.24 24 195 16.94 22 241 13.89
$ 200,000 $ 349,999 7 163 7.00 5 160 5.45 8 120 12.00
$ 350,000 $ 499,999 2 91 8.00 2 122 8.00 2 152 8.00
$ 500,000 $ 749,999 3 64 9.00 3 81 7.20 3 111 9.00
$ 750,000 $ 999,999 0 0 0.00 0 0 0.00 0 0 0.00
$ 1,000,000 $ 1,499,999 0 0 0.00 0 0 0.00 0 0 0.00
$ 1,500,000 and up 0 0 0.00 0 0 0.00 0 0 0.00
ALL 35 181 11.67 34 175 11.33 35 197 12.35
Data Source: MRED LLC (C) Copyright 2010, A.L. Wagner Appraisal Group, Inc.
Midwest Real Estate Data, LLC (630) 416-6556 www.WagnerAppraisal.com Page 14
- 15. as of May 1, 2010 as of June 1, 2010 as of July 1, 2010
# Actives DOM Months Supply # Actives DOM Months Supply # Actives DOM Months Supply
Lake Forest - 45
$ 0 $ 199,999 4 256 16.00 4 287 16.00 5 254 15.00
$ 200,000 $ 349,999 21 329 13.26 18 334 12.00 14 380 8.84
$ 350,000 $ 499,999 14 300 12.00 13 325 10.40 12 406 9.00
$ 500,000 $ 749,999 18 364 27.00 12 429 11.08 16 402 16.00
$ 750,000 $ 999,999 7 786 28.00 8 716 32.00 8 746 24.00
$ 1,000,000 $ 1,499,999 11 150 44.00 6 211 18.00 6 241 24.00
$ 1,500,000 and up 5 415 60.00 4 456 24.00 3 393 18.00
ALL 80 349 18.82 65 390 13.45 64 414 12.80
Lake In The Hills - 156
$ 0 $ 199,999 101 179 9.11 107 185 9.80 107 197 10.44
$ 200,000 $ 349,999 13 131 15.60 14 155 18.67 11 205 14.67
$ 350,000 $ 499,999 2 250 8.00 2 281 8.00 2 311 6.00
$ 500,000 $ 749,999 1 89 No Sales 1 120 No Sales 1 150 No Sales
$ 750,000 $ 999,999 0 0 0.00 0 0 0.00 0 0 0.00
$ 1,000,000 $ 1,499,999 0 0 0.00 0 0 0.00 0 0 0.00
$ 1,500,000 and up 0 0 0.00 0 0 0.00 0 0 0.00
ALL 117 174 9.62 124 183 10.41 121 199 10.68
Lake Villa, Li d h
L k Vill Lindenhurst - 46
t
$ 0 $ 199,999 41 185 8.95 39 159 8.07 45 170 10.38
$ 200,000 $ 349,999 5 39 6.00 4 76 6.00 3 66 4.00
$ 350,000 $ 499,999 0 0 0.00 0 0 0.00 0 0 0.00
$ 500,000 $ 749,999 0 0 0.00 0 0 0.00 0 0 0.00
$ 750,000 $ 999,999 0 0 0.00 0 0 0.00 0 0 0.00
$ 1,000,000 $ 1,499,999 0 0 0.00 0 0 0.00 0 0 0.00
$ 1,500,000 and up 0 0 0.00 0 0 0.00 0 0 0.00
ALL 46 169 8.49 43 151 7.82 48 164 9.44
Lemont - 439
$ 0 $ 199,999 5 168 15.00 5 219 12.00 6 212 14.40
$ 200,000 $ 349,999 18 199 13.50 19 251 15.20 22 223 20.31
$ 350,000 $ 499,999 19 290 22.80 17 295 17.00 14 291 12.92
$ 500,000 $ 749,999 2 100 24.00 2 131 No Sales 2 161 No Sales
$ 750,000 $ 999,999 0 0 0.00 0 0 0.00 0 0 0.00
$ 1,000,000 $ 1,499,999 0 0 0.00 0 0 0.00 0 0 0.00
$ 1,500,000 and up 0 0 0.00 0 0 0.00 0 0 0.00
ALL 44 230 17.03 43 259 16.13 44 240 17.03
Data Source: MRED LLC (C) Copyright 2010, A.L. Wagner Appraisal Group, Inc.
Midwest Real Estate Data, LLC (630) 416-6556 www.WagnerAppraisal.com Page 15
- 16. as of May 1, 2010 as of June 1, 2010 as of July 1, 2010
# Actives DOM Months Supply # Actives DOM Months Supply # Actives DOM Months Supply
Libertyville, Green Oaks - 48
$ 0 $ 199,999 26 149 14.18 28 156 16.00 29 173 17.40
$ 200,000 $ 349,999 30 211 13.33 28 228 12.92 25 233 11.11
$ 350,000 $ 499,999 15 215 60.00 15 212 45.00 11 182 26.40
$ 500,000 $ 749,999 2 219 24.00 1 338 12.00 0 0 0.00
$ 750,000 $ 999,999 0 0 0.00 0 0 0.00 0 0 0.00
$ 1,000,000 $ 1,499,999 0 0 0.00 0 0 0.00 0 0 0.00
$ 1,500,000 and up 0 0 0.00 0 0 0.00 0 0 0.00
ALL 73 190 16.53 72 198 16.62 65 198 14.72
Lisle - 532
$ 0 $ 199,999 154 239 11.20 158 259 11.42 163 247 11.85
$ 200,000 $ 349,999 25 154 9.38 28 177 10.84 31 172 13.29
$ 350,000 $ 499,999 10 697 30.00 10 697 24.00 11 663 26.40
$ 500,000 $ 749,999 2 236 12.00 2 267 12.00 3 200 18.00
$ 750,000 $ 999,999 0 0 0.00 0 0 0.00 0 0 0.00
$ 1,000,000 $ 1,499,999 0 0 0.00 0 0 0.00 0 0 0.00
$ 1,500,000 and up 0 0 0.00 0 0 0.00 0 0 0.00
ALL 191 252 11.29 198 270 11.65 208 257 12.48
Lockport, H
L k t Homer TTownship - 495
hi
$ 0 $ 199,999 77 160 7.39 75 169 7.83 74 179 7.79
$ 200,000 $ 349,999 22 395 10.15 21 313 10.50 26 293 14.18
$ 350,000 $ 499,999 2 420 No Sales 2 451 No Sales 2 481 No Sales
$ 500,000 $ 749,999 0 0 0.00 0 0 0.00 0 0 0.00
$ 750,000 $ 999,999 0 0 0.00 0 0 0.00 0 0 0.00
$ 1,000,000 $ 1,499,999 0 0 0.00 0 0 0.00 0 0 0.00
$ 1,500,000 and up 0 0 0.00 0 0 0.00 0 0 0.00
ALL 101 216 8.03 98 206 8.46 102 214 9.00
Lombard - 148
$ 0 $ 199,999 141 223 14.84 135 242 14.21 127 252 12.92
$ 200,000 $ 349,999 97 172 20.42 104 192 22.69 108 185 24.92
$ 350,000 $ 499,999 9 294 108.00 9 325 108.00 9 300 108.00
$ 500,000 $ 749,999 0 0 0.00 0 0 0.00 0 0 0.00
$ 750,000 $ 999,999 0 0 0.00 0 0 0.00 0 0 0.00
$ 1,000,000 $ 1,499,999 0 0 0.00 0 0 0.00 0 0 0.00
$ 1,500,000 and up 0 0 0.00 0 0 0.00 0 0 0.00
ALL 247 206 17.23 248 224 17.51 244 224 17.12
Data Source: MRED LLC (C) Copyright 2010, A.L. Wagner Appraisal Group, Inc.
Midwest Real Estate Data, LLC (630) 416-6556 www.WagnerAppraisal.com Page 16
- 17. as of May 1, 2010 as of June 1, 2010 as of July 1, 2010
# Actives DOM Months Supply # Actives DOM Months Supply # Actives DOM Months Supply
Long Grove, Lake Zurich, Hawthorn Woods, Kildeer - 47
$ 0 $ 199,999 5 130 7.50 5 149 10.00 7 147 12.00
$ 200,000 $ 349,999 27 240 16.20 29 231 18.32 25 174 17.65
$ 350,000 $ 499,999 10 304 20.00 14 251 24.00 12 251 20.57
$ 500,000 $ 749,999 3 87 36.00 3 118 36.00 2 141 24.00
$ 750,000 $ 999,999 0 0 0.00 0 0 0.00 0 0 0.00
$ 1,000,000 $ 1,499,999 0 0 0.00 0 0 0.00 0 0 0.00
$ 1,500,000 and up 0 0 0.00 0 0 0.00 0 0 0.00
ALL 45 232 15.43 51 222 18.55 46 188 17.25
Lyons - 534
$ 0 $ 199,999 25 266 15.79 26 249 15.60 30 244 18.95
$ 200,000 $ 349,999 5 221 60.00 3 359 36.00 2 438 24.00
$ 350,000 $ 499,999 0 0 0.00 0 0 0.00 0 0 0.00
$ 500,000 $ 749,999 0 0 0.00 0 0 0.00 0 0 0.00
$ 750,000 $ 999,999 0 0 0.00 0 0 0.00 0 0 0.00
$ 1,000,000 $ 1,499,999 0 0 0.00 0 0 0.00 0 0 0.00
$ 1,500,000 and up 0 0 0.00 0 0 0.00 0 0 0.00
ALL 30 259 18.00 29 260 16.57 32 256 19.20
McHenry, Lake M
M H L k Moor, M C ll
McCullom Lake, Ri
L k Ringwood, S
d Sunnyside, J h b
id Johnsburg - 50
$ 0 $ 199,999 113 291 10.35 112 285 10.50 116 300 11.05
$ 200,000 $ 349,999 27 61 81.00 30 84 120.00 30 114 120.00
$ 350,000 $ 499,999 0 0 0.00 0 0 0.00 0 0 0.00
$ 500,000 $ 749,999 0 0 0.00 0 0 0.00 0 0 0.00
$ 750,000 $ 999,999 0 0 0.00 0 0 0.00 0 0 0.00
$ 1,000,000 $ 1,499,999 0 0 0.00 0 0 0.00 0 0 0.00
$ 1,500,000 and up 0 0 0.00 0 0 0.00 0 0 0.00
ALL 140 247 12.35 142 243 12.91 146 262 13.48
Melrose Park - 160
$ 0 $ 199,999 11 268 6.95 12 175 7.58 9 181 5.68
$ 200,000 $ 349,999 17 376 102.00 16 416 96.00 17 420 102.00
$ 350,000 $ 499,999 0 0 0.00 1 697 No Sales 1 727 No Sales
$ 500,000 $ 749,999 1 666 No Sales 0 0 0.00 0 0 0.00
$ 750,000 $ 999,999 0 0 0.00 0 0 0.00 0 0 0.00
$ 1,000,000 $ 1,499,999 0 0 0.00 0 0 0.00 0 0 0.00
$ 1,500,000 and up 0 0 0.00 0 0 0.00 0 0 0.00
ALL 29 345 16.57 29 326 16.57 27 352 15.43
Data Source: MRED LLC (C) Copyright 2010, A.L. Wagner Appraisal Group, Inc.
Midwest Real Estate Data, LLC (630) 416-6556 www.WagnerAppraisal.com Page 17
- 18. as of May 1, 2010 as of June 1, 2010 as of July 1, 2010
# Actives DOM Months Supply # Actives DOM Months Supply # Actives DOM Months Supply
Mokena - 448
$ 0 $ 199,999 20 183 6.86 22 208 7.33 23 206 7.89
$ 200,000 $ 349,999 39 269 9.36 38 275 8.94 39 177 9.36
$ 350,000 $ 499,999 5 232 60.00 5 229 60.00 4 313 24.00
$ 500,000 $ 749,999 0 0 0.00 0 0 0.00 0 0 0.00
$ 750,000 $ 999,999 0 0 0.00 0 0 0.00 0 0 0.00
$ 1,000,000 $ 1,499,999 0 0 0.00 0 0 0.00 0 0 0.00
$ 1,500,000 and up 0 0 0.00 0 0 0.00 0 0 0.00
ALL 64 239 8.93 65 249 8.86 66 195 9.10
Montgomery - 538
$ 0 $ 199,999 38 276 4.80 40 227 5.11 49 196 6.46
$ 200,000 $ 349,999 0 0 0.00 0 0 0.00 0 0 0.00
$ 350,000 $ 499,999 0 0 0.00 0 0 0.00 0 0 0.00
$ 500,000 $ 749,999 0 0 0.00 0 0 0.00 0 0 0.00
$ 750,000 $ 999,999 0 0 0.00 0 0 0.00 0 0 0.00
$ 1,000,000 $ 1,499,999 0 0 0.00 0 0 0.00 0 0 0.00
$ 1,500,000 and up 0 0 0.00 0 0 0.00 0 0 0.00
ALL 38 276 4.80 40 227 5.11 49 196 6.46
Morton G
M t Grove - 53
$ 0 $ 199,999 46 307 19.71 46 314 16.24 47 309 17.09
$ 200,000 $ 349,999 45 199 12.27 54 161 16.20 55 176 17.84
$ 350,000 $ 499,999 18 178 72.00 21 167 84.00 20 201 80.00
$ 500,000 $ 749,999 0 0 0.00 0 0 0.00 0 0 0.00
$ 750,000 $ 999,999 0 0 0.00 0 0 0.00 0 0 0.00
$ 1,000,000 $ 1,499,999 0 0 0.00 0 0 0.00 0 0 0.00
$ 1,500,000 and up 0 0 0.00 0 0 0.00 0 0 0.00
ALL 109 241 17.44 121 220 18.86 122 231 20.05
Mount Prospect - 56
$ 0 $ 199,999 123 246 10.39 125 246 10.07 132 246 10.42
$ 200,000 $ 349,999 59 182 13.36 64 196 15.06 68 179 17.36
$ 350,000 $ 499,999 8 418 96.00 8 436 96.00 6 596 36.00
$ 500,000 $ 749,999 2 137 24.00 3 145 No Sales 0 0 0.00
$ 750,000 $ 999,999 0 0 0.00 0 0 0.00 0 0 0.00
$ 1,000,000 $ 1,499,999 0 0 0.00 0 0 0.00 0 0 0.00
$ 1,500,000 and up 0 0 0.00 0 0 0.00 0 0 0.00
ALL 192 232 11.70 200 236 11.94 206 234 12.30
Data Source: MRED LLC (C) Copyright 2010, A.L. Wagner Appraisal Group, Inc.
Midwest Real Estate Data, LLC (630) 416-6556 www.WagnerAppraisal.com Page 18
- 19. as of May 1, 2010 as of June 1, 2010 as of July 1, 2010
# Actives DOM Months Supply # Actives DOM Months Supply # Actives DOM Months Supply
Mundelein - 60
$ 0 $ 199,999 63 194 9.57 68 202 10.88 68 209 11.18
$ 200,000 $ 349,999 36 211 22.74 32 227 20.21 32 203 21.33
$ 350,000 $ 499,999 7 260 84.00 6 305 72.00 5 381 60.00
$ 500,000 $ 749,999 1 377 No Sales 1 408 No Sales 0 0 0.00
$ 750,000 $ 999,999 0 0 0.00 0 0 0.00 0 0 0.00
$ 1,000,000 $ 1,499,999 0 0 0.00 0 0 0.00 0 0 0.00
$ 1,500,000 and up 0 0 0.00 0 0 0.00 0 0 0.00
ALL 107 206 12.97 107 217 13.52 105 215 13.70
Naperville - 540
$ 0 $ 199,999 278 185 8.78 307 188 10.04 320 191 10.67
$ 200,000 $ 349,999 158 156 9.07 141 170 8.77 142 163 9.52
$ 350,000 $ 499,999 25 188 20.00 22 198 14.67 26 180 18.35
$ 500,000 $ 749,999 13 303 14.18 16 293 17.45 14 309 12.92
$ 750,000 $ 999,999 2 59 No Sales 0 0 0.00 0 0 0.00
$ 1,000,000 $ 1,499,999 2 595 No Sales 2 626 No Sales 1 709 No Sales
$ 1,500,000 and up 2 625 No Sales 2 656 No Sales 1 1,013 No Sales
ALL 480 182 9.37 490 191 9.98 504 189 10.63
New Lenox - 451
N L
$ 0 $ 199,999 32 132 12.00 32 146 11.29 33 142 12.38
$ 200,000 $ 349,999 23 233 15.33 21 217 14.00 22 231 17.60
$ 350,000 $ 499,999 0 0 0.00 0 0 0.00 0 0 0.00
$ 500,000 $ 749,999 0 0 0.00 0 0 0.00 0 0 0.00
$ 750,000 $ 999,999 0 0 0.00 0 0 0.00 0 0 0.00
$ 1,000,000 $ 1,499,999 0 0 0.00 0 0 0.00 0 0 0.00
$ 1,500,000 and up 0 0 0.00 0 0 0.00 0 0 0.00
ALL 55 174 13.20 53 174 12.23 55 178 14.04
Niles - 648
$ 0 $ 199,999 46 288 6.00 44 230 5.68 47 225 5.88
$ 200,000 $ 349,999 39 268 14.18 42 236 17.38 41 258 16.40
$ 350,000 $ 499,999 0 0 0.00 1 9 No Sales 1 39 No Sales
$ 500,000 $ 749,999 0 0 0.00 0 0 0.00 0 0 0.00
$ 750,000 $ 999,999 0 0 0.00 0 0 0.00 0 0 0.00
$ 1,000,000 $ 1,499,999 0 0 0.00 0 0 0.00 0 0 0.00
$ 1,500,000 and up 0 0 0.00 0 0 0.00 0 0 0.00
ALL 85 279 8.10 87 230 8.56 89 238 8.48
Data Source: MRED LLC (C) Copyright 2010, A.L. Wagner Appraisal Group, Inc.
Midwest Real Estate Data, LLC (630) 416-6556 www.WagnerAppraisal.com Page 19