Stock Research Report for Yamana Gold Inc GAS as of 11/17/11 - Chaikin Power Tools
•
1 like•184 views

To order a Chaikin Power Gauge stock research report for GAS go to http://www.chaikinpowertools.com/reports

Recommended
Recommended
More Related Content
Recently uploaded
Recently uploaded (20)
Featured
Featured (20)
Stock Research Report for Yamana Gold Inc GAS as of 11/17/11 - Chaikin Power Tools
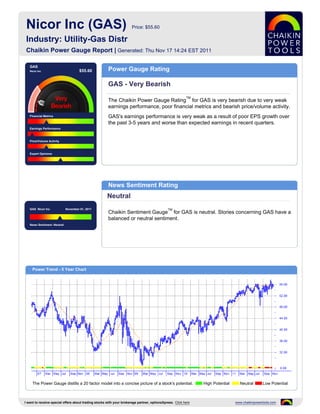
- 1. Nicor Inc (GAS) Price: $55.60 Industry: Utility-Gas Distr Chaikin Power Gauge Report | Generated: Thu Nov 17 14:24 EST 2011 GAS Nicor Inc $55.60 Power Gauge Rating GAS - Very Bearish TM The Chaikin Power Gauge Rating for GAS is very bearish due to very weak earnings performance, poor financial metrics and bearish price/volume activity. Financial Metrics GAS's earnings performance is very weak as a result of poor EPS growth over the past 3-5 years and worse than expected earnings in recent quarters. Earnings Performance Price/Volume Activity Expert Opinions News Sentiment Rating Neutral GAS Nicor Inc November 01, 2011 TM Chaikin Sentiment Gauge for GAS is neutral. Stories concerning GAS have a balanced or neutral sentiment. News Sentiment :Neutral Power Trend - 5 Year Chart The Power Gauge distills a 20 factor model into a concise picture of a stock's potential. High Potential Neutral Low Potential I want to receive special offers about trading stocks with your brokerage partner, optionsXpress. Click here www.chaikinpowertools.com
- 2. Financials & Earnings Financial Metrics Financial Metrics Rating LT Debt/Equity Ratio Bearish Price to Book Value GAS's financial metrics are poor. The company generates relatively low free cash flow relative to market capitalization and may be overvalued. Return on Equity The rank is based on a low long term debt to equity ratio, high price to book value ratio, low price to sales ratio and relatively low cash flow. Price to Sales Ratio Business Value Assets and Liabilities Valuation Returns Ratio TTM Ratio TTM Ratio TTM Current Ratio 0.85 Price/Book 2.30 Return on Invest 6.8% LT Debt/Equity 0.45 Price/Sales 0.93 Return on Equity 9.9% Earnings Performance Earnings Performance Rating Earnings Growth Very Bearish Earnings Surprise GAS's earnings performance has been very weak. The company has a history of weak earnings growth and has not met analysts' earnings estimates. Earnings Trend The rank is based on poor EPS growth over the past 3-5 years, worse than expected earnings in recent quarters, a relatively poor trend in earnings this year, Projected P/E Ratio a relatively high projected P/E ratio and consistent earnings over the past 5 years. Earnings Consistency 5 Year Revenue and Earnings Growth EPS Estimates 12/06 12/07 12/08 12/09 12/10 Factor Actual EPS Prev EST EPS Current Change Revenue(M) 2,960.00 3,176.30 3,776.60 2,652.10 2,709.80 Quarterly EPS $0.87 $0.83 -0.04 Rev % Growth -11.85% 7.31% 18.90% -29.78% 2.18% Yearly EPS $3.02 $2.35 -0.67 EPS $2.88 $2.99 $2.64 $2.99 $3.02 Factor Actual EPS Growth Est EPS Growth Change EPS % Growth -6.49% 3.82% -11.71% 13.26% 1.00% 3-5 year EPS -2.65% 3.50% +6.15 EPS Surprise EPS Quarterly Results Estimate Actual Difference % Difference FY Qtr 1 Qtr 2 Qtr 3 Qtr 4 Total Latest Qtr $0.30 $0.12 $-0.18 -60.00 12/09 $0.97 $0.50 $0.30 $1.22 $2.99 1 Qtr Ago $0.32 $0.42 $0.10 31.25 12/10 $1.33 $0.53 $0.30 $0.87 $3.03 2 Qtr Ago $0.92 $0.98 $0.06 6.52 12/11 $0.98 $0.42 $0.12 - - 3 Qtr Ago $0.93 $0.87 $-0.06 -6.45 Fiscal Year End Month is December. I want to receive special offers about trading stocks with your brokerage partner, optionsXpress. Click here www.chaikinpowertools.com
- 3. Price Trend & Expert Opinions Price/Volume Activity Price/Volume Activity Rating Relative Strength vs Market Bearish Chaikin Money Flow Price and volume activity for GAS is bearish. GAS is trading on lower volume than its 90 day average volume and is in a decelerating price trend compared to 4 Price Trend months ago. Price Trend ROC The rank for GAS is based on its price strength versus the market, positive Chaikin money flow, a positive Chaikin price trend, a negative Chaikin price trend ROC and a decreasing volume trend. Volume Trend Relative Strength vs S&P500 Index Chaikin Money Flow Chart shows whether GAS is performing better or worse than the market. Chaikin Money Flow analyzes supply and demand for a company's stock. Price Activity Price Activity Volume Activity Factor Value Factor Value Factor Value 52 Week High 57.49 % Change Price - 4 Weeks 0.42% Average Volume 20 Days 253,455 52 Week Low 43.25 % Change Price - 24 Weeks 2.22% Average Volume 90 Days 348,653 % Change YTD Rel S&P 500 11.85% % Change Price - 4 Wks Rel to S&P -1.78% Chaikin Money Flow Persistency 70% % Change Price - 24 Wks Rel to S&P 8.64% Expert Opinions Expert Opinions Earnings Estimate Revisions Neutral Short Interest Expert opinions about GAS are neutral. Analysts's opinions on GAS have been more positive recently and insiders are not net buyers of GAS's stock. Insider Activity The rank for GAS is based on a low short interest ratio, insiders not purchasing significant amounts of stock, optimistic analyst opinions and relative weakness of Analyst Opinions the stock versus the Utility-Gas Distr industry group. Relative Strength vs Industry Earnings Estimate Revisions Analyst Recommendations EPS Estimates Revision Summary Current 7 Days Ago % Change Factor Value Last Week Last 4 Weeks Current Qtr 0.83 0.83 0.00% Mean this Week Hold Up Down Up Down Next Qtr - - - Mean Last Week Hold Curr Qtr 0 0 1 0 Curr Yr 0 0 0 2 Current 30 Days Ago % Change Change 0.00 Next Qtr 0 0 0 0 Current FY 2.35 2.49 -0.14 Mean 5 Weeks Ago Hold Next Yr 0 0 0 0 I want to receive special offers about trading stocks with your brokerage partner, optionsXpress. Click here www.chaikinpowertools.com
- 4. The Company & Its Competitors GAS's Competitors in Utility-Gas Distr News Headlines for GAS Company Power Historic EPS Projected EPS Profit Margin PEG PE Revenue(M) Nicor Declares Special Pro Rata Dividend in Gauge growth growth Preparation for Completing Merger With AGL GAS -2.65% 3.50% 4.24% 6.76 23.27 2,710 Resources - Nov 1, 2011 SRE -4.41% 7.00% 13.85% 1.78 11.85 9,003 AGL Resources subsidiary to sell $500M in notes - Sep 16, 2011 UGI 3.53% 3.20% 3.82% 3.84 13.42 6,091 Nicor 2Q profit falls 21 percent - Aug 3, 2011 WGL 8.67% 5.17% 4.44% 3.33 18.88 - AGL: Some Nicor jobs could be affected by merger - Jul 14, 2011 OKE 2.61% - 2.29% - 26.22 13,030 Shareholders approve Nicor-AGL merger - Jun MDU 3.41% 7.00% 5.99% 2.60 17.21 3,910 14, 2011 Company Details Company Profile NICOR INC Nicor Inc. is a holding company and is a member of the Standard & Poor's 500 Index. Its 1844 FERRY RD primary business is Nicor Gas, one of the nation's largest natural gas distribution NAPERVILLE, IL 60566 companies. Nicor owns Tropical Shipping, a containerized shipping business serving the USA Caribbean region and the Bahamas. In addition, the company owns and has an equity Phone: 6303059500 interest in several energy-related businesses. Fax: 630-983-4229 Website: http://http://www.nicor.com Full Time Employees: 3,800 Sector: Utilities Power Gauge Ratings are created using a relative ranking system that assigns a rank of 0 to 100 (100 being the highest) to each stock in the universe. Rank is calculated by evaluating each of the stocks factors and combining them into a single number using a weighting formula. A stock's rank ranges from 100-0, where 100 is the strongest, and a rank of 95 indicates the stock is better than 95% of the stocks in the universe. Chaikin Stock Research(CSR) is not registered as a securities broker dealer or investment advisor with either the U.S. Securities and Exchange Commission or with any state securities regulatory authority. CSR is not responsible for trades executed by users of this research report, our web site or mobile app based on the information included herein. The information presented in this report does not represent a recommendation to buy or sell stocks or any financial instrument nor is it intended as an endorsement of any security or investment. The information in this report is generic by nature and is not personalized to the specific financial situation of any individual. The user bears complete responsibility for their own investment research and should seek the advice of a qualified investment professional before making any investment decisions. Copyright (c) 1978-(Present) by ZACKS Investment Research, Inc ("ZACKS"). The information, data, analyses and opinions contained herein (1) includes the confidential and proprietary information of ZACKS, (2) may not be copied or redistributed, for any purpose, (3) does not constitute investment advice offered by ZACKS, (4) are provided solely for informational purposes, and (5) are not warranted or represented to be correct, complete, accurate or timely. ZACKS shall not be responsible for investment decisions, damages or other losses resulting from, or related to, use of this information, data, analyses or opinions. Past performance is no guarantee of future performance. ZACKS is not affiliated with Chaikin Power Tools. This report from Chaikin Power Tools is for informational purposes only and is not a recommendation to buy or sell securities. LM 2.3 DS 3.0 LS 2.1 Data Provided by ZACKS Investment Research, Inc., www.zacks.com Special offers to trade stocks from optionsXpress: www.chaikinpowertools.com