Stock Research Report for Yamana Gold Inc EPD as of 11/17/11 - Chaikin Power Tools
•
1 gostou•202 visualizações

To order a Chaikin Power Gauge stock research report for EPD go to http://www.chaikinpowertools.com/reports

Recomendados
Recomendados
Mais conteúdo relacionado
Último
Último (20)
Destaque
Destaque (20)
Stock Research Report for Yamana Gold Inc EPD as of 11/17/11 - Chaikin Power Tools
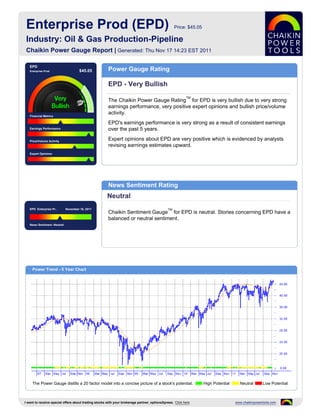
- 1. Enterprise Prod (EPD) Price: $45.05 Industry: Oil & Gas Production-Pipeline Chaikin Power Gauge Report | Generated: Thu Nov 17 14:23 EST 2011 EPD Enterprise Prod $45.05 Power Gauge Rating EPD - Very Bullish TM The Chaikin Power Gauge Rating for EPD is very bullish due to very strong earnings performance, very positive expert opinions and bullish price/volume activity. Financial Metrics EPD's earnings performance is very strong as a result of consistent earnings Earnings Performance over the past 5 years. Price/Volume Activity Expert opinions about EPD are very positive which is evidenced by analysts revising earnings estimates upward. Expert Opinions News Sentiment Rating Neutral EPD Enterprise Pr.. November 16, 2011 TM Chaikin Sentiment Gauge for EPD is neutral. Stories concerning EPD have a balanced or neutral sentiment. News Sentiment :Neutral Power Trend - 5 Year Chart The Power Gauge distills a 20 factor model into a concise picture of a stock's potential. High Potential Neutral Low Potential I want to receive special offers about trading stocks with your brokerage partner, optionsXpress. Click here www.chaikinpowertools.com
- 2. Financials & Earnings Financial Metrics Financial Metrics Rating LT Debt/Equity Ratio Neutral Price to Book Value EPD's financial metrics are neutral. The company yields a high return on shareholder's equity and is carrying too much long term debt. Return on Equity The rank is based on a high long term debt to equity ratio, high price to book value ratio, high return on equity and low price to sales ratio. Price to Sales Ratio Business Value Assets and Liabilities Valuation Returns Ratio TTM Ratio TTM Ratio TTM Current Ratio 0.83 Price/Book 3.52 Return on Invest 6.1% LT Debt/Equity 1.12 Price/Sales 1.21 Return on Equity 13.1% Earnings Performance Earnings Performance Rating Earnings Growth Very Bullish Earnings Surprise EPD's earnings performance has been very strong. The company has a stable 5 year earnings trend and has a history of strong earnings growth. Earnings Trend The rank is based on high earnings growth over the past 3-5 years, an upward trend in earnings this year, a relatively high projected P/E ratio and consistent Projected P/E Ratio earnings over the past 5 years. Earnings Consistency 5 Year Revenue and Earnings Growth EPS Estimates 12/06 12/07 12/08 12/09 12/10 Factor Actual EPS Prev EST EPS Current Change Revenue(M) 13,990.97 16,950.12 21,905.66 25,510.90 33,739.30 Quarterly EPS $0.33 $0.54 +0.21 Rev % Growth 14.15% 21.15% 29.24% 16.46% 32.25% Yearly EPS $1.15 $2.09 +0.94 EPS $1.21 $0.96 $1.85 $1.73 $1.15 Factor Actual EPS Growth Est EPS Growth Change EPS % Growth 32.97% -20.66% 92.71% -6.49% -33.53% 3-5 year EPS 22.65% 5.50% -17.15 EPS Surprise EPS Quarterly Results Estimate Actual Difference % Difference FY Qtr 1 Qtr 2 Qtr 3 Qtr 4 Total Latest Qtr $0.50 $0.55 $0.05 10.00 12/09 $0.41 $0.32 $0.36 $0.60 $1.69 1 Qtr Ago $0.47 $0.51 $0.04 8.51 12/10 $0.50 $0.46 $0.47 $0.33 $1.76 2 Qtr Ago $0.44 $0.48 $0.04 9.09 12/11 $0.49 $0.51 $0.55 - - 3 Qtr Ago $0.44 $0.46 $0.02 4.55 Fiscal Year End Month is December. I want to receive special offers about trading stocks with your brokerage partner, optionsXpress. Click here www.chaikinpowertools.com
- 3. Price Trend & Expert Opinions Price/Volume Activity Price/Volume Activity Rating Relative Strength vs Market Bullish Chaikin Money Flow Price and volume activity for EPD is bullish. EPD has outperformed the S&P 500 over 26 weeks and is experiencing sustained buying. Price Trend The rank for EPD is based on its price strength versus the market, positive Price Trend ROC Chaikin money flow, a positive Chaikin price trend and a negative Chaikin price trend ROC. Volume Trend Relative Strength vs S&P500 Index Chaikin Money Flow Chart shows whether EPD is performing better or worse than the market. Chaikin Money Flow analyzes supply and demand for a company's stock. Price Activity Price Activity Volume Activity Factor Value Factor Value Factor Value 52 Week High 45.48 % Change Price - 4 Weeks 2.90% Average Volume 20 Days 1,274,955 52 Week Low 37.50 % Change Price - 24 Weeks 9.43% Average Volume 90 Days 1,426,083 % Change YTD Rel S&P 500 7.71% % Change Price - 4 Wks Rel to S&P 0.65% Chaikin Money Flow Persistency 83% % Change Price - 24 Wks Rel to S&P 16.30% Expert Opinions Expert Opinions Earnings Estimate Revisions Very Bullish Short Interest Expert opinions about EPD are very positive. Analysts are raising their EPS estimates for EPD and shorting of EPD is low. Insider Activity The rank for EPD is based on analysts revising earnings estimates upward, a low short interest ratio, insiders purchasing stock and optimistic analyst opinions. Analyst Opinions Relative Strength vs Industry Earnings Estimate Revisions Analyst Recommendations EPS Estimates Revision Summary Current 7 Days Ago % Change Factor Value Last Week Last 4 Weeks Current Qtr 0.54 0.53 +1.89% Mean this Week Strong Buy Up Down Up Down Next Qtr 0.55 0.55 0.00% Mean Last Week Strong Buy Curr Qtr 1 0 4 1 Curr Yr 1 0 6 0 Current 30 Days Ago % Change Change 0.00 Next Qtr 0 0 3 0 Current FY 2.09 1.98 0.11 Mean 5 Weeks Ago Strong Buy Next Yr 0 0 5 0 I want to receive special offers about trading stocks with your brokerage partner, optionsXpress. Click here www.chaikinpowertools.com
- 4. The Company & Its Competitors EPD's Competitors in Oil & Gas Production-Pipeline News Headlines for EPD Company Power Historic EPS Projected EPS Profit Margin PEG PE Revenue(M) Enbridge to Acquire ConocoPhillips's Interest in Gauge growth growth Seaway Crude Pip - Nov 16, 2011 EPD 22.65% 5.50% 3.51% 3.92 22.51 33,739 Gardere Represents Boardwalk in Acquisition of OKS 133.73% 4.00% 6.40% 4.41 18.61 8,676 Petal and Hattiesburg Gas Storage Facilities - Oct 20, 2011 PAA 2.33% 5.00% 2.54% 2.76 14.07 25,893 Kinder Morgan to buy El Paso Corp. for $20.7B - SXL 18.30% 6.00% 3.03% 2.30 14.66 7,838 Oct 16, 2011 Enterprise Products and Duncan Energy EEP 10.49% 2.50% 3.79% 8.75 23.27 7,736 Complete Merger - Sep 7, 2011 KMP -0.64% 3.50% 14.72% 12.01 46.24 8,078 Duncan Energy Partners’ Unitholders ETP 3.52% 18.26% 10.62% 1.40 25.69 5,885 Approve Merger with Enterprise Products Partners - Sep 7, 2011 ETE 0.83% 17.16% 3.83% 1.43 23.81 6,598 Company Details Company Profile ENTERPRISE PROD Enterprise Products Partners L.P. is a leading integrated provider of processing and 1100 LOUISIANA 10TH FLOOR transportation services to producers of Natural Gas Liquids (NGLs) and consumers of HOUSTON, TX 77002 NGL products. The Company fractionates for a processing fee mixed NGLs produced as USA by-products of oil and natural gas production into their component products: ethane, Phone: 7133816500 propane, isobutane, normal butane and natural gasoline; converts normal butane to Fax: 713-880-6668 isobutane through the process of isomerization; produces MTBE from isobutane and Website: methanol; and transports NGL products to end users by pipeline and railcar. http://http://www.epplp.com Full Time Employees: 1,400 Sector: Oils/Energy Power Gauge Ratings are created using a relative ranking system that assigns a rank of 0 to 100 (100 being the highest) to each stock in the universe. Rank is calculated by evaluating each of the stocks factors and combining them into a single number using a weighting formula. A stock's rank ranges from 100-0, where 100 is the strongest, and a rank of 95 indicates the stock is better than 95% of the stocks in the universe. Chaikin Stock Research(CSR) is not registered as a securities broker dealer or investment advisor with either the U.S. Securities and Exchange Commission or with any state securities regulatory authority. CSR is not responsible for trades executed by users of this research report, our web site or mobile app based on the information included herein. The information presented in this report does not represent a recommendation to buy or sell stocks or any financial instrument nor is it intended as an endorsement of any security or investment. The information in this report is generic by nature and is not personalized to the specific financial situation of any individual. The user bears complete responsibility for their own investment research and should seek the advice of a qualified investment professional before making any investment decisions. Copyright (c) 1978-(Present) by ZACKS Investment Research, Inc ("ZACKS"). The information, data, analyses and opinions contained herein (1) includes the confidential and proprietary information of ZACKS, (2) may not be copied or redistributed, for any purpose, (3) does not constitute investment advice offered by ZACKS, (4) are provided solely for informational purposes, and (5) are not warranted or represented to be correct, complete, accurate or timely. ZACKS shall not be responsible for investment decisions, damages or other losses resulting from, or related to, use of this information, data, analyses or opinions. Past performance is no guarantee of future performance. ZACKS is not affiliated with Chaikin Power Tools. This report from Chaikin Power Tools is for informational purposes only and is not a recommendation to buy or sell securities. LM 2.3 DS 3.0 LS 2.1 Data Provided by ZACKS Investment Research, Inc., www.zacks.com Special offers to trade stocks from optionsXpress: www.chaikinpowertools.com