Stock Research Report for AAPL as of 6/23/11 - Chaikin Power Tools
•
1 gostou•199 visualizações

To order a free Chaikin Power Gauge stock research report for AAPL go to http://www.chaikinpowertools.com/reports

Recomendados
Recomendados
Mais conteúdo relacionado
Mais de Dan Oconnor
Mais de Dan Oconnor (8)
Último
Último (20)
Stock Research Report for AAPL as of 6/23/11 - Chaikin Power Tools
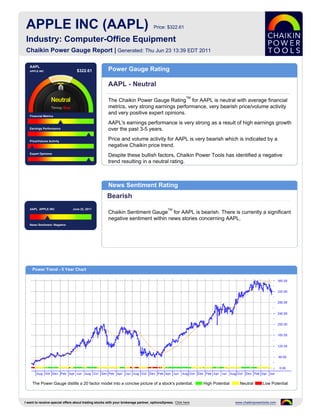
- 1. APPLE INC (AAPL) Price: $322.61 Industry: Computer-Office Equipment Chaikin Power Gauge Report | Generated: Thu Jun 23 13:39 EDT 2011 AAPL APPLE INC $322.61 Power Gauge Rating AAPL - Neutral TM The Chaikin Power Gauge Rating for AAPL is neutral with average financial metrics, very strong earnings performance, very bearish price/volume activity and very positive expert opinions. Financial Metrics AAPL's earnings performance is very strong as a result of high earnings growth Earnings Performance over the past 3-5 years. Price/Volume Activity Price and volume activity for AAPL is very bearish which is indicated by a negative Chaikin price trend. Expert Opinions Despite these bullish factors, Chaikin Power Tools has identified a negative trend resulting in a neutral rating. News Sentiment Rating Bearish AAPL APPLE INC June 22, 2011 TM Chaikin Sentiment Gauge for AAPL is bearish. There is currently a significant negative sentiment within news stories concerning AAPL. News Sentiment :Negative Power Trend - 5 Year Chart The Power Gauge distills a 20 factor model into a concise picture of a stock's potential. High Potential Neutral Low Potential I want to receive special offers about trading stocks with your brokerage partner, optionsXpress. Click here www.chaikinpowertools.com
- 2. Financials & Earnings Financial Metrics Financial Metrics Rating LT Debt/Equity Ratio Neutral Price to Book Value AAPL's financial metrics are neutral. The company does not hold much long term debt and may be overvalued. Return on Equity The rank is based on a low long term debt to equity ratio, high price to book value ratio, high return on equity, high price to sales ratio and relatively high cash flow. Price to Sales Ratio Business Value Assets and Liabilities Valuation Returns Ratio TTM Ratio TTM Ratio TTM Current Ratio 1.93 Price/Book 4.83 Return on Invest 37.8% LT Debt/Equity 0.00 Price/Sales 4.57 Return on Equity 37.8% Earnings Performance Earnings Performance Rating Earnings Growth Very Bullish Earnings Surprise AAPL's earnings performance has been very strong. The company has a history of strong earnings growth and has a stable 5 year earnings trend. Earnings Trend The rank is based on high earnings growth over the past 3-5 years, better than expected earnings in recent quarters, an upward trend in earnings this year and Projected P/E Ratio consistent earnings over the past 5 years. Earnings Consistency 5 Year Revenue and Earnings Growth EPS Estimates 09/06 09/07 09/08 09/09 09/10 Factor Actual EPS Prev EST EPS Current Change Revenue(M) 19,315.00 24,006.00 32,479.00 36,537.00 65,225.00 Quarterly EPS $3.57 $5.63 +2.06 Rev % Growth 38.65% 24.29% 35.30% 12.49% 78.52% Yearly EPS $15.41 $24.79 +9.38 EPS $2.36 $4.04 $5.48 $6.39 $15.41 Factor Actual EPS Growth Est EPS Growth Change EPS % Growth 43.03% 71.19% 35.64% 16.61% 141.16% 3-5 year EPS 37.85% 18.21% -19.64 EPS Surprise EPS Quarterly Results Estimate Actual Difference % Difference FY Qtr 1 Qtr 2 Qtr 3 Qtr 4 Total Latest Qtr $5.35 $6.40 $1.05 19.63 09/09 $1.81 $1.35 $1.38 $1.85 $6.39 1 Qtr Ago $5.38 $6.43 $1.05 19.52 09/10 $3.74 $3.39 $3.57 $4.71 $15.41 2 Qtr Ago $4.05 $4.64 $0.59 14.57 09/11 $6.53 $6.49 - - - 3 Qtr Ago $3.08 $3.51 $0.43 13.96 Fiscal Year End Month is September. I want to receive special offers about trading stocks with your brokerage partner, optionsXpress. Click here www.chaikinpowertools.com
- 3. Price Trend & Expert Opinions Price/Volume Activity Price/Volume Activity Rating Relative Strength vs Market Very Bearish Chaikin Money Flow Price and volume activity for AAPL is very bearish. AAPL has a declining price trend and is trading on lower volume than its 90 day average volume. Price Trend The rank for AAPL is based on a negative Chaikin price trend and a decreasing Price Trend ROC volume trend. Volume Trend Relative Strength vs S&P500 Index Chaikin Money Flow Chart shows whether AAPL is performing better or worse than the market. Chaikin Money Flow analyzes supply and demand for a company's stock. Price Activity Price Activity Volume Activity Factor Value Factor Value Factor Value 52 Week High 363.13 % Change Price - 4 Weeks -4.21% Average Volume 20 Days 13,925,222 52 Week Low 239.93 % Change Price - 24 Weeks -3.41% Average Volume 90 Days 15,744,881 % Change YTD Rel S&P 500 -1.80% % Change Price - 4 Wks Rel to S&P -1.73% Chaikin Money Flow Persistency 52% % Change Price - 24 Wks Rel to S&P -4.20% Expert Opinions Expert Opinions Earnings Estimate Revisions Very Bullish Short Interest Expert opinions about AAPL are very positive. Analysts are raising their EPS estimates for AAPL and shorting of AAPL is low. Insider Activity The rank for AAPL is based on analysts revising earnings estimates upward, a low short interest ratio, insiders not purchasing significant amounts of stock, Analyst Opinions optimistic analyst opinions and relative weakness of the stock versus the Computer-Office Equipment industry group. Relative Strength vs Industry Earnings Estimate Revisions Analyst Recommendations EPS Estimates Revision Summary Current 7 Days Ago % Change Factor Value Last Week Last 4 Weeks Current Qtr 5.63 5.63 0.00% Mean this Week Strong Buy Up Down Up Down Next Qtr 6.32 6.33 -0.16% Mean Last Week Strong Buy Curr Qtr 0 0 4 1 Curr Yr 0 1 5 2 Current 30 Days Ago % Change Change 0.00 Next Qtr 0 1 5 2 Current FY 24.79 24.77 0.02 Mean 5 Weeks Ago Strong Buy Next Yr 0 1 6 2 I want to receive special offers about trading stocks with your brokerage partner, optionsXpress. Click here www.chaikinpowertools.com
- 4. The Company & Its Competitors AAPL's Competitors in Computer-Office Equipment News Headlines for AAPL Company Power Historic EPS Projected EPS Profit Margin PEG PE Revenue(M) Motorola Mobility shares fall on analyst Gauge growth growth downgrade - Jun 21, 2011 AAPL 37.85% 18.21% 22.36% 0.72 15.38 65,225 Few targeted tax breaks for NC companies DELL 2.39% 7.50% 5.26% 1.16 8.76 61,494 under GOP - Jun 20, 2011 Apple's Jobs emerges, unveils new services - Jun 7, 2011 Mad Catz® Brings Cyborg® R.A.T.™ Range of Gaming Mice to the Mac® - Jun 7, 2011 Apple to launch cloud-based service for digital content - Jun 6, 2011 Company Details Company Profile APPLE INC Apple Computer, Inc. designs, manufactures and markets personal computers and ONE INFINITE LOOP related personal computing and communicating solutions for sale primarily to education, CUPERTINO, CA 95014 creative, consumer, and business customers. USA Phone: (408) 996-1010 Fax: 408-996-0275 Website: http://http://www.apple.com Full Time Employees: 49,400 Sector: Computer and Technology Power Gauge Ratings are created using a relative ranking system that assigns a rank of 0 to 100 (100 being the highest) to each stock in the universe. Rank is calculated by evaluating each of the stocks factors and combining them into a single number using a weighting formula. A stock's rank ranges from 100-0, where 100 is the strongest, and a rank of 95 indicates the stock is better than 95% of the stocks in the universe. Chaikin Stock Research(CSR) is not registered as a securities broker dealer or investment advisor with either the U.S. Securities and Exchange Commission or with any state securities regulatory authority. CSR is not responsible for trades executed by users of this research report, our web site or mobile app based on the information included herein. The information presented in this report does not represent a recommendation to buy or sell stocks or any financial instrument nor is it intended as an endorsement of any security or investment. The information in this report is generic by nature and is not personalized to the specific financial situation of any individual. The user bears complete responsibility for their own investment research and should seek the advice of a qualified investment professional before making any investment decisions. Copyright (c) 1978-(Present) by ZACKS Investment Research, Inc ("ZACKS"). The information, data, analyses and opinions contained herein (1) includes the confidential and proprietary information of ZACKS, (2) may not be copied or redistributed, for any purpose, (3) does not constitute investment advice offered by ZACKS, (4) are provided solely for informational purposes, and (5) are not warranted or represented to be correct, complete, accurate or timely. ZACKS shall not be responsible for investment decisions, damages or other losses resulting from, or related to, use of this information, data, analyses or opinions. Past performance is no guarantee of future performance. ZACKS is not affiliated with Chaikin Power Tools. This report from Chaikin Power Tools is for informational purposes only and is not a recommendation to buy or sell securities. LM 2.3 DS 3.0 LS 2.1 Data Provided by ZACKS Investment Research, Inc., www.zacks.com Special offers to trade stocks from optionsXpress: www.chaikinpowertools.com