CCAFS: An overview
•Transferir como PPT, PDF•
2 gostaram•697 visualizações

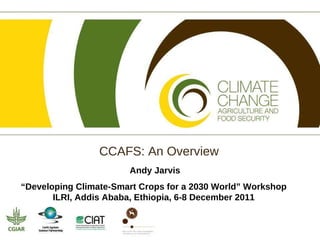
Presented by Andy Jarvis at the CCAFS Workshop on Developing Climate-Smart Crops for a 2030 World, ILRI, Addis Ababa, Ethiopia, 6-8 December 2011.

Recomendados
Recomendados
Mais conteúdo relacionado
Mais procurados
Mais procurados (20)
Semelhante a CCAFS: An overview
Semelhante a CCAFS: An overview (20)
Mais de CCAFS | CGIAR Research Program on Climate Change, Agriculture and Food Security
Mais de CCAFS | CGIAR Research Program on Climate Change, Agriculture and Food Security (20)
Último
Último (20)
CCAFS: An overview
- 1. Andy Jarvis “ Developing Climate-Smart Crops for a 2030 World” Workshop ILRI, Addis Ababa, Ethiopia, 6-8 December 2011
- 3. The concentration of GHGs is rising Long-term implications for the climate and for crop suitability
- 4. Historical impacts on food security % Yield impact for wheat Observed changes in growing season temperature for crop growing regions,1980-2008. Lobell et al (2011)
- 5. Average projected % change in suitability for 50 crops, to 2050 Crop suitability is changing
- 7. Message 1: In the coming decades, climate change and other global trends will endanger agriculture, food security, and rural livelihoods.
- 8. Left : Example of a silvo-pastoral system 2006 2007 2008 Ecosystem valuation Spot the livestock! Average price in voluntary carbon markets ($/tCO2e)
- 10. Message 2: With new challenges also come new opportunities.
- 11. Program Design
- 15. Where is the research being done? >> At our 15 CG centers and ~70 regional offices The CGIAR Research Centers Lead center - CIAT
- 16. Place-based field work Indo- Gangetic Plains : There is risk of heat stress, melting glaciers, and sea level rise; the intensity and probability of extreme events will likely increase. Regional director: Pramod Aggarwal East Africa : Climate change will likely intensify surface and groundwater stress. Regional director: James Kinyangi West Africa : Extreme rainfall variability impedes precipitation predictions, but the Sahel will likely experience shorter growing periods. Regional director: Robert Zougmor é
- 19. Pro-poor Mitigation VISION Short-term : Identifying options feasible for smallholder mitigation and trade-offs with other outcomes Long-term : Addressing conflict between achieving food security and agricultural mitigation
- 21. Cross-cutting principles, activities & outputs
- 23. Mainstream outputs and outcomes For research partners to generate useful data, tools, and results. CLIFF, meteorological services, climate and agricultural research institutes, the Climate Food and Farming PhD student network For policy partners to demand and use data, tools, and results Governments, civil society, development organizations, farmers’ organizations, private sector e.g. User-driven regional scenarios
- 27. Objective One: Adapted farming systems via integrated technologies, practices, and policies Objective Two: Breeding strategies to address abiotic and biotic stresses induced by future climates Objective Three: Identification, conservation, and deployment of species and genetic diversity Adaptation to progressive climate change · 1
- 30. Cassava pests under climate change Cassava pests hotspots - 2050
- 31. Development of strategies Milestone 1.2.1.1 Research and policy organizations actively engaged in research design ; one regional breeding strategy workshop involving regional decision-making and priority setting bodies delivered in each of 3 initial target regions (2011) Milestone 1.2.1.2 Crop breeding institutions coordinated in development of climate-proofed crops for a 2030-2050 world; Document written jointly by CCAFS and crop breeding institutions outlining coordinated plans for breeding . (2012) Milestone 1.2.1.3 Range of crop modeling approaches developed and evaluated for biotic and abiotic constraints for the period 2020 to 2050; findings presented in summary report and at key stakeholders meetings ; including modelling approaches to evaluate the impacts of climate change and the effects of adaptation technologies such as supplemental irrigation and water harvesting on water availability for crops and their productivity under decadal futures from 2020 to 2050 (2013). Milestone 1.2.1.4 Detailed crop-by-crop strategies and plans of action for crop improvement developed, incorporating portfolio of national, regional and global priorities; findings presented in summary report (2015) Milestone 1.2.1.5 Set of “virtual crops” designed and assessed for their efficacy in addressing the likely future conditions in terms of the economic, social and cultural benefits expected; findings presented in summary report and journal article. Engagement of ARI modeling groups (e.g. Leeds University), NARES scientists (2014) Milestone 1.2.1.6 Set of breeding strategies identified and socialized with funding bodies, national and international organizations , universities and other actors; findings presented in summary report and policy briefs (including percentage of total food crop production (in recent history) accounted for by set of breeding strategies) (2015)
- 32. Dissemination of strategies Milestone 1.2.2.1 High-level meetings held with key stakeholders resulting in mainstreaming of new breeding strategies in workplans and existing breeding programs. (2015) Milestone 1.2.2.2 Global, regional and national policy briefs produced for investments in climate-proofed crop breeding initiatives (2015) Milestone 1.2.2.3 (2015) One policy briefing meeting per region based on the briefs in 1.2.2.2. Milestone 1.2.3.1 Policy recommendations provided to national agencies, policy makers and key actors in the agricultural sector on how to target strategies to enable equitable access by different social groups (e.g. pastoralists, fishers, urban farmers) and by women and men. (2015)
- 34. Adaptation to progressive climate change · 1 >> Spotlight on: Farms of the future The climate analogue tool identifies the range of places whose current climates correspond to the future of a chosen locality What CCAFS output? Choice of sites for cross-site farmer visits and participatory crop and livestock trials Why is it useful?
- 36. >> Multi-site agricultural trial database(agtrials.org) 20,000+ maize trials in 123 research sites Effect of +1ºC warming on yield Sites with >23ºC would suffer even if optimally managed More than 20% loss in sites with >20ºC, under drought Lobell et al. 2011
- 38. http:// gismap.ciat.cgiar.org/MarkSimGCM / >> Spotlight on: Integration for Decision Making · 4 A tool to generate daily data that are characteristic of future climatologies for any point on the globe What CCAFS outputs? To drive agricultural impact models for climate change studies Why is it useful?
- 39. stay in touch www.ccafs.cgiar.org sign up for science, policy and news e-bulletins follow us on twitter @cgiarclimate
Notas do Editor
- For Lobell map: Values show the linear trend in temperature for the main crop grown in that grid cell, and for the months in which that crop is grown. Values indicate the trend in terms of multiples of the standard deviation of historical year-to-year variation. ** A 1˚C rise tended to lower yields by up to 10% except in high latitude countries, where in particular rice gains from warming. ** In India, warming may explain the recently slowing of yield gains. For yield graph: Estimated net impact of climate trends for 1980-2008 on crop yields for major producers and for global production. Values are expressed as percent of average yield. Gray bars show median estimate and error bars show 5-95% confidence interval from bootstrap resampling with 500 replicates. Red and blue dots show median estimate of impact for T trend and P trend, respectively. ** At the global scale, maize and wheat exhibited negative impacts for several major producers and global net loss of 3.8% and 5.5% relative to what would have been achieved without the climate trends in 1980-2008. In absolute terms, these equal the annual production of maize in Mexico (23 MT) and wheat in France (33 MT), respectively. Source: Climate Trends and Global Crop Production Since 1980 David B. Lobell 1 , , Wolfram Schlenker 2 , 3 , and Justin Costa-Roberts 1 Science magazine
- Why focus on Food security And climate change has to be set in the context of growing populations and changing diets 60-70% more food will be needed by 2050 because of population growth and changing diets – and this is in a context where climate change will make agriculture more difficult.
- Carbon becomes a commodity, and a profitable one at that. Can smallholders get a piece of the action?
- Challenge Program then CGIAR Research Program Theme Leaders spread across CG system and the global change community in advanced research institutes New way of working – deliberately networked
- In a sense all CCAFS work is geared towards enhancing capacity to anticipate and manage different and uncertain climatic futures Capacity enhancement integrated into all themes CCAFS’s comparative advantage is in policy-oriented research So gearing capacity enhancement activities in this area
- Culmination of perhaps a decade of work but has come out under CCAFS led by Phil Thornton Will generate series/runs of simulated future climate data (daily temperature and rainfall) for any coordinates on the planet These data crucial for e.g. estimating future crop suitability/yields/failures Also have made available set of downscaled climate data sets – strong demand from developing countries and over 200 downloads