SlideShare uma empresa Scribd logo
1 de 22
Baixar para ler offline
Office Market Dashboard
    Greater Toronto Area
2011 Q2
MARKET SNAPSHOT                                                                                                                                                          MAP OF MARKET
                                                              2011 Q1                  2011 Q2              Trend
                         Office Inventory*                  185,846,509               186,620,371             p
                          Net Absorption                     1,758,390                 1,271,574              q
                             Vacancy Rate                          6.4%                  5.9%                 q
        Average Asking Net Rent                                   $16.08                $16.04                q
           Average Additional Rent                                $15.18                $15.09                q
*Office Inventory: For the purpose of this report, buildings with less than 10,000 SF of office
space and buildings owned and occupied by the government have not been included in the
office inventory. There are 2124 office buildings surveyed in the GTA office region.


GROSS RENT & AVAILABILITY BY BUILDING CLASS                                                                                                                              AVAILABLE SUPPLY SPLIT
                                   Avail. Office Space            Not Avail. Office Space         Gross Rent                                                                                 Sublease Avail      Direct Avail     Sublease % of Total Avail.
                                                                                                                                                                                 2,500                                                                         50%
                       $70                                                                                    8,000
                                                                                                                                                                                                                                                               45%
                       $60                                                                                    7,000                                                              2,000                                                                         40%
                              $59.98
                                                                                                                                                                                                                                                               35%
                                                                                                                                                                       SF (10,000's)

                                                                                                              6,000                                                              1,500                                                                         30%
                       $50
                                                                                                              5,000                                                                                                                                            25%
                                                                                                                       SF (10,000's)


                                                                                                                                                                                 1,000                                                                         20%
    Gross Rent $/SF


                       $40
                                                                                                              4,000                                                                                                                                            15%
                                                $32.31
                       $30                                                                                                                                                             500                                                                     10%
                                                                     $24.90                                   3,000
                                                                                         $22.77                                                                                                                                                                5%
                       $20                                                                                                                                                               0
                                                                                                              2,000                                                                                                                                            0%
                       $10                                                                                    1,000                                                                          2010 Q1   2010 Q2   2010 Q3    2010 Q4   2011 Q1   2011 Q2

                        $-                                                                                    0
                                  Class AAA             Class A             Class B            Class C                                                                   RECENT TRANSACTIONS
                                                                                                                                                                              * The top sale transaction this quarter was 1,079,870 SF for
                                                                                                                                                                              $344,800,000 at 595 Bay Street. The deal closed on June 1st.
Note: Not available office space (light blue) and available office space (dark blue) add up to
the total inventory of office space in the respective building class.                                                                                                         * The top lease transaction this quarter was 180,000 SF at 5550
                                                                                                                                                                              Explorer Drive with Target as the tenant.


18 MONTH TREND                                                                                                                                                           TOP PROJECTS UNDER CONSTRUCTION
                                                                                                                                                                                * GWL Realty Advisors has 644,952 SF under construction at 18 York
                                          Absorption              Vacancy Rate           Asking Net Rent                                                                        Street.
                      2,000                                                                                       18
                                                                                                         $16.04
                      1,800
                                                                                                                              Asking Net Rent ($) / Vacancy Rate (%)


                                                                                                                  16
                      1,600                                                                                       14
                                                                                                                                                                         MARKET CHARACTERISTICS
                      1,400                                                                                                                                                   * The GTA is Canada's largest urban economic region in terms of
                                                                                                                  12                                                          population, economy and size of office market.
Thousands (SF)


                      1,200                                                                                                                                                   * Built on strong foundations that include world-renowned educational and
                                                                                                                  10
                      1,000                                                                                                                                                   health institutions, a diversity of internationally competitive sectors and
                                                                                                                  8                                                           clusters, and a highly-skilled, well-educated and growing population.
                       800                                                                        5.9
                                                                                                                                                                              * GTA includes the City of Toronto and the surrounding 25 regional
                                                                                                                  6                                                           municipalities. 11 municipalities have a population greater than 100,000.
                       600
                                                                                                                                                                              * Over time Toronto & the GTA has maintained its position as Canada's
                       400                                                                                        4
                                                                                                                                                                              financial and industrial center.
                       200                                                                                        2                                                           * Economic strength and dominance of the area is reflected in it's high
                                                                                                                                                                              concentration of corporate headquarters.
                          -                                                                                       0
                                2010 Q1       2010 Q2       2010 Q3        2010 Q4      2011 Q1     2011 Q2

Colliers International, 2011 Q2
Information contained herein has been obtained from the owners or other sources deemed reliable. We have no reason to doubt its accuracy but regret we cannot guarantee it. All
properties subject to change or withdrawal without notice. All numbers reported use the most accurate information available at the time of publishing, however we acknowledge that there
may be marginal changes over time as more accurate information becomes available. Colliers Macaulay Nicolls (Ontario) Inc., Brokerage.
Office Market Dashboard
      Downtown
  2011 Q2
 MARKET SNAPSHOT                                                                                                                                               MAP OF MARKET
                                                            2011 Q1              2011 Q2             Trend
                           Office Inventory*             69,731,115             70,382,021             p
                            Net Absorption                  774,454              791,217               p
                            Vacancy Rate                     5.7%                 4.6%                 q
           Average Asking Net Rent                          $22.82               $23.30                p
                 Average Additional Rent                    $22.87               $23.00                p
 *Office Inventory: For the purpose of this report, buildings with less than 10,000 SF of
 office space and buildings owned and occupied by the government have not been
 included in the office inventory. There are 525 office buildings surveyed in the
 Downtown office region.


 GROSS RENT & AVAILABILITY BY BUILDING CLASS                                                                                                                   AVAILABLE SUPPLY SPLIT
                                 Avail. Office Space        Not Avail. Office Space          Gross Rent                                                                            Sublease Avail      Direct Avail     Sublease % of Total Avail.
                                                                                                                                                                             800                                                                     20%
                     $70                                                                               3,000
                                                                                                                                                                             700                                                                     18%
                     $60 $59.98
                                                                                                                                                                                                                                                     16%
                                                                                                       2,500                                                                 600
                                                                                                                                                                                                                                                     14%
                                                                                                                                                             SF (10,000's)

                                                                                                                                                                             500                                                                     12%
                     $50
                                            $47.23                                                     2,000                                                                 400                                                                     10%
                                                                                                                SF (10,000's)


                                                                                                                                                                                                                                                     8%
  Gross Rent $/SF


                     $40                                                                                                                                                     300
                                                                 $35.76                                1,500                                                                                                                                         6%
                     $30                                                                                                                                                     200
                                                                                  $30.74                                                                                                                                                             4%
                                                                                                       1,000                                                                 100                                                                     2%
                     $20
                                                                                                                                                                               0                                                                     0%
                     $10                                                                               500                                                                         2010 Q1   2010 Q2   2010 Q3    2010 Q4   2011 Q1   2011 Q2

                       $-                                                                              0
                                Class AAA         Class A             Class B           Class C
                                                                                                                                                               RECENT TRANSACTIONS
                                                                                                                                                                       * The top sale transaction this quarter was SF for $103,000,000 at 180
                                                                                                                                                                       Dundas Street West. The deal closed January 25th.
 Note: Not available office space (light blue) and available office space (dark blue) add
 up to the total inventory of office space in the respective building class.                                                                                           * The top lease transaction this quarter was 78,000 SF at 18 York
                                                                                                                                                                       Street. The tenant was SNC Lavilin.


 18 MONTH TREND                                                                                                                                                TOP PROJECTS UNDER CONSTRUCTION
                                                                                                                                                                       * GWL Realty Advisors has 644,952 SF under construction at 18 York
                                        Absorption          Vacancy Rate          Asking Net Rent                                                                      Street.

           1,000                                                                            $23.30         25
                                                                                                                    Asking Net Rent ($) / Vacancy Rate (%)


                    800                                                                                                                                        MARKET CHARACTERISTICS
                                                                                                           20
                                                                                                                                                                    * Submarkets within the Downtown market include: Financial Core,
                    600                                                                                                                                             Downtown East, Downtown North, Downtown South and Downtown West.
Thousands (SF)


                                                                                                           15                                                       * Major Highways to Toronto Submarkets: Highway 400, Highway 401,
                                                                                                                                                                    Highway 427, Don Valley Parkway, Gardner Expressway, Queen Elizabeth
                    400
                                                                                                                                                                    Way.
                                                                                                           10                                                       * Billy Bishop Toronto City Airport is minutes from the Downtown Core and
                    200                                                                                                                                             Financial District.
                                                                                                                                                                    * Public Transit available by TTC bus and subway systems. GO Transit
                                                                                           4.6
                                                                                                           5                                                        network connects Toronto to Peel, York, Durham and Halton Regions via
                       -
                                                                                                                                                                    Bus and Train routes.
                              2010 Q1   2010 Q2        2010 Q3     2010 Q4       2011 Q1     2011 Q2                                                                * Toronto remains the largest business centre in Canada and is home to the
                    -200                                                                                   0                                                        five largest banks, five public research Universities and six community
                                                                                                                                                                    Colleges.

 Colliers International, 2011 Q2
 Information contained herein has been obtained from the owners or other sources deemed reliable. We have no reason to doubt its accuracy but regret we cannot guarantee it. All
 properties subject to change or withdrawal without notice. All numbers reported use the most accurate information available at the time of publishing, however we acknowledge that
 there may be marginal changes over time as more accurate information becomes available. Colliers Macaulay Nicolls (Ontario) Inc., Brokerage.
Office Submarket Dashboard
  Financial Core
2011 Q2
SUBMARKET SNAPSHOT                                                                                                                                               MAP OF MARKET
                                                        2011 Q1                2011 Q2             Trend
                      Office Inventory*                33,631,324          33,618,409              q
                          Net Absorption                   454,190             464,522             p
                          Vacancy Rate                      6.3%                5.2%               q
      Average Asking Net Rent                              $26.00              $26.30              p
         Average Additional Rent                           $28.28              $27.89              q
*Office Inventory: For the purpose of this report, buildings with less than 10,000 SF of
office space and buildings owned and occupied by the government have not been
included in the office inventory. There are 109 office buildings surveyed in the
Financial Core office region.


GROSS RENT & AVAILABILITY BY BUILDING CLASS                                                                                                                      AVAILABLE SUPPLY SPLIT
                               Avail. Office Space         Not Avail. Office Space         Gross Rent                                                                                Sublease Avail      Direct Avail     Sublease % of Total Avail.
                                                                                                                                                                               500                                                                     50%
                   $70                                                                                  1,400
                                                                                                                                                                               450                                                                     45%
                   $60 $59.98                                                                           1,200
                                                                                                                                                                               400                                                                     40%
                                                                                                                                                                               350                                                                     35%
                                                                                                                                                               SF (10,000's)

                                           $52.73                                                                                                                              300                                                                     30%
                   $50                                                                                  1,000
                                                                                                                                                                               250                                                                     25%
                                                                                                             SF (10,000's)


                                                                                                                                                                               200                                                                     20%
 Gross Rent $/SF


                   $40                                         $40.75                                   800
                                                                                 $37.75
                                                                                                                                                                               150                                                                     15%
                   $30                                                                                  600                                                                    100                                                                     10%
                                                                                                                                                                                50                                                                     5%
                   $20                                                                                  400
                                                                                                                                                                                 0                                                                     0%
                   $10                                                                                  200                                                                          2010 Q1   2010 Q2   2010 Q3    2010 Q4   2011 Q1   2011 Q2

                     $-                                                                                 0
                              Class AAA          Class A             Class B             Class C
                                                                                                                                                                 RECENT TRANSACTIONS
                                                                                                                                                                        * No sale transactions were recorded during this period.

Note: Not available office space (light blue) and available office space (dark blue) add                                                                                * The top lease transaction this quarter was 27,500 SF at 181 Bay
up to the total inventory of office space in the respective building class.                                                                                             Street. The tenant was Global Prime Office.


18 MONTH TREND                                                                                                                                                   TOP PROJECTS UNDER CONSTRUCTION
                                                                                                                                                                         * No under construction projects recorded during this period.
                                      Absorption           Vacancy Rate         Asking Net Rent

                   600                                                                                   30
                                                                                                                      Asking Net Rent ($) / Vacancy Rate (%)


                   500                                                                    $26.30         25                                                      SUBMARKET CHARACTERISTICS
                                                                                                                                                                      * The Financial Core is the most dense office submarket in the GTA, with
                   400                                                                                   20                                                           one of the lowest vacancy rates.
Thousands (SF)


                                                                                                                                                                      * GTA top annual rental rates are located in buildings in this market.
                   300                                                                                   15
                                                                                                                                                                      * Prestige urban location and modern, state-of-the-art architecture.
                   200                                                                                   10
                                                                                                                                                                      * Limited parking, but great access to public transit and the PATH system
                                                                                          5.2                                                                         (Toronto's underground walkway).
                   100                                                                                   5
                                                                                                                                                                      * Proximity to multiple amenities and services are convenient for employees
                                                                                                                                                                      and customers.
                     -                                                                                   0
                            2010 Q1    2010 Q2       2010 Q3     2010 Q4       2011 Q1      2011 Q2

Colliers International, 2011 Q2
Information contained herein has been obtained from the owners or other sources deemed reliable. We have no reason to doubt its accuracy but regret we cannot guarantee it. All
properties subject to change or withdrawal without notice. All numbers reported use the most accurate information available at the time of publishing, however we acknowledge that
there may be marginal changes over time as more accurate information becomes available. Colliers Macaulay Nicolls (Ontario) Inc., Brokerage.
Office Submarket Dashboard
 Downtown East
2011 Q2
SUBMARKET SNAPSHOT                                                                                                                                                                  MAP OF MARKET
                                                                  2011 Q1            2011 Q2                 Trend
                                Office Inventory*                3,980,709           3,924,812               q
                                    Net Absorption                 60,116             98,743                 p
                                    Vacancy Rate                    6.0%               6.7%                  p
      Average Asking Net Rent                                      $18.19             $18.76                 p
         Average Additional Rent                                   $9.94              $10.45                 p
*Office Inventory: For the purpose of this report, buildings with less than 10,000 SF of
office space and buildings owned and occupied by the government have not been
included in the office inventory. There are 110 office buildings surveyed in the
Downtown East office region.


GROSS RENT & AVAILABILITY BY BUILDING CLASS                                                                                                                                         AVAILABLE SUPPLY SPLIT
                                         Avail. Office Space       Not Avail. Office Space        Gross Rent                                                                                           Sublease Avail      Direct Avail     Sublease % of Total Avail.
                                                                                                                                                                                                  60                                                                     12%
                   $40                                                                                           250
                                       $35.53                                                                                                                                                     50                                                                     10%
                   $35
                                                               $31.82                                            200                                                                              40                                                                     8%
                                                                                                                                                                                  SF (10,000's)

                   $30

                   $25                                                                                                                                                                            30                                                                     6%
                                                                                      $24.13                     150
                                                                                                                         SF (10,000's)
 Gross Rent $/SF


                   $20                                                                                                                                                                            20                                                                     4%

                   $15                                                                                           100                                                                              10                                                                     2%

                   $10                                                                                                                                                                            0                                                                      0%
                                                                                                                 50
                          $5
                                                                                                                                                                                                       2010 Q1   2010 Q2   2010 Q3    2010 Q4   2011 Q1   2011 Q2

                               $-                                                                                0
                                            Class A                 Class B                  Class C
                                                                                                                                                                                    RECENT TRANSACTIONS
                                                                                                                                                                                         * No sale transactions were recorded during this period.

Note: Not available office space (light blue) and available office space (dark blue) add                                                                                                 * The top lease transaction this quarter was 14,000 SF at 143 Lake
up to the total inventory of office space in the respective building class.                                                                                                              Shore Blvd East. The deal closed May 12th.


18 MONTH TREND                                                                                                                                                                      TOP PROJECTS UNDER CONSTRUCTION
                                                                                                                                                                                            * No under construction projects recorded during this period.
                                                 Absorption         Vacancy Rate        Asking Net Rent

                     150                                                                          $18.76             20
                                                                                                                     18
                                                                                                                                         Asking Net Rent ($) / Vacancy Rate (%)


                     100
                                                                                                                     16                                                             SUBMARKET CHARACTERISTICS
                               50                                                                                    14                                                                  * Public Transit available by TTC bus and subway systems. GO Transit network
                                                                                                                                                                                         connects Toronto to Peel, York, Durham and Halton Regions via Bus and Train
              Thousands (SF)


                                                                                                                     12                                                                  routes.
                                -
                                       2010 Q1    2010 Q2      2010 Q3     2010 Q4     2011 Q1         2011 Q2       10                                                                  * VIA Rail, Amtrak and Ontario Northlands rail service from Union Station.
                        -50                                                                                                                                                              * Billy Bishop Toronto City Airport is minutes from the Downtown Core.
                                                                                                       6.7           8                                                                   * Major Highways to Downtown East Submarket: Gardiner Expressway and Don
                   -100                                                                                              6                                                                   Valley Parkway.
                                                                                                                                                                                         * The original 10 blocks of Toronto are located within this submarket, making it
                                                                                                                     4
                                                                                                                                                                                         home to many historical brick and beam buildings.
                   -150
                                                                                                                     2                                                                   * Top Industries in Downtown East include: Business Services, Finance, Insurance
                                                                                                                                                                                         and Real Estate, Information and Cultural Industries.
                   -200                                                                                              0


Colliers International, 2011 Q2
Information contained herein has been obtained from the owners or other sources deemed reliable. We have no reason to doubt its accuracy but regret we cannot guarantee it. All
properties subject to change or withdrawal without notice. All numbers reported use the most accurate information available at the time of publishing, however we acknowledge that
there may be marginal changes over time as more accurate information becomes available. Colliers Macaulay Nicolls (Ontario) Inc., Brokerage.
Office Submarket Dashboard
 Downtown North
2011 Q2
SUBMARKET SNAPSHOT                                                                                                                                             MAP OF MARKET
                                                            2011 Q1           2011 Q2                 Trend
                          Office Inventory*                14,723,534        14,718,459               q
                              Net Absorption                 89,380           59,639                  q
                              Vacancy Rate                    3.4%             3.1%                   q
      Average Asking Net Rent                                $18.32           $19.65                  p
         Average Additional Rent                             $19.54           $19.70                  p
*Office Inventory: For the purpose of this report, buildings with less than 10,000 SF of
office space and buildings owned and occupied by the government have not been
included in the office inventory. There are 74 office buildings surveyed in the
Downtown North office region.


GROSS RENT & AVAILABILITY BY BUILDING CLASS                                                                                                                    AVAILABLE SUPPLY SPLIT
                                   Avail. Office Space       Not Avail. Office Space        Gross Rent                                                                            Sublease Avail      Direct Avail     Sublease % of Total Avail.
                                                                                                                                                                             80                                                                     50%
                   $44                                                                                   700
                                                                                                                                                                             70                                                                     45%
                                 $43.02
                                                                                                         600
                                                                                                                                                                                                                                                    40%
                   $42                                                                                                                                                       60
                                                                                                                                                                                                                                                    35%
                                                                                                                                                             SF (10,000's)

                                                                                                                                                                             50                                                                     30%
                                                                                                         500
                   $40                                                                                                                                                       40                                                                     25%
                                                                                                              SF (10,000's)


                                                                                                                                                                                                                                                    20%
 Gross Rent $/SF


                                                                                                         400                                                                 30
                   $38                                                                                                                                                                                                                              15%
                                                                                                         300                                                                 20
                                                                                                                                                                                                                                                    10%
                   $36                                                                                                                                                       10                                                                     5%
                                                         $36.16               $35.88                     200
                                                                                                                                                                             0                                                                      0%
                   $34                                                                                   100                                                                      2010 Q1   2010 Q2   2010 Q3    2010 Q4   2011 Q1   2011 Q2

                   $32                                                                                   0
                                      Class A                 Class B                  Class C
                                                                                                                                                               RECENT TRANSACTIONS
                                                                                                                                                                * The top sale transaction this quarter was 1,079,870 SF for
                                                                                                                                                                $344,800,000 at 595 Bay Street. The deal closed June 1st.
Note: Not available office space (light blue) and available office space (dark blue) add
up to the total inventory of office space in the respective building class.                                                                                     * No lease transactions were recorded during this period.


18 MONTH TREND                                                                                                                                                 TOP PROJECTS UNDER CONSTRUCTION
                                                                                                                                                                       * No under construction projects recorded during this period.
                                          Absorption         Vacancy Rate       Asking Net Rent

                   100                                                                                   20
                                                                                             $18.07
                      80                                                                                 18
                                                                                                                    Asking Net Rent ($) / Vacancy Rate (%)


                                                                                                                                                               SUBMARKET CHARACTERISTICS
                      60                                                                                 16
                                                                                                                                                                    * Public Transit available by TTC bus and subway systems. GO Transit network
                      40                                                                                 14                                                         connects Toronto to Peel, York, Durham and Halton Regions via Bus and Train
         Thousands (SF)


                      20                                                                                 12                                                         routes.
                                                                                                                                                                    * VIA Rail, Amtrak and Ontario Northlands rail service from Union Station.
                          -                                                                              10
                                                                                                                                                                    Billy Bishop Toronto City Airport is minutes from the Downtown Core.
                   -20          2010 Q1    2010 Q2       2010 Q3   2010 Q4    2011 Q1       2011 Q2      8                                                          * Major Highway to Downtown North Submarket: Don Valley Parkway.
                   -40                                                                                   6                                                          * Bordering the Financial Core, amenities within the Downtown North submarket
                                                                                                                                                                    include Provincial Courts, the Toronto Eaton Centre and the Toronto Discovery
                   -60                                                                       3.1         4                                                          District research park.
                   -80                                                                                   2                                                          * Top Employers include: Rogers Telecommunication, Royal Bank of Canada, Bank
                                                                                                                                                                    of Montreal, and Ontario Power Generation.
             -100                                                                                        0
                                                                                                                                                                    * Top Industries in Downtown North include: Finance, Insurance and Real Estate,
                                                                                                                                                                    Public Administration and Business Services.

Colliers International, 2011 Q2
Information contained herein has been obtained from the owners or other sources deemed reliable. We have no reason to doubt its accuracy but regret we cannot guarantee it. All
properties subject to change or withdrawal without notice. All numbers reported use the most accurate information available at the time of publishing, however we acknowledge that
there may be marginal changes over time as more accurate information becomes available. Colliers Macaulay Nicolls (Ontario) Inc., Brokerage.
Office Submarket Dashboard
 Downtown South
2011 Q2
SUBMARKET SNAPSHOT                                                                                                                                            MAP OF MARKET
                                                             2011 Q1          2011 Q2               Trend
                           Office Inventory*                 3,087,471        3,815,463                p
                               Net Absorption                 12,995           65,526                  p
                               Vacancy Rate                    7.1%             5.0%                   q
      Average Asking Net Rent                                 $15.00           $22.02                  p
         Average Additional Rent                              $13.16           $18.08                  p
*Office Inventory: For the purpose of this report, buildings with less than 10,000 SF of
office space and buildings owned and occupied by the government have not been
included in the office inventory. There are 18 office buildings surveyed in the
Downtown South office region.


GROSS RENT & AVAILABILITY BY BUILDING CLASS                                                                                                                   AVAILABLE SUPPLY SPLIT
                                    Avail. Office Space       Not Avail. Office Space        Gross Rent                                                                          Sublease Avail      Direct Avail     Sublease % of Total Avail.
                                                                                                                                                                            40                                                                     90%
                   $60                                                                                    250
                                                                                                                                                                            35                                                                     80%
                                  $53.90                                                                                                                                                                                                           70%
                   $50                                                                                                                                                      30
                                                                                                          200                                                                                                                                      60%
                                                                                                                                                            SF (10,000's)

                                                                                                                                                                            25
                   $40                                                                                                                                                                                                                             50%
                                                                                                                                                                            20
                                                                                                          150                                                                                                                                      40%
                                                                                                               SF (10,000's)
 Gross Rent $/SF


                                                                                                                                                                            15
                   $30                                                                                                                                                                                                                             30%
                                                          $29.31
                                                                                                                                                                            10                                                                     20%
                                                                                                          100
                   $20                                                                                                                                                      5                                                                      10%
                                                                                $18.82
                                                                                                                                                                            0                                                                      0%
                                                                                                          50
                   $10                                                                                                                                                           2010 Q1   2010 Q2   2010 Q3    2010 Q4   2011 Q1   2011 Q2

                          $-                                                                              0
                                       Class A                 Class B                  Class C
                                                                                                                                                              RECENT TRANSACTIONS
                                                                                                                                                                * No sale transactions were recorded during this period.

Note: Not available office space (light blue) and available office space (dark blue) add                                                                        * The top lease transaction this quarter was 78,000 SF at 18 York Street.
up to the total inventory of office space in the respective building class.                                                                                     The tenant was SNC Lavilin.


18 MONTH TREND                                                                                                                                                TOP PROJECTS UNDER CONSTRUCTION
                                                                                                                                                                      * GWL Realty Advisors has 644,952 SF under construction at 18 York
                                                                                                                                                                      Street.
                                           Absorption         Vacancy Rate      Asking Net Rent

                   500                                                                                    25
                                                                                                                   Asking Net Rent ($) / Vacancy Rate (%)


                   400                                                                     $22.02                                                             SUBMARKET CHARACTERISTICS
                                                                                                          20
                                                                                                                                                                   * Public Transit available by TTC bus and subway systems. GO Transit network
                   300                                                                                                                                             connects Toronto to Peel, York, Durham and Halton Regions via Bus and Train
         Thousands (SF)


                                                                                                          15                                                       routes.
                                                                                                                                                                   * VIA Rail, Amtrak and Ontario Northlands rail service from Union Station.
                   200
                                                                                                                                                                   * Billy Bishop Toronto City Airport is minutes from the Downtown Core.
                                                                                                          10                                                       * Major Highway to Downtown South Submarket: Gardiner Expressway.
                   100                                                                                                                                             * Significant Office developments south of Union Station are redefining the
                                                                                              5.0                                                                  boundaries of the Financial Core.
                                                                                                          5                                                        * New facilities include: Corus Entertainment Headquarters, George Brown
                          -
                                                                                                                                                                   College Waterfront Campus.
                                 2010 Q1   2010 Q2        2010 Q3   2010 Q4    2011 Q1       2011 Q2
                                                                                                                                                                   * Top Industries in Downtown South include: Finance, Insurance and Real Estate,
             -100                                                                                         0                                                        Business Services, Information and Cultural Industries.


Colliers International, 2011 Q2
Information contained herein has been obtained from the owners or other sources deemed reliable. We have no reason to doubt its accuracy but regret we cannot guarantee it. All
properties subject to change or withdrawal without notice. All numbers reported use the most accurate information available at the time of publishing, however we acknowledge that
there may be marginal changes over time as more accurate information becomes available. Colliers Macaulay Nicolls (Ontario) Inc., Brokerage.
Office Submarket Dashboard
 Downtown West
2011 Q2
SUBMARKET SNAPSHOT                                                                                                                                     MAP OF MARKET
                                                       2011 Q1           2011 Q2              Trend
                     Office Inventory*                14,308,077        14,304,878               q
                         Net Absorption                 157,774          102,788                 q
                         Vacancy Rate                    6.1%             4.0%                   q
      Average Asking Net Rent                           $17.91           $18.07                  p
         Average Additional Rent                        $14.50           $15.03                  p
*Office Inventory: For the purpose of this report, buildings with less than 10,000 SF of
office space and buildings owned and occupied by the government have not been
included in the office inventory. There are 214 office buildings surveyed in the
Downtown West office region.


GROSS RENT & AVAILABILITY BY BUILDING CLASS                                                                                                            AVAILABLE SUPPLY SPLIT
                              Avail. Office Space       Not Avail. Office Space        Gross Rent                                                                          Sublease Avail      Direct Avail     Sublease % of Total Avail.
                                                                                                                                                                     160                                                                     25%
                   $35                                                                              900
                                                                                                                                                                     140
                   $34                              $33.75                                          800                                                                                                                                      20%
                            $33.38                                                                                                                                   120
                   $33
                                                                                                                                                     SF (10,000's)

                                                                                                    700
                                                                                                                                                                     100                                                                     15%
                   $32
                                                                                                    600                                                               80
                   $31
                                                                                                         SF (10,000's)


                                                                                                                                                                                                                                             10%
 Gross Rent $/SF


                                                                                                    500                                                               60
                   $30
                                                                                                    400                                                               40
                   $29                                                                                                                                                                                                                       5%
                                                                          $28.48                    300                                                               20
                   $28
                                                                                                                                                                       0                                                                     0%
                   $27                                                                              200
                                                                                                                                                                           2010 Q1   2010 Q2   2010 Q3    2010 Q4   2011 Q1   2011 Q2
                   $26                                                                              100
                   $25                                                                              0
                                 Class A                 Class B                  Class C
                                                                                                                                                       RECENT TRANSACTIONS
                                                                                                                                                            * The top sale transaction this quarter was 3,500 SF for $1,360,000 at
                                                                                                                                                            123 John Street. The deal closed on March 31st. .
Note: Not available office space (light blue) and available office space (dark blue) add
up to the total inventory of office space in the respective building class.                                                                                 * The top lease transaction this quarter was 26,000 SF at 155 Wellington
                                                                                                                                                            Street West. The tenant is Paliare Roland.


18 MONTH TREND                                                                                                                                         TOP PROJECTS UNDER CONSTRUCTION
                                                                                                                                                               * No under construction projects recorded during this period.
                                     Absorption         Vacancy Rate      Asking Net Rent

                   200                                                                              20
                                                                                                    18
                                                                                                            Asking Net Rent ($) / Vacancy Rate (%)


                                                                                     $18.07
                   150                                                                              16                                                 SUBMARKET CHARACTERISTICS
                                                                                                                                                            * Offering many downtown location advantages, but at lower rental prices
                                                                                                    14
                                                                                                                                                            than in the Financial Core .
 Thousands (SF)


                   100                                                                              12                                                      * This submarket is an excellent option for those tenants whose operations
                                                                                                                                                            do not require a core location.
                                                                                                    10
                                                                                                                                                            * Well connected to public transit (streetcars along King Street W and
                    50                                                                              8                                                       Queen Street W) and to the Gardiner Expressway, making this submarket
                                                                                                                                                            accessible to employees and customers.
                                                                                                    6
                                                                                                                                                            * With many new residential high-rise developments (e.g. Concord City
                                                                                     4.0
                     -                                                                              4                                                       Place), the labour pool will increase and diversify.
                           2010 Q1   2010 Q2        2010 Q3   2010 Q4    2011 Q1       2011 Q2                                                              * Many former factory buildings (brick & beam) have been converted into
                                                                                                    2                                                       office buildings, specifically hosting the Information Technology, Art and
                   -50                                                                              0                                                       Design Industry.


Colliers International, 2011 Q2
Information contained herein has been obtained from the owners or other sources deemed reliable. We have no reason to doubt its accuracy but regret we cannot guarantee it. All
properties subject to change or withdrawal without notice. All numbers reported use the most accurate information available at the time of publishing, however we acknowledge that
there may be marginal changes over time as more accurate information becomes available. Colliers Macaulay Nicolls (Ontario) Inc., Brokerage.
Office Market Dashboard
 Midtown
2011 Q2
SUBMARKET SNAPSHOT                                                                                                                                       MAP OF MARKET
                                                       2011 Q1           2011 Q2              Trend
                     Office Inventory*                18,300,645        18,232,300               q
                         Net Absorption                153,787           153,463                 q
                         Vacancy Rate                    4.8%             4.7%                   q
      Average Asking Net Rent                           $15.56           $15.90                  p
         Average Additional Rent                        $18.66           $18.35                  q
*Office Inventory: For the purpose of this report, buildings with less than 10,000 SF of
office space and buildings owned and occupied by the government have not been
included in the office inventory. There are 213 office buildings surveyed in the Midtown
office region.


GROSS RENT & AVAILABILITY BY BUILDING CLASS                                                                                                              AVAILABLE SUPPLY SPLIT
                              Avail. Office Space       Not Avail. Office Space        Gross Rent                                                                            Sublease Avail      Direct Avail     Sublease % of Total Avail.
                                                                                                                                                                       250                                                                     50%
                   $45                                                                              1,200
                                                                                                                                                                                                                                               45%
                   $40      $41.40                                                                                                                                     200                                                                     40%
                                                                                                    1,000                                                                                                                                      35%
                                                                                                                                                       SF (10,000's)

                   $35
                                                    $33.85                                                                                                             150                                                                     30%
                   $30                                                                              800                                                                                                                                        25%
                                                                          $28.76
                                                                                                         SF (10,000's)


                                                                                                                                                                       100                                                                     20%
 Gross Rent $/SF


                   $25
                                                                                                    600                                                                                                                                        15%
                   $20
                                                                                                                                                                        50                                                                     10%
                   $15                                                                              400                                                                                                                                        5%
                                                                                                                                                                         0                                                                     0%
                   $10
                                                                                                    200                                                                      2010 Q1   2010 Q2   2010 Q3    2010 Q4   2011 Q1   2011 Q2
                    $5
                    $-                                                                              0
                                 Class A                 Class B                  Class C
                                                                                                                                                         RECENT TRANSACTIONS
                                                                                                                                                             * The top sale transaction this quarter was 64,575 SF for $12,601,000 at
                                                                                                                                                             161 Eglinton Avenue East. The deal closed June 7th.
Note: Not available office space (light blue) and available office space (dark blue) add
up to the total inventory of office space in the respective building class.                                                                                  * No major lease transactions were recorded during this period.


18 MONTH TREND                                                                                                                                           TOP PROJECTS UNDER CONSTRUCTION
                                                                                                                                                                 * No under construction projects recorded during this period.
                                     Absorption         Vacancy Rate       Asking Net Rent

                   200                                                                              18
                                                                                                              Asking Net Rent ($) / Vacancy Rate (%)


                                                                                                    16
                   150                                                               $15.90                                                              SUBMARKET CHARACTERISTICS
                                                                                                    14
                                                                                                                                                              * Submarkets within the Midtown Market include: Toronto West, Yonge &
                   100                                                                              12                                                        Bloor, Yonge & St. Clair and Yonge & Eglinton.
  Thousands (SF)


                                                                                                                                                              * Public Transit available by TTC bus and subway systems. GO Transit
                                                                                                    10                                                        network connects Toronto to Peel, York, Durham and Halton Regions via
                    50                                                                                                                                        Bus and Train routes.
                                                                                                    8
                                                                                                                                                              * Major Highways to Midtown Market: Highway 401 and Don Valley
                     -                                                                              6                                                         Parkway.
                                                                                        4.7
                                                                                                                                                              * Major Corporations in the market include: RioCan, Canadian Tire, Toronto
                           2010 Q1    2010 Q2       2010 Q3   2010 Q4    2011 Q1       2011 Q2
                                                                                                    4                                                         Transit Commission (TTC) and Desjardins Credit Union.
                   -50                                                                                                                                        * Top Industries in the Midtown Market include: Business Services,
                                                                                                    2
                                                                                                                                                              Finance, Insurance and Real Estate and Public Administration.
              -100                                                                                  0


Colliers International, 2011 Q2
Information contained herein has been obtained from the owners or other sources deemed reliable. We have no reason to doubt its accuracy but regret we cannot guarantee it. All
properties subject to change or withdrawal without notice. All numbers reported use the most accurate information available at the time of publishing, however we acknowledge that
there may be marginal changes over time as more accurate information becomes available. Colliers Macaulay Nicolls (Ontario) Inc., Brokerage.
Office Submarket Dashboard
 Yonge - Bloor
2011 Q2
MARKET SNAPSHOT                                                                                                                                           MAP OF MARKET
                                                        2011 Q1          2011 Q2                Trend
                     Office Inventory*                 9,659,332         9,633,002               q
                         Net Absorption                  61,748           40,969                 q
                          Vacancy Rate                    3.8%             4.0%                  p
      Average Asking Net Rent                           $16.71            $17.51                 p
         Average Additional Rent                        $19.95            $19.39                 q
*Office Inventory: For the purpose of this report, buildings with less than 10,000 SF of
office space and buildings owned and occupied by the government have not been
included in the office inventory. There are 74 office buildings surveyed in the Yonge-
Bloor office region.


GROSS RENT & AVAILABILITY BY BUILDING CLASS                                                                                                               AVAILABLE SUPPLY SPLIT
                               Avail. Office Space      Not Avail. Office Space        Gross Rent                                                                            Sublease Avail      Direct Avail     Sublease % of Total Avail.
                                                                                                                                                                        70                                                                     50%
                   $45                                                                               600
                             $42.83                                                                                                                                                                                                            45%
                                                                                                                                                                        60
                   $40                                                                                                                                                                                                                         40%
                                                                                                     500                                                                50                                                                     35%
                                                     $36.20
                                                                                                                                                        SF (10,000's)

                   $35
                                                                                                                                                                        40                                                                     30%
                   $30                                                    $30.59                     400                                                                                                                                       25%
                                                                                                                                                                        30
                                                                                                          SF (10,000's)


                                                                                                                                                                                                                                               20%
 Gross Rent $/SF


                   $25
                                                                                                     300                                                                20                                                                     15%
                   $20
                                                                                                                                                                                                                                               10%
                                                                                                                                                                        10
                   $15                                                                               200                                                                                                                                       5%
                                                                                                                                                                        0                                                                      0%
                   $10
                                                                                                     100                                                                     2010 Q1   2010 Q2   2010 Q3    2010 Q4   2011 Q1   2011 Q2
                    $5
                    $-                                                                               0
                                  Class A                 Class B                 Class C
                                                                                                                                                          RECENT TRANSACTIONS
                                                                                                                                                                  * The top sale transaction this quarter was 5,176 SF for $1,800,000 at
                                                                                                                                                                  133 Lowther Avenue. The deal closed June 20th.
Note: Not available office space (light blue) and available office space (dark blue) add
up to the total inventory of office space in the respective building class.                                                                                       * No lease transactions were recorded during this period.


18 MONTH TREND                                                                                                                                            TOP PROJECTS UNDER CONSTRUCTION
                                                                                                                                                                  * No under construction projects recorded during this period.
                                       Absorption        Vacancy Rate      Asking Net Rent

                    70                                                                               20
                                                                                            $17.51   18
                                                                                                               Asking Net Rent ($) / Vacancy Rate (%)


                    60
                                                                                                     16
                                                                                                                                                          MARKET CHARACTERISTICS
                    50
                                                                                                                                                               * Public Transit available by TTC bus and subway systems. GO Transit network
                                                                                                     14
                    40                                                                                                                                         connects Toronto to Peel, York, Durham and Halton Regions via Bus and Train
  Thousands (SF)


                                                                                                     12                                                        routes.
                    30
                                                                                                     10
                                                                                                                                                               * Largest Midtown Office Submarket in terms of Total Inventory and Occupied
                    20                                                                                                                                         Space.
                                                                                                     8                                                         * Major Highway to Yonge-Bloor Submarket: Don Valley Parkway.
                    10                                                                                                                                         * Labour pool intensification as a result of many new high-rise residential
                                                                                                     6
                                                                                        4.0                                                                    developments in the Submarket.
                         -                                                                           4                                                         * Top Employers include: TD Waterhouse, Bank of Montreal, Royal Bank of
                             2010 Q1    2010 Q2      2010 Q3   2010 Q4    2011 Q1      2011 Q2
                    -10                                                                              2                                                         Canada and Hudson Bay Company.
                                                                                                                                                               * Top Industries in the Yonge-Bloor Submarket include: Finance, Insurance and
                    -20                                                                              0
                                                                                                                                                               Real Estate, Business Services and Information and Cultural Industries.


Colliers International, 2011 Q2
Information contained herein has been obtained from the owners or other sources deemed reliable. We have no reason to doubt its accuracy but regret we cannot guarantee it. All
properties subject to change or withdrawal without notice. All numbers reported use the most accurate information available at the time of publishing, however we acknowledge that
there may be marginal changes over time as more accurate information becomes available. Colliers Macaulay Nicolls (Ontario) Inc., Brokerage.
Office market dashboard 2011 q2   central

Mais conteúdo relacionado

Mais procurados

southwest airline ar01
southwest airline ar01southwest airline ar01
southwest airline ar01finance40
 
autozone AZO_03AR
autozone  AZO_03ARautozone  AZO_03AR
autozone AZO_03ARfinance46
 
southwest airline ar02
southwest airline ar02southwest airline ar02
southwest airline ar02finance40
 
williams 2007 AR
williams  2007 ARwilliams  2007 AR
williams 2007 ARfinance21
 
Arvinmeritor2001 Annua lReport
Arvinmeritor2001 Annua lReportArvinmeritor2001 Annua lReport
Arvinmeritor2001 Annua lReportfinance27
 
Big_Lots_AR2004
Big_Lots_AR2004Big_Lots_AR2004
Big_Lots_AR2004finance50
 
fiserv annual reports 2004
fiserv annual reports 2004fiserv annual reports 2004
fiserv annual reports 2004finance47
 
an1999 auto nation
an1999 auto nationan1999 auto nation
an1999 auto nationfinance14
 
Marketing Automation ROI Calculator
Marketing Automation ROI CalculatorMarketing Automation ROI Calculator
Marketing Automation ROI CalculatorDemand Metric
 
whirlpool Annual Report2005
whirlpool Annual Report2005whirlpool Annual Report2005
whirlpool Annual Report2005finance13
 
Melbourne IT FY 2011 Investor Presentation
Melbourne IT FY 2011 Investor PresentationMelbourne IT FY 2011 Investor Presentation
Melbourne IT FY 2011 Investor PresentationMelbourne IT
 
Big_Lots_AR2005
Big_Lots_AR2005Big_Lots_AR2005
Big_Lots_AR2005finance50
 
Attribution Case Study (Detailed) | Encore Media Metrics
Attribution Case Study (Detailed) | Encore Media MetricsAttribution Case Study (Detailed) | Encore Media Metrics
Attribution Case Study (Detailed) | Encore Media MetricsEncore Media Metrics
 
Attribution Case Study - Ad-Tech Presentation
Attribution Case Study - Ad-Tech Presentation Attribution Case Study - Ad-Tech Presentation
Attribution Case Study - Ad-Tech Presentation Encore Media Metrics
 

Mais procurados (16)

southwest airline ar01
southwest airline ar01southwest airline ar01
southwest airline ar01
 
autozone AZO_03AR
autozone  AZO_03ARautozone  AZO_03AR
autozone AZO_03AR
 
southwest airline ar02
southwest airline ar02southwest airline ar02
southwest airline ar02
 
williams 2007 AR
williams  2007 ARwilliams  2007 AR
williams 2007 AR
 
Arvinmeritor2001 Annua lReport
Arvinmeritor2001 Annua lReportArvinmeritor2001 Annua lReport
Arvinmeritor2001 Annua lReport
 
Big_Lots_AR2004
Big_Lots_AR2004Big_Lots_AR2004
Big_Lots_AR2004
 
fiserv annual reports 2004
fiserv annual reports 2004fiserv annual reports 2004
fiserv annual reports 2004
 
Corporate Presentation
Corporate PresentationCorporate Presentation
Corporate Presentation
 
an1999 auto nation
an1999 auto nationan1999 auto nation
an1999 auto nation
 
Nexus Spring 2001
Nexus Spring 2001Nexus Spring 2001
Nexus Spring 2001
 
Marketing Automation ROI Calculator
Marketing Automation ROI CalculatorMarketing Automation ROI Calculator
Marketing Automation ROI Calculator
 
whirlpool Annual Report2005
whirlpool Annual Report2005whirlpool Annual Report2005
whirlpool Annual Report2005
 
Melbourne IT FY 2011 Investor Presentation
Melbourne IT FY 2011 Investor PresentationMelbourne IT FY 2011 Investor Presentation
Melbourne IT FY 2011 Investor Presentation
 
Big_Lots_AR2005
Big_Lots_AR2005Big_Lots_AR2005
Big_Lots_AR2005
 
Attribution Case Study (Detailed) | Encore Media Metrics
Attribution Case Study (Detailed) | Encore Media MetricsAttribution Case Study (Detailed) | Encore Media Metrics
Attribution Case Study (Detailed) | Encore Media Metrics
 
Attribution Case Study - Ad-Tech Presentation
Attribution Case Study - Ad-Tech Presentation Attribution Case Study - Ad-Tech Presentation
Attribution Case Study - Ad-Tech Presentation
 

Semelhante a Office market dashboard 2011 q2 central

Brazil Market Managed Services Trend
Brazil Market Managed Services TrendBrazil Market Managed Services Trend
Brazil Market Managed Services TrendMichel Abranches
 
Current Financial Situation in Latvia
Current Financial Situation in LatviaCurrent Financial Situation in Latvia
Current Financial Situation in LatviaRoberts Zīle
 
Procurement Spending in the DC Region
Procurement Spending in the DC RegionProcurement Spending in the DC Region
Procurement Spending in the DC Regionkottmeier
 
Puget Sound Q4 2012 Office Market
Puget Sound Q4 2012 Office MarketPuget Sound Q4 2012 Office Market
Puget Sound Q4 2012 Office MarketGilWhiteCRE
 
Budget Forecast Project
Budget Forecast ProjectBudget Forecast Project
Budget Forecast Projectdavisdemers
 
What the World Environment Might Look Like in 2050 and What We Can do About It
What the World Environment Might Look Like in 2050 and What We Can do About ItWhat the World Environment Might Look Like in 2050 and What We Can do About It
What the World Environment Might Look Like in 2050 and What We Can do About ItEnvironmental Protection Agency, Ireland
 
We are alive! Now what? by Kārlis Cērbulis
We are alive! Now what? by Kārlis CērbulisWe are alive! Now what? by Kārlis Cērbulis
We are alive! Now what? by Kārlis CērbulisRoberts Zīle
 
U ti investorday2011-freightforwarding
U ti investorday2011-freightforwardingU ti investorday2011-freightforwarding
U ti investorday2011-freightforwardingFrankie Coki
 
Raddon Chart of the Day, December 20, 2011
Raddon Chart of the Day, December 20, 2011Raddon Chart of the Day, December 20, 2011
Raddon Chart of the Day, December 20, 2011Raddon Financial Group
 
Stormwater Financing Mechanisms- Charlotte Katzenmoyer
Stormwater Financing Mechanisms- Charlotte KatzenmoyerStormwater Financing Mechanisms- Charlotte Katzenmoyer
Stormwater Financing Mechanisms- Charlotte KatzenmoyerCleanH2O
 
Us Private Equity Index Slides
Us Private Equity Index SlidesUs Private Equity Index Slides
Us Private Equity Index SlidesJorge Braga
 
Alan Garber: The quest for efficiency in the English NHS
Alan Garber: The quest for efficiency in the English NHSAlan Garber: The quest for efficiency in the English NHS
Alan Garber: The quest for efficiency in the English NHSNuffield Trust
 
Lori Jacobwith Engage Your Board HFH March2011
Lori Jacobwith Engage Your Board HFH March2011Lori Jacobwith Engage Your Board HFH March2011
Lori Jacobwith Engage Your Board HFH March2011Ignited Fundraising
 
Q4 11 office midtown - yonge-bloor dashboard
Q4 11 office midtown - yonge-bloor dashboardQ4 11 office midtown - yonge-bloor dashboard
Q4 11 office midtown - yonge-bloor dashboardChris Fyvie
 
CDON Group Q1 2011 Financial Results
CDON Group Q1 2011 Financial ResultsCDON Group Q1 2011 Financial Results
CDON Group Q1 2011 Financial ResultsQliro Group AB
 
R&D Operations Cost 2010
R&D Operations Cost 2010R&D Operations Cost 2010
R&D Operations Cost 2010Zinnov
 
Scania%20Jan%20Ytterberg%2C%20CFO_tcm10-214730
Scania%20Jan%20Ytterberg%2C%20CFO_tcm10-214730Scania%20Jan%20Ytterberg%2C%20CFO_tcm10-214730
Scania%20Jan%20Ytterberg%2C%20CFO_tcm10-214730finance50
 

Semelhante a Office market dashboard 2011 q2 central (20)

MHK07/03/07
MHK07/03/07MHK07/03/07
MHK07/03/07
 
Brazil Market Managed Services Trend
Brazil Market Managed Services TrendBrazil Market Managed Services Trend
Brazil Market Managed Services Trend
 
Current Financial Situation in Latvia
Current Financial Situation in LatviaCurrent Financial Situation in Latvia
Current Financial Situation in Latvia
 
Procurement Spending in the DC Region
Procurement Spending in the DC RegionProcurement Spending in the DC Region
Procurement Spending in the DC Region
 
Puget Sound Q4 2012 Office Market
Puget Sound Q4 2012 Office MarketPuget Sound Q4 2012 Office Market
Puget Sound Q4 2012 Office Market
 
Budget Forecast Project
Budget Forecast ProjectBudget Forecast Project
Budget Forecast Project
 
What the World Environment Might Look Like in 2050 and What We Can do About It
What the World Environment Might Look Like in 2050 and What We Can do About ItWhat the World Environment Might Look Like in 2050 and What We Can do About It
What the World Environment Might Look Like in 2050 and What We Can do About It
 
P& L(1)
P& L(1)P& L(1)
P& L(1)
 
We are alive! Now what? by Kārlis Cērbulis
We are alive! Now what? by Kārlis CērbulisWe are alive! Now what? by Kārlis Cērbulis
We are alive! Now what? by Kārlis Cērbulis
 
U ti investorday2011-freightforwarding
U ti investorday2011-freightforwardingU ti investorday2011-freightforwarding
U ti investorday2011-freightforwarding
 
Raddon Chart of the Day, December 20, 2011
Raddon Chart of the Day, December 20, 2011Raddon Chart of the Day, December 20, 2011
Raddon Chart of the Day, December 20, 2011
 
Stormwater Financing Mechanisms- Charlotte Katzenmoyer
Stormwater Financing Mechanisms- Charlotte KatzenmoyerStormwater Financing Mechanisms- Charlotte Katzenmoyer
Stormwater Financing Mechanisms- Charlotte Katzenmoyer
 
Us Private Equity Index Slides
Us Private Equity Index SlidesUs Private Equity Index Slides
Us Private Equity Index Slides
 
Re Insights Graphs Oct
Re Insights Graphs OctRe Insights Graphs Oct
Re Insights Graphs Oct
 
Alan Garber: The quest for efficiency in the English NHS
Alan Garber: The quest for efficiency in the English NHSAlan Garber: The quest for efficiency in the English NHS
Alan Garber: The quest for efficiency in the English NHS
 
Lori Jacobwith Engage Your Board HFH March2011
Lori Jacobwith Engage Your Board HFH March2011Lori Jacobwith Engage Your Board HFH March2011
Lori Jacobwith Engage Your Board HFH March2011
 
Q4 11 office midtown - yonge-bloor dashboard
Q4 11 office midtown - yonge-bloor dashboardQ4 11 office midtown - yonge-bloor dashboard
Q4 11 office midtown - yonge-bloor dashboard
 
CDON Group Q1 2011 Financial Results
CDON Group Q1 2011 Financial ResultsCDON Group Q1 2011 Financial Results
CDON Group Q1 2011 Financial Results
 
R&D Operations Cost 2010
R&D Operations Cost 2010R&D Operations Cost 2010
R&D Operations Cost 2010
 
Scania%20Jan%20Ytterberg%2C%20CFO_tcm10-214730
Scania%20Jan%20Ytterberg%2C%20CFO_tcm10-214730Scania%20Jan%20Ytterberg%2C%20CFO_tcm10-214730
Scania%20Jan%20Ytterberg%2C%20CFO_tcm10-214730
 

Mais de Chris Fyvie

Colliers canada national market snapshot 2020 q4
Colliers canada national market snapshot 2020 q4Colliers canada national market snapshot 2020 q4
Colliers canada national market snapshot 2020 q4Chris Fyvie
 
Colliers GTA Office Statistics Q1 2017
Colliers GTA Office Statistics Q1 2017Colliers GTA Office Statistics Q1 2017
Colliers GTA Office Statistics Q1 2017Chris Fyvie
 
Downtown toronto office survey package august 25 2016
Downtown toronto office survey package   august 25 2016Downtown toronto office survey package   august 25 2016
Downtown toronto office survey package august 25 2016Chris Fyvie
 
WTF Properties - Toronto Office Space July availability report
WTF Properties - Toronto Office Space July availability reportWTF Properties - Toronto Office Space July availability report
WTF Properties - Toronto Office Space July availability reportChris Fyvie
 
Plug in to peak productivity - Colliers Spark Report
Plug in to peak productivity - Colliers Spark ReportPlug in to peak productivity - Colliers Spark Report
Plug in to peak productivity - Colliers Spark ReportChris Fyvie
 
Lennard commercial office space downtown toronto
Lennard commercial office space downtown torontoLennard commercial office space downtown toronto
Lennard commercial office space downtown torontoChris Fyvie
 
Q1 2016 cresa market report
Q1 2016 cresa market reportQ1 2016 cresa market report
Q1 2016 cresa market reportChris Fyvie
 
2016 office condo report
2016 office condo report2016 office condo report
2016 office condo reportChris Fyvie
 
Toronto office market report q1 2016
Toronto office market report q1 2016Toronto office market report q1 2016
Toronto office market report q1 2016Chris Fyvie
 
Colliers Gta office market statistics q1 2016
Colliers Gta office market statistics q1 2016Colliers Gta office market statistics q1 2016
Colliers Gta office market statistics q1 2016Chris Fyvie
 
Cadillac Fairview Office Vacancy - May 2016
Cadillac Fairview Office Vacancy - May 2016Cadillac Fairview Office Vacancy - May 2016
Cadillac Fairview Office Vacancy - May 2016Chris Fyvie
 
Security deposit insecurity - Daoust Vukovich LLP
Security deposit insecurity - Daoust Vukovich LLPSecurity deposit insecurity - Daoust Vukovich LLP
Security deposit insecurity - Daoust Vukovich LLPChris Fyvie
 
Costs to Furnish Toronto Office Space
Costs to Furnish Toronto Office SpaceCosts to Furnish Toronto Office Space
Costs to Furnish Toronto Office SpaceChris Fyvie
 
Audio Visual Construction Costs
Audio Visual Construction CostsAudio Visual Construction Costs
Audio Visual Construction CostsChris Fyvie
 
Office Space Construction Costs
Office Space Construction CostsOffice Space Construction Costs
Office Space Construction CostsChris Fyvie
 
Toronto Innovate Office Spaces
Toronto Innovate Office SpacesToronto Innovate Office Spaces
Toronto Innovate Office SpacesChris Fyvie
 
Cadillac fairview gta reports-nov_2015
Cadillac fairview   gta reports-nov_2015Cadillac fairview   gta reports-nov_2015
Cadillac fairview gta reports-nov_2015Chris Fyvie
 
Ashlar november-2015-availability-report
Ashlar november-2015-availability-reportAshlar november-2015-availability-report
Ashlar november-2015-availability-reportChris Fyvie
 
Colliers Toronto office market report 2015 q3
Colliers Toronto office market report 2015 q3Colliers Toronto office market report 2015 q3
Colliers Toronto office market report 2015 q3Chris Fyvie
 
#Toronto Businesses now demanding their offices be close to accessible, rapid...
#Toronto Businesses now demanding their offices be close to accessible, rapid...#Toronto Businesses now demanding their offices be close to accessible, rapid...
#Toronto Businesses now demanding their offices be close to accessible, rapid...Chris Fyvie
 

Mais de Chris Fyvie (20)

Colliers canada national market snapshot 2020 q4
Colliers canada national market snapshot 2020 q4Colliers canada national market snapshot 2020 q4
Colliers canada national market snapshot 2020 q4
 
Colliers GTA Office Statistics Q1 2017
Colliers GTA Office Statistics Q1 2017Colliers GTA Office Statistics Q1 2017
Colliers GTA Office Statistics Q1 2017
 
Downtown toronto office survey package august 25 2016
Downtown toronto office survey package   august 25 2016Downtown toronto office survey package   august 25 2016
Downtown toronto office survey package august 25 2016
 
WTF Properties - Toronto Office Space July availability report
WTF Properties - Toronto Office Space July availability reportWTF Properties - Toronto Office Space July availability report
WTF Properties - Toronto Office Space July availability report
 
Plug in to peak productivity - Colliers Spark Report
Plug in to peak productivity - Colliers Spark ReportPlug in to peak productivity - Colliers Spark Report
Plug in to peak productivity - Colliers Spark Report
 
Lennard commercial office space downtown toronto
Lennard commercial office space downtown torontoLennard commercial office space downtown toronto
Lennard commercial office space downtown toronto
 
Q1 2016 cresa market report
Q1 2016 cresa market reportQ1 2016 cresa market report
Q1 2016 cresa market report
 
2016 office condo report
2016 office condo report2016 office condo report
2016 office condo report
 
Toronto office market report q1 2016
Toronto office market report q1 2016Toronto office market report q1 2016
Toronto office market report q1 2016
 
Colliers Gta office market statistics q1 2016
Colliers Gta office market statistics q1 2016Colliers Gta office market statistics q1 2016
Colliers Gta office market statistics q1 2016
 
Cadillac Fairview Office Vacancy - May 2016
Cadillac Fairview Office Vacancy - May 2016Cadillac Fairview Office Vacancy - May 2016
Cadillac Fairview Office Vacancy - May 2016
 
Security deposit insecurity - Daoust Vukovich LLP
Security deposit insecurity - Daoust Vukovich LLPSecurity deposit insecurity - Daoust Vukovich LLP
Security deposit insecurity - Daoust Vukovich LLP
 
Costs to Furnish Toronto Office Space
Costs to Furnish Toronto Office SpaceCosts to Furnish Toronto Office Space
Costs to Furnish Toronto Office Space
 
Audio Visual Construction Costs
Audio Visual Construction CostsAudio Visual Construction Costs
Audio Visual Construction Costs
 
Office Space Construction Costs
Office Space Construction CostsOffice Space Construction Costs
Office Space Construction Costs
 
Toronto Innovate Office Spaces
Toronto Innovate Office SpacesToronto Innovate Office Spaces
Toronto Innovate Office Spaces
 
Cadillac fairview gta reports-nov_2015
Cadillac fairview   gta reports-nov_2015Cadillac fairview   gta reports-nov_2015
Cadillac fairview gta reports-nov_2015
 
Ashlar november-2015-availability-report
Ashlar november-2015-availability-reportAshlar november-2015-availability-report
Ashlar november-2015-availability-report
 
Colliers Toronto office market report 2015 q3
Colliers Toronto office market report 2015 q3Colliers Toronto office market report 2015 q3
Colliers Toronto office market report 2015 q3
 
#Toronto Businesses now demanding their offices be close to accessible, rapid...
#Toronto Businesses now demanding their offices be close to accessible, rapid...#Toronto Businesses now demanding their offices be close to accessible, rapid...
#Toronto Businesses now demanding their offices be close to accessible, rapid...
 

Último

Rohan Harita Tathawade Pune Brochure.pdf
Rohan Harita Tathawade Pune Brochure.pdfRohan Harita Tathawade Pune Brochure.pdf
Rohan Harita Tathawade Pune Brochure.pdfabbu831446
 
Kohinoor Teiko Hinjewadi Phase 2 Pune E-Brochure.pdf
Kohinoor Teiko Hinjewadi Phase 2 Pune  E-Brochure.pdfKohinoor Teiko Hinjewadi Phase 2 Pune  E-Brochure.pdf
Kohinoor Teiko Hinjewadi Phase 2 Pune E-Brochure.pdfManishSaxena95
 
Kohinoor Courtyard One Wakad Pune | Elegant Living Spaces
Kohinoor Courtyard One Wakad Pune | Elegant Living SpacesKohinoor Courtyard One Wakad Pune | Elegant Living Spaces
Kohinoor Courtyard One Wakad Pune | Elegant Living Spacesaidasheikh47
 
Call Girls in Maurice Nagar (Delhi) ꧁8447779280꧂ Female Escorts Service in De...
Call Girls in Maurice Nagar (Delhi) ꧁8447779280꧂ Female Escorts Service in De...Call Girls in Maurice Nagar (Delhi) ꧁8447779280꧂ Female Escorts Service in De...
Call Girls in Maurice Nagar (Delhi) ꧁8447779280꧂ Female Escorts Service in De...asmaqueen5
 
Bridge & Elliot Ladner Floor Plans May 2024.pdf
Bridge & Elliot Ladner Floor Plans May 2024.pdfBridge & Elliot Ladner Floor Plans May 2024.pdf
Bridge & Elliot Ladner Floor Plans May 2024.pdfVickyAulakh1
 
Vanam At Purva Soukhyam Guduvanchery.pdf.pdf
Vanam At Purva Soukhyam Guduvanchery.pdf.pdfVanam At Purva Soukhyam Guduvanchery.pdf.pdf
Vanam At Purva Soukhyam Guduvanchery.pdf.pdfkratirudram
 
Madhugiri Boucher Managed Farmland (knx)
Madhugiri Boucher Managed Farmland (knx)Madhugiri Boucher Managed Farmland (knx)
Madhugiri Boucher Managed Farmland (knx)knoxdigital1
 
Parksville 96 Surrey Floor Plans May 2024
Parksville 96 Surrey Floor Plans May 2024Parksville 96 Surrey Floor Plans May 2024
Parksville 96 Surrey Floor Plans May 2024VickyAulakh1
 
MEQ Mainstreet Equity Corp Q2 2024 Investor Presentation
MEQ Mainstreet Equity Corp Q2 2024 Investor PresentationMEQ Mainstreet Equity Corp Q2 2024 Investor Presentation
MEQ Mainstreet Equity Corp Q2 2024 Investor PresentationMEQ - Mainstreet Equity Corp.
 
Low Density Living New Project in BPTP THE AMAARIO Sector 37D Gurgaon Haryana...
Low Density Living New Project in BPTP THE AMAARIO Sector 37D Gurgaon Haryana...Low Density Living New Project in BPTP THE AMAARIO Sector 37D Gurgaon Haryana...
Low Density Living New Project in BPTP THE AMAARIO Sector 37D Gurgaon Haryana...ApartmentWala1
 
Yashwin Enchante Uppar Kharadi Pune E-Brochue.pdf
Yashwin Enchante Uppar Kharadi Pune  E-Brochue.pdfYashwin Enchante Uppar Kharadi Pune  E-Brochue.pdf
Yashwin Enchante Uppar Kharadi Pune E-Brochue.pdfManishSaxena95
 
Nyati Elite NIBM Road Pune E Brochure.pdf
Nyati Elite NIBM Road Pune E Brochure.pdfNyati Elite NIBM Road Pune E Brochure.pdf
Nyati Elite NIBM Road Pune E Brochure.pdfabbu831446
 
Real Estate Finance and Investments (2019).pdf
Real Estate Finance and Investments (2019).pdfReal Estate Finance and Investments (2019).pdf
Real Estate Finance and Investments (2019).pdfZahraYusuf9
 
BPTP THE AMAARIO Luxury Project Invest Like Royalty in Sector 37D Gurgaon Dwa...
BPTP THE AMAARIO Luxury Project Invest Like Royalty in Sector 37D Gurgaon Dwa...BPTP THE AMAARIO Luxury Project Invest Like Royalty in Sector 37D Gurgaon Dwa...
BPTP THE AMAARIO Luxury Project Invest Like Royalty in Sector 37D Gurgaon Dwa...ApartmentWala1
 
Eldeco Dwarka Project In Delhi-brochure.pdf.pdf
Eldeco Dwarka Project In Delhi-brochure.pdf.pdfEldeco Dwarka Project In Delhi-brochure.pdf.pdf
Eldeco Dwarka Project In Delhi-brochure.pdf.pdfkratirudram
 
Low Rate Call girls in Sant Nagar{Delhi }8447779280} Service Escorts In South...
Low Rate Call girls in Sant Nagar{Delhi }8447779280} Service Escorts In South...Low Rate Call girls in Sant Nagar{Delhi }8447779280} Service Escorts In South...
Low Rate Call girls in Sant Nagar{Delhi }8447779280} Service Escorts In South...asmaqueen5
 
Best Interior Design Services in Haldwani
Best Interior Design Services in HaldwaniBest Interior Design Services in Haldwani
Best Interior Design Services in HaldwaniGeomatrix
 
Kalpataru Exquisite Wakad Pune E-Brochure.pdf
Kalpataru Exquisite Wakad Pune  E-Brochure.pdfKalpataru Exquisite Wakad Pune  E-Brochure.pdf
Kalpataru Exquisite Wakad Pune E-Brochure.pdfManishSaxena95
 
Acibadem Konaklari Uskudar - Listin Turkey
Acibadem Konaklari Uskudar - Listin TurkeyAcibadem Konaklari Uskudar - Listin Turkey
Acibadem Konaklari Uskudar - Listin TurkeyListing Turkey
 
ACE Terra Yamuna Expressway | 8929888700
ACE Terra Yamuna Expressway | 8929888700ACE Terra Yamuna Expressway | 8929888700
ACE Terra Yamuna Expressway | 8929888700Truhomes
 

Último (20)

Rohan Harita Tathawade Pune Brochure.pdf
Rohan Harita Tathawade Pune Brochure.pdfRohan Harita Tathawade Pune Brochure.pdf
Rohan Harita Tathawade Pune Brochure.pdf
 
Kohinoor Teiko Hinjewadi Phase 2 Pune E-Brochure.pdf
Kohinoor Teiko Hinjewadi Phase 2 Pune  E-Brochure.pdfKohinoor Teiko Hinjewadi Phase 2 Pune  E-Brochure.pdf
Kohinoor Teiko Hinjewadi Phase 2 Pune E-Brochure.pdf
 
Kohinoor Courtyard One Wakad Pune | Elegant Living Spaces
Kohinoor Courtyard One Wakad Pune | Elegant Living SpacesKohinoor Courtyard One Wakad Pune | Elegant Living Spaces
Kohinoor Courtyard One Wakad Pune | Elegant Living Spaces
 
Call Girls in Maurice Nagar (Delhi) ꧁8447779280꧂ Female Escorts Service in De...
Call Girls in Maurice Nagar (Delhi) ꧁8447779280꧂ Female Escorts Service in De...Call Girls in Maurice Nagar (Delhi) ꧁8447779280꧂ Female Escorts Service in De...
Call Girls in Maurice Nagar (Delhi) ꧁8447779280꧂ Female Escorts Service in De...
 
Bridge & Elliot Ladner Floor Plans May 2024.pdf
Bridge & Elliot Ladner Floor Plans May 2024.pdfBridge & Elliot Ladner Floor Plans May 2024.pdf
Bridge & Elliot Ladner Floor Plans May 2024.pdf
 
Vanam At Purva Soukhyam Guduvanchery.pdf.pdf
Vanam At Purva Soukhyam Guduvanchery.pdf.pdfVanam At Purva Soukhyam Guduvanchery.pdf.pdf
Vanam At Purva Soukhyam Guduvanchery.pdf.pdf
 
Madhugiri Boucher Managed Farmland (knx)
Madhugiri Boucher Managed Farmland (knx)Madhugiri Boucher Managed Farmland (knx)
Madhugiri Boucher Managed Farmland (knx)
 
Parksville 96 Surrey Floor Plans May 2024
Parksville 96 Surrey Floor Plans May 2024Parksville 96 Surrey Floor Plans May 2024
Parksville 96 Surrey Floor Plans May 2024
 
MEQ Mainstreet Equity Corp Q2 2024 Investor Presentation
MEQ Mainstreet Equity Corp Q2 2024 Investor PresentationMEQ Mainstreet Equity Corp Q2 2024 Investor Presentation
MEQ Mainstreet Equity Corp Q2 2024 Investor Presentation
 
Low Density Living New Project in BPTP THE AMAARIO Sector 37D Gurgaon Haryana...
Low Density Living New Project in BPTP THE AMAARIO Sector 37D Gurgaon Haryana...Low Density Living New Project in BPTP THE AMAARIO Sector 37D Gurgaon Haryana...
Low Density Living New Project in BPTP THE AMAARIO Sector 37D Gurgaon Haryana...
 
Yashwin Enchante Uppar Kharadi Pune E-Brochue.pdf
Yashwin Enchante Uppar Kharadi Pune  E-Brochue.pdfYashwin Enchante Uppar Kharadi Pune  E-Brochue.pdf
Yashwin Enchante Uppar Kharadi Pune E-Brochue.pdf
 
Nyati Elite NIBM Road Pune E Brochure.pdf
Nyati Elite NIBM Road Pune E Brochure.pdfNyati Elite NIBM Road Pune E Brochure.pdf
Nyati Elite NIBM Road Pune E Brochure.pdf
 
Real Estate Finance and Investments (2019).pdf
Real Estate Finance and Investments (2019).pdfReal Estate Finance and Investments (2019).pdf
Real Estate Finance and Investments (2019).pdf
 
BPTP THE AMAARIO Luxury Project Invest Like Royalty in Sector 37D Gurgaon Dwa...
BPTP THE AMAARIO Luxury Project Invest Like Royalty in Sector 37D Gurgaon Dwa...BPTP THE AMAARIO Luxury Project Invest Like Royalty in Sector 37D Gurgaon Dwa...
BPTP THE AMAARIO Luxury Project Invest Like Royalty in Sector 37D Gurgaon Dwa...
 
Eldeco Dwarka Project In Delhi-brochure.pdf.pdf
Eldeco Dwarka Project In Delhi-brochure.pdf.pdfEldeco Dwarka Project In Delhi-brochure.pdf.pdf
Eldeco Dwarka Project In Delhi-brochure.pdf.pdf
 
Low Rate Call girls in Sant Nagar{Delhi }8447779280} Service Escorts In South...
Low Rate Call girls in Sant Nagar{Delhi }8447779280} Service Escorts In South...Low Rate Call girls in Sant Nagar{Delhi }8447779280} Service Escorts In South...
Low Rate Call girls in Sant Nagar{Delhi }8447779280} Service Escorts In South...
 
Best Interior Design Services in Haldwani
Best Interior Design Services in HaldwaniBest Interior Design Services in Haldwani
Best Interior Design Services in Haldwani
 
Kalpataru Exquisite Wakad Pune E-Brochure.pdf
Kalpataru Exquisite Wakad Pune  E-Brochure.pdfKalpataru Exquisite Wakad Pune  E-Brochure.pdf
Kalpataru Exquisite Wakad Pune E-Brochure.pdf
 
Acibadem Konaklari Uskudar - Listin Turkey
Acibadem Konaklari Uskudar - Listin TurkeyAcibadem Konaklari Uskudar - Listin Turkey
Acibadem Konaklari Uskudar - Listin Turkey
 
ACE Terra Yamuna Expressway | 8929888700
ACE Terra Yamuna Expressway | 8929888700ACE Terra Yamuna Expressway | 8929888700
ACE Terra Yamuna Expressway | 8929888700
 

Office market dashboard 2011 q2 central

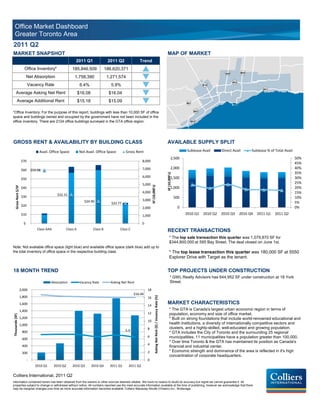
  • 1. Office Market Dashboard Greater Toronto Area 2011 Q2 MARKET SNAPSHOT MAP OF MARKET 2011 Q1 2011 Q2 Trend Office Inventory* 185,846,509 186,620,371 p Net Absorption 1,758,390 1,271,574 q Vacancy Rate 6.4% 5.9% q Average Asking Net Rent $16.08 $16.04 q Average Additional Rent $15.18 $15.09 q *Office Inventory: For the purpose of this report, buildings with less than 10,000 SF of office space and buildings owned and occupied by the government have not been included in the office inventory. There are 2124 office buildings surveyed in the GTA office region. GROSS RENT & AVAILABILITY BY BUILDING CLASS AVAILABLE SUPPLY SPLIT Avail. Office Space Not Avail. Office Space Gross Rent Sublease Avail Direct Avail Sublease % of Total Avail. 2,500 50% $70 8,000 45% $60 7,000 2,000 40% $59.98 35% SF (10,000's) 6,000 1,500 30% $50 5,000 25% SF (10,000's) 1,000 20% Gross Rent $/SF $40 4,000 15% $32.31 $30 500 10% $24.90 3,000 $22.77 5% $20 0 2,000 0% $10 1,000 2010 Q1 2010 Q2 2010 Q3 2010 Q4 2011 Q1 2011 Q2 $- 0 Class AAA Class A Class B Class C RECENT TRANSACTIONS * The top sale transaction this quarter was 1,079,870 SF for $344,800,000 at 595 Bay Street. The deal closed on June 1st. Note: Not available office space (light blue) and available office space (dark blue) add up to the total inventory of office space in the respective building class. * The top lease transaction this quarter was 180,000 SF at 5550 Explorer Drive with Target as the tenant. 18 MONTH TREND TOP PROJECTS UNDER CONSTRUCTION * GWL Realty Advisors has 644,952 SF under construction at 18 York Absorption Vacancy Rate Asking Net Rent Street. 2,000 18 $16.04 1,800 Asking Net Rent ($) / Vacancy Rate (%) 16 1,600 14 MARKET CHARACTERISTICS 1,400 * The GTA is Canada's largest urban economic region in terms of 12 population, economy and size of office market. Thousands (SF) 1,200 * Built on strong foundations that include world-renowned educational and 10 1,000 health institutions, a diversity of internationally competitive sectors and 8 clusters, and a highly-skilled, well-educated and growing population. 800 5.9 * GTA includes the City of Toronto and the surrounding 25 regional 6 municipalities. 11 municipalities have a population greater than 100,000. 600 * Over time Toronto & the GTA has maintained its position as Canada's 400 4 financial and industrial center. 200 2 * Economic strength and dominance of the area is reflected in it's high concentration of corporate headquarters. - 0 2010 Q1 2010 Q2 2010 Q3 2010 Q4 2011 Q1 2011 Q2 Colliers International, 2011 Q2 Information contained herein has been obtained from the owners or other sources deemed reliable. We have no reason to doubt its accuracy but regret we cannot guarantee it. All properties subject to change or withdrawal without notice. All numbers reported use the most accurate information available at the time of publishing, however we acknowledge that there may be marginal changes over time as more accurate information becomes available. Colliers Macaulay Nicolls (Ontario) Inc., Brokerage.
  • 2. Office Market Dashboard Downtown 2011 Q2 MARKET SNAPSHOT MAP OF MARKET 2011 Q1 2011 Q2 Trend Office Inventory* 69,731,115 70,382,021 p Net Absorption 774,454 791,217 p Vacancy Rate 5.7% 4.6% q Average Asking Net Rent $22.82 $23.30 p Average Additional Rent $22.87 $23.00 p *Office Inventory: For the purpose of this report, buildings with less than 10,000 SF of office space and buildings owned and occupied by the government have not been included in the office inventory. There are 525 office buildings surveyed in the Downtown office region. GROSS RENT & AVAILABILITY BY BUILDING CLASS AVAILABLE SUPPLY SPLIT Avail. Office Space Not Avail. Office Space Gross Rent Sublease Avail Direct Avail Sublease % of Total Avail. 800 20% $70 3,000 700 18% $60 $59.98 16% 2,500 600 14% SF (10,000's) 500 12% $50 $47.23 2,000 400 10% SF (10,000's) 8% Gross Rent $/SF $40 300 $35.76 1,500 6% $30 200 $30.74 4% 1,000 100 2% $20 0 0% $10 500 2010 Q1 2010 Q2 2010 Q3 2010 Q4 2011 Q1 2011 Q2 $- 0 Class AAA Class A Class B Class C RECENT TRANSACTIONS * The top sale transaction this quarter was SF for $103,000,000 at 180 Dundas Street West. The deal closed January 25th. Note: Not available office space (light blue) and available office space (dark blue) add up to the total inventory of office space in the respective building class. * The top lease transaction this quarter was 78,000 SF at 18 York Street. The tenant was SNC Lavilin. 18 MONTH TREND TOP PROJECTS UNDER CONSTRUCTION * GWL Realty Advisors has 644,952 SF under construction at 18 York Absorption Vacancy Rate Asking Net Rent Street. 1,000 $23.30 25 Asking Net Rent ($) / Vacancy Rate (%) 800 MARKET CHARACTERISTICS 20 * Submarkets within the Downtown market include: Financial Core, 600 Downtown East, Downtown North, Downtown South and Downtown West. Thousands (SF) 15 * Major Highways to Toronto Submarkets: Highway 400, Highway 401, Highway 427, Don Valley Parkway, Gardner Expressway, Queen Elizabeth 400 Way. 10 * Billy Bishop Toronto City Airport is minutes from the Downtown Core and 200 Financial District. * Public Transit available by TTC bus and subway systems. GO Transit 4.6 5 network connects Toronto to Peel, York, Durham and Halton Regions via - Bus and Train routes. 2010 Q1 2010 Q2 2010 Q3 2010 Q4 2011 Q1 2011 Q2 * Toronto remains the largest business centre in Canada and is home to the -200 0 five largest banks, five public research Universities and six community Colleges. Colliers International, 2011 Q2 Information contained herein has been obtained from the owners or other sources deemed reliable. We have no reason to doubt its accuracy but regret we cannot guarantee it. All properties subject to change or withdrawal without notice. All numbers reported use the most accurate information available at the time of publishing, however we acknowledge that there may be marginal changes over time as more accurate information becomes available. Colliers Macaulay Nicolls (Ontario) Inc., Brokerage.
  • 3. Office Submarket Dashboard Financial Core 2011 Q2 SUBMARKET SNAPSHOT MAP OF MARKET 2011 Q1 2011 Q2 Trend Office Inventory* 33,631,324 33,618,409 q Net Absorption 454,190 464,522 p Vacancy Rate 6.3% 5.2% q Average Asking Net Rent $26.00 $26.30 p Average Additional Rent $28.28 $27.89 q *Office Inventory: For the purpose of this report, buildings with less than 10,000 SF of office space and buildings owned and occupied by the government have not been included in the office inventory. There are 109 office buildings surveyed in the Financial Core office region. GROSS RENT & AVAILABILITY BY BUILDING CLASS AVAILABLE SUPPLY SPLIT Avail. Office Space Not Avail. Office Space Gross Rent Sublease Avail Direct Avail Sublease % of Total Avail. 500 50% $70 1,400 450 45% $60 $59.98 1,200 400 40% 350 35% SF (10,000's) $52.73 300 30% $50 1,000 250 25% SF (10,000's) 200 20% Gross Rent $/SF $40 $40.75 800 $37.75 150 15% $30 600 100 10% 50 5% $20 400 0 0% $10 200 2010 Q1 2010 Q2 2010 Q3 2010 Q4 2011 Q1 2011 Q2 $- 0 Class AAA Class A Class B Class C RECENT TRANSACTIONS * No sale transactions were recorded during this period. Note: Not available office space (light blue) and available office space (dark blue) add * The top lease transaction this quarter was 27,500 SF at 181 Bay up to the total inventory of office space in the respective building class. Street. The tenant was Global Prime Office. 18 MONTH TREND TOP PROJECTS UNDER CONSTRUCTION * No under construction projects recorded during this period. Absorption Vacancy Rate Asking Net Rent 600 30 Asking Net Rent ($) / Vacancy Rate (%) 500 $26.30 25 SUBMARKET CHARACTERISTICS * The Financial Core is the most dense office submarket in the GTA, with 400 20 one of the lowest vacancy rates. Thousands (SF) * GTA top annual rental rates are located in buildings in this market. 300 15 * Prestige urban location and modern, state-of-the-art architecture. 200 10 * Limited parking, but great access to public transit and the PATH system 5.2 (Toronto's underground walkway). 100 5 * Proximity to multiple amenities and services are convenient for employees and customers. - 0 2010 Q1 2010 Q2 2010 Q3 2010 Q4 2011 Q1 2011 Q2 Colliers International, 2011 Q2 Information contained herein has been obtained from the owners or other sources deemed reliable. We have no reason to doubt its accuracy but regret we cannot guarantee it. All properties subject to change or withdrawal without notice. All numbers reported use the most accurate information available at the time of publishing, however we acknowledge that there may be marginal changes over time as more accurate information becomes available. Colliers Macaulay Nicolls (Ontario) Inc., Brokerage.
  • 4. Office Submarket Dashboard Downtown East 2011 Q2 SUBMARKET SNAPSHOT MAP OF MARKET 2011 Q1 2011 Q2 Trend Office Inventory* 3,980,709 3,924,812 q Net Absorption 60,116 98,743 p Vacancy Rate 6.0% 6.7% p Average Asking Net Rent $18.19 $18.76 p Average Additional Rent $9.94 $10.45 p *Office Inventory: For the purpose of this report, buildings with less than 10,000 SF of office space and buildings owned and occupied by the government have not been included in the office inventory. There are 110 office buildings surveyed in the Downtown East office region. GROSS RENT & AVAILABILITY BY BUILDING CLASS AVAILABLE SUPPLY SPLIT Avail. Office Space Not Avail. Office Space Gross Rent Sublease Avail Direct Avail Sublease % of Total Avail. 60 12% $40 250 $35.53 50 10% $35 $31.82 200 40 8% SF (10,000's) $30 $25 30 6% $24.13 150 SF (10,000's) Gross Rent $/SF $20 20 4% $15 100 10 2% $10 0 0% 50 $5 2010 Q1 2010 Q2 2010 Q3 2010 Q4 2011 Q1 2011 Q2 $- 0 Class A Class B Class C RECENT TRANSACTIONS * No sale transactions were recorded during this period. Note: Not available office space (light blue) and available office space (dark blue) add * The top lease transaction this quarter was 14,000 SF at 143 Lake up to the total inventory of office space in the respective building class. Shore Blvd East. The deal closed May 12th. 18 MONTH TREND TOP PROJECTS UNDER CONSTRUCTION * No under construction projects recorded during this period. Absorption Vacancy Rate Asking Net Rent 150 $18.76 20 18 Asking Net Rent ($) / Vacancy Rate (%) 100 16 SUBMARKET CHARACTERISTICS 50 14 * Public Transit available by TTC bus and subway systems. GO Transit network connects Toronto to Peel, York, Durham and Halton Regions via Bus and Train Thousands (SF) 12 routes. - 2010 Q1 2010 Q2 2010 Q3 2010 Q4 2011 Q1 2011 Q2 10 * VIA Rail, Amtrak and Ontario Northlands rail service from Union Station. -50 * Billy Bishop Toronto City Airport is minutes from the Downtown Core. 6.7 8 * Major Highways to Downtown East Submarket: Gardiner Expressway and Don -100 6 Valley Parkway. * The original 10 blocks of Toronto are located within this submarket, making it 4 home to many historical brick and beam buildings. -150 2 * Top Industries in Downtown East include: Business Services, Finance, Insurance and Real Estate, Information and Cultural Industries. -200 0 Colliers International, 2011 Q2 Information contained herein has been obtained from the owners or other sources deemed reliable. We have no reason to doubt its accuracy but regret we cannot guarantee it. All properties subject to change or withdrawal without notice. All numbers reported use the most accurate information available at the time of publishing, however we acknowledge that there may be marginal changes over time as more accurate information becomes available. Colliers Macaulay Nicolls (Ontario) Inc., Brokerage.
  • 5. Office Submarket Dashboard Downtown North 2011 Q2 SUBMARKET SNAPSHOT MAP OF MARKET 2011 Q1 2011 Q2 Trend Office Inventory* 14,723,534 14,718,459 q Net Absorption 89,380 59,639 q Vacancy Rate 3.4% 3.1% q Average Asking Net Rent $18.32 $19.65 p Average Additional Rent $19.54 $19.70 p *Office Inventory: For the purpose of this report, buildings with less than 10,000 SF of office space and buildings owned and occupied by the government have not been included in the office inventory. There are 74 office buildings surveyed in the Downtown North office region. GROSS RENT & AVAILABILITY BY BUILDING CLASS AVAILABLE SUPPLY SPLIT Avail. Office Space Not Avail. Office Space Gross Rent Sublease Avail Direct Avail Sublease % of Total Avail. 80 50% $44 700 70 45% $43.02 600 40% $42 60 35% SF (10,000's) 50 30% 500 $40 40 25% SF (10,000's) 20% Gross Rent $/SF 400 30 $38 15% 300 20 10% $36 10 5% $36.16 $35.88 200 0 0% $34 100 2010 Q1 2010 Q2 2010 Q3 2010 Q4 2011 Q1 2011 Q2 $32 0 Class A Class B Class C RECENT TRANSACTIONS * The top sale transaction this quarter was 1,079,870 SF for $344,800,000 at 595 Bay Street. The deal closed June 1st. Note: Not available office space (light blue) and available office space (dark blue) add up to the total inventory of office space in the respective building class. * No lease transactions were recorded during this period. 18 MONTH TREND TOP PROJECTS UNDER CONSTRUCTION * No under construction projects recorded during this period. Absorption Vacancy Rate Asking Net Rent 100 20 $18.07 80 18 Asking Net Rent ($) / Vacancy Rate (%) SUBMARKET CHARACTERISTICS 60 16 * Public Transit available by TTC bus and subway systems. GO Transit network 40 14 connects Toronto to Peel, York, Durham and Halton Regions via Bus and Train Thousands (SF) 20 12 routes. * VIA Rail, Amtrak and Ontario Northlands rail service from Union Station. - 10 Billy Bishop Toronto City Airport is minutes from the Downtown Core. -20 2010 Q1 2010 Q2 2010 Q3 2010 Q4 2011 Q1 2011 Q2 8 * Major Highway to Downtown North Submarket: Don Valley Parkway. -40 6 * Bordering the Financial Core, amenities within the Downtown North submarket include Provincial Courts, the Toronto Eaton Centre and the Toronto Discovery -60 3.1 4 District research park. -80 2 * Top Employers include: Rogers Telecommunication, Royal Bank of Canada, Bank of Montreal, and Ontario Power Generation. -100 0 * Top Industries in Downtown North include: Finance, Insurance and Real Estate, Public Administration and Business Services. Colliers International, 2011 Q2 Information contained herein has been obtained from the owners or other sources deemed reliable. We have no reason to doubt its accuracy but regret we cannot guarantee it. All properties subject to change or withdrawal without notice. All numbers reported use the most accurate information available at the time of publishing, however we acknowledge that there may be marginal changes over time as more accurate information becomes available. Colliers Macaulay Nicolls (Ontario) Inc., Brokerage.
  • 6. Office Submarket Dashboard Downtown South 2011 Q2 SUBMARKET SNAPSHOT MAP OF MARKET 2011 Q1 2011 Q2 Trend Office Inventory* 3,087,471 3,815,463 p Net Absorption 12,995 65,526 p Vacancy Rate 7.1% 5.0% q Average Asking Net Rent $15.00 $22.02 p Average Additional Rent $13.16 $18.08 p *Office Inventory: For the purpose of this report, buildings with less than 10,000 SF of office space and buildings owned and occupied by the government have not been included in the office inventory. There are 18 office buildings surveyed in the Downtown South office region. GROSS RENT & AVAILABILITY BY BUILDING CLASS AVAILABLE SUPPLY SPLIT Avail. Office Space Not Avail. Office Space Gross Rent Sublease Avail Direct Avail Sublease % of Total Avail. 40 90% $60 250 35 80% $53.90 70% $50 30 200 60% SF (10,000's) 25 $40 50% 20 150 40% SF (10,000's) Gross Rent $/SF 15 $30 30% $29.31 10 20% 100 $20 5 10% $18.82 0 0% 50 $10 2010 Q1 2010 Q2 2010 Q3 2010 Q4 2011 Q1 2011 Q2 $- 0 Class A Class B Class C RECENT TRANSACTIONS * No sale transactions were recorded during this period. Note: Not available office space (light blue) and available office space (dark blue) add * The top lease transaction this quarter was 78,000 SF at 18 York Street. up to the total inventory of office space in the respective building class. The tenant was SNC Lavilin. 18 MONTH TREND TOP PROJECTS UNDER CONSTRUCTION * GWL Realty Advisors has 644,952 SF under construction at 18 York Street. Absorption Vacancy Rate Asking Net Rent 500 25 Asking Net Rent ($) / Vacancy Rate (%) 400 $22.02 SUBMARKET CHARACTERISTICS 20 * Public Transit available by TTC bus and subway systems. GO Transit network 300 connects Toronto to Peel, York, Durham and Halton Regions via Bus and Train Thousands (SF) 15 routes. * VIA Rail, Amtrak and Ontario Northlands rail service from Union Station. 200 * Billy Bishop Toronto City Airport is minutes from the Downtown Core. 10 * Major Highway to Downtown South Submarket: Gardiner Expressway. 100 * Significant Office developments south of Union Station are redefining the 5.0 boundaries of the Financial Core. 5 * New facilities include: Corus Entertainment Headquarters, George Brown - College Waterfront Campus. 2010 Q1 2010 Q2 2010 Q3 2010 Q4 2011 Q1 2011 Q2 * Top Industries in Downtown South include: Finance, Insurance and Real Estate, -100 0 Business Services, Information and Cultural Industries. Colliers International, 2011 Q2 Information contained herein has been obtained from the owners or other sources deemed reliable. We have no reason to doubt its accuracy but regret we cannot guarantee it. All properties subject to change or withdrawal without notice. All numbers reported use the most accurate information available at the time of publishing, however we acknowledge that there may be marginal changes over time as more accurate information becomes available. Colliers Macaulay Nicolls (Ontario) Inc., Brokerage.
  • 7. Office Submarket Dashboard Downtown West 2011 Q2 SUBMARKET SNAPSHOT MAP OF MARKET 2011 Q1 2011 Q2 Trend Office Inventory* 14,308,077 14,304,878 q Net Absorption 157,774 102,788 q Vacancy Rate 6.1% 4.0% q Average Asking Net Rent $17.91 $18.07 p Average Additional Rent $14.50 $15.03 p *Office Inventory: For the purpose of this report, buildings with less than 10,000 SF of office space and buildings owned and occupied by the government have not been included in the office inventory. There are 214 office buildings surveyed in the Downtown West office region. GROSS RENT & AVAILABILITY BY BUILDING CLASS AVAILABLE SUPPLY SPLIT Avail. Office Space Not Avail. Office Space Gross Rent Sublease Avail Direct Avail Sublease % of Total Avail. 160 25% $35 900 140 $34 $33.75 800 20% $33.38 120 $33 SF (10,000's) 700 100 15% $32 600 80 $31 SF (10,000's) 10% Gross Rent $/SF 500 60 $30 400 40 $29 5% $28.48 300 20 $28 0 0% $27 200 2010 Q1 2010 Q2 2010 Q3 2010 Q4 2011 Q1 2011 Q2 $26 100 $25 0 Class A Class B Class C RECENT TRANSACTIONS * The top sale transaction this quarter was 3,500 SF for $1,360,000 at 123 John Street. The deal closed on March 31st. . Note: Not available office space (light blue) and available office space (dark blue) add up to the total inventory of office space in the respective building class. * The top lease transaction this quarter was 26,000 SF at 155 Wellington Street West. The tenant is Paliare Roland. 18 MONTH TREND TOP PROJECTS UNDER CONSTRUCTION * No under construction projects recorded during this period. Absorption Vacancy Rate Asking Net Rent 200 20 18 Asking Net Rent ($) / Vacancy Rate (%) $18.07 150 16 SUBMARKET CHARACTERISTICS * Offering many downtown location advantages, but at lower rental prices 14 than in the Financial Core . Thousands (SF) 100 12 * This submarket is an excellent option for those tenants whose operations do not require a core location. 10 * Well connected to public transit (streetcars along King Street W and 50 8 Queen Street W) and to the Gardiner Expressway, making this submarket accessible to employees and customers. 6 * With many new residential high-rise developments (e.g. Concord City 4.0 - 4 Place), the labour pool will increase and diversify. 2010 Q1 2010 Q2 2010 Q3 2010 Q4 2011 Q1 2011 Q2 * Many former factory buildings (brick & beam) have been converted into 2 office buildings, specifically hosting the Information Technology, Art and -50 0 Design Industry. Colliers International, 2011 Q2 Information contained herein has been obtained from the owners or other sources deemed reliable. We have no reason to doubt its accuracy but regret we cannot guarantee it. All properties subject to change or withdrawal without notice. All numbers reported use the most accurate information available at the time of publishing, however we acknowledge that there may be marginal changes over time as more accurate information becomes available. Colliers Macaulay Nicolls (Ontario) Inc., Brokerage.
  • 8. Office Market Dashboard Midtown 2011 Q2 SUBMARKET SNAPSHOT MAP OF MARKET 2011 Q1 2011 Q2 Trend Office Inventory* 18,300,645 18,232,300 q Net Absorption 153,787 153,463 q Vacancy Rate 4.8% 4.7% q Average Asking Net Rent $15.56 $15.90 p Average Additional Rent $18.66 $18.35 q *Office Inventory: For the purpose of this report, buildings with less than 10,000 SF of office space and buildings owned and occupied by the government have not been included in the office inventory. There are 213 office buildings surveyed in the Midtown office region. GROSS RENT & AVAILABILITY BY BUILDING CLASS AVAILABLE SUPPLY SPLIT Avail. Office Space Not Avail. Office Space Gross Rent Sublease Avail Direct Avail Sublease % of Total Avail. 250 50% $45 1,200 45% $40 $41.40 200 40% 1,000 35% SF (10,000's) $35 $33.85 150 30% $30 800 25% $28.76 SF (10,000's) 100 20% Gross Rent $/SF $25 600 15% $20 50 10% $15 400 5% 0 0% $10 200 2010 Q1 2010 Q2 2010 Q3 2010 Q4 2011 Q1 2011 Q2 $5 $- 0 Class A Class B Class C RECENT TRANSACTIONS * The top sale transaction this quarter was 64,575 SF for $12,601,000 at 161 Eglinton Avenue East. The deal closed June 7th. Note: Not available office space (light blue) and available office space (dark blue) add up to the total inventory of office space in the respective building class. * No major lease transactions were recorded during this period. 18 MONTH TREND TOP PROJECTS UNDER CONSTRUCTION * No under construction projects recorded during this period. Absorption Vacancy Rate Asking Net Rent 200 18 Asking Net Rent ($) / Vacancy Rate (%) 16 150 $15.90 SUBMARKET CHARACTERISTICS 14 * Submarkets within the Midtown Market include: Toronto West, Yonge & 100 12 Bloor, Yonge & St. Clair and Yonge & Eglinton. Thousands (SF) * Public Transit available by TTC bus and subway systems. GO Transit 10 network connects Toronto to Peel, York, Durham and Halton Regions via 50 Bus and Train routes. 8 * Major Highways to Midtown Market: Highway 401 and Don Valley - 6 Parkway. 4.7 * Major Corporations in the market include: RioCan, Canadian Tire, Toronto 2010 Q1 2010 Q2 2010 Q3 2010 Q4 2011 Q1 2011 Q2 4 Transit Commission (TTC) and Desjardins Credit Union. -50 * Top Industries in the Midtown Market include: Business Services, 2 Finance, Insurance and Real Estate and Public Administration. -100 0 Colliers International, 2011 Q2 Information contained herein has been obtained from the owners or other sources deemed reliable. We have no reason to doubt its accuracy but regret we cannot guarantee it. All properties subject to change or withdrawal without notice. All numbers reported use the most accurate information available at the time of publishing, however we acknowledge that there may be marginal changes over time as more accurate information becomes available. Colliers Macaulay Nicolls (Ontario) Inc., Brokerage.
  • 9. Office Submarket Dashboard Yonge - Bloor 2011 Q2 MARKET SNAPSHOT MAP OF MARKET 2011 Q1 2011 Q2 Trend Office Inventory* 9,659,332 9,633,002 q Net Absorption 61,748 40,969 q Vacancy Rate 3.8% 4.0% p Average Asking Net Rent $16.71 $17.51 p Average Additional Rent $19.95 $19.39 q *Office Inventory: For the purpose of this report, buildings with less than 10,000 SF of office space and buildings owned and occupied by the government have not been included in the office inventory. There are 74 office buildings surveyed in the Yonge- Bloor office region. GROSS RENT & AVAILABILITY BY BUILDING CLASS AVAILABLE SUPPLY SPLIT Avail. Office Space Not Avail. Office Space Gross Rent Sublease Avail Direct Avail Sublease % of Total Avail. 70 50% $45 600 $42.83 45% 60 $40 40% 500 50 35% $36.20 SF (10,000's) $35 40 30% $30 $30.59 400 25% 30 SF (10,000's) 20% Gross Rent $/SF $25 300 20 15% $20 10% 10 $15 200 5% 0 0% $10 100 2010 Q1 2010 Q2 2010 Q3 2010 Q4 2011 Q1 2011 Q2 $5 $- 0 Class A Class B Class C RECENT TRANSACTIONS * The top sale transaction this quarter was 5,176 SF for $1,800,000 at 133 Lowther Avenue. The deal closed June 20th. Note: Not available office space (light blue) and available office space (dark blue) add up to the total inventory of office space in the respective building class. * No lease transactions were recorded during this period. 18 MONTH TREND TOP PROJECTS UNDER CONSTRUCTION * No under construction projects recorded during this period. Absorption Vacancy Rate Asking Net Rent 70 20 $17.51 18 Asking Net Rent ($) / Vacancy Rate (%) 60 16 MARKET CHARACTERISTICS 50 * Public Transit available by TTC bus and subway systems. GO Transit network 14 40 connects Toronto to Peel, York, Durham and Halton Regions via Bus and Train Thousands (SF) 12 routes. 30 10 * Largest Midtown Office Submarket in terms of Total Inventory and Occupied 20 Space. 8 * Major Highway to Yonge-Bloor Submarket: Don Valley Parkway. 10 * Labour pool intensification as a result of many new high-rise residential 6 4.0 developments in the Submarket. - 4 * Top Employers include: TD Waterhouse, Bank of Montreal, Royal Bank of 2010 Q1 2010 Q2 2010 Q3 2010 Q4 2011 Q1 2011 Q2 -10 2 Canada and Hudson Bay Company. * Top Industries in the Yonge-Bloor Submarket include: Finance, Insurance and -20 0 Real Estate, Business Services and Information and Cultural Industries. Colliers International, 2011 Q2 Information contained herein has been obtained from the owners or other sources deemed reliable. We have no reason to doubt its accuracy but regret we cannot guarantee it. All properties subject to change or withdrawal without notice. All numbers reported use the most accurate information available at the time of publishing, however we acknowledge that there may be marginal changes over time as more accurate information becomes available. Colliers Macaulay Nicolls (Ontario) Inc., Brokerage.