On National Teacher Day, meet the 2024-25 Kenan Fellows
Presenting Data
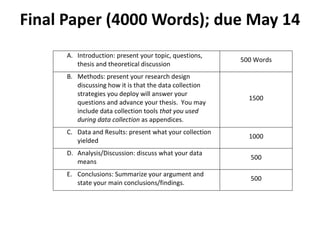
1. Final Paper (4000 Words); due May 14
A. Introduction: present your topic, questions,
500 Words
thesis and theoretical discussion
B. Methods: present your research design
discussing how it is that the data collection
strategies you deploy will answer your
1500
questions and advance your thesis. You may
include data collection tools that you used
during data collection as appendices.
C. Data and Results: present what your collection
1000
yielded
D. Analysis/Discussion: discuss what your data
500
means
E. Conclusions: Summarize your argument and
500
state your main conclusions/findings.
2. Presenting Data
• Data Visualization vs. Infographics
– Garbage in, Garbage out
• Fry’s Seven Stages of Data • Tufte’s Rules
– Acquire – Show the data
– Parse – Be accurate
– Filter – Make large datasets
– Mine coherent
– Represent – Serve a clear purpose
– Refine – Reveal different levels
– (Interact) – Encourage for ‘reading’
http://flowingdata.com/ http://junkcharts.typepad.com/junk_charts/
12. Get your axes right: the X (horizontal)
axis is the independent variable.
Linked Fate
100
80
60 Wrong
40
20
0
Latinos Whites Asians Blacks
Latinos Whites Blacks
Linked Fate
100
80
60
Right 40
20
0
Latinos Whites Blacks
Latinos Whites Asians Blacks
13. GPIA Concentration
Response Response
Answer Options
Percent Count
Cities and Urbanization 0.0% 0
Conflict and Security 13.0% 3
Development 21.7% 5
Governance and Rights 39.1% 9
Media and Culture 30.4% 7
Milano 0.0% 0 GPIA Concentration
answered question 23
45.0%
40.0%
35.0%
30.0%
25.0%
20.0%
15.0%
10.0%
5.0%
0.0%
GPIA Concentration
Conflict and Security
Milano
Urbanization
Development
Media and Culture
Governance and
Cities and
Rights
Cities and Urbanization
Conflict and Security
Development
Governance and Rights
Media and Culture
Milano