SlideShare uma empresa Scribd logo
1 de 10
Baixar para ler offline
PRIMAVERA DASHBOARD EXCLUSIVE 17 PORTLETS :-
Available Portlets:-
1. Schedule Performance Portlet
2. Earned Value Performance Portlet
3. Index Performance Portlet
4. Project Statistics Portlet
5. Project Health Portlet
6. Project Notebooks Portlet
7. Project Gantt Chart Portlet
8. Resource Team Summary Portlet
9. Open Requests for Resources Portlet
10. Resource Analysis Chart Portlet
11. My Projects Portlet
12. My Activities Portlet
13. My Risks Portlet
14. My Issues Portlet
15. Communication Center Portlet
16. My calendar Portlet
17. Portfolio Views Portlets
i) Schedule Performance Portlet :-
Schedule Performance portlet displays both current and forecast schedule summary
performance information, in either costs or labor units. Positive performance schedule values
indicate that the project is ahead of schedule; negative values indicate that the project is
behind schedule. Positive performance cost values indicate that the project is under budget;
negative values indicate that the project is over budget.
ii) Earned Value Performance Portlet :-
The Earned Value Performance portlet displays both current and forecast earned value
schedule variance (SV), cost variance (CV), and labor unit variance calculations. Data are
calculated and displayed in either costs or labor units, depending on your preference.
Negative values indicate unfavorable performance.
iii) Index Performance Portlet :-
The Index Performance portlet displays schedule performance index (SPI), cost
performance index (CPI), and to complete performance index (TCPI) calculations
 SPI indicates whether you are meeting earned and planned values within your
schedule.
 CPI indicates whether you have spent money over the budget to date.
 TCPI enables you to determine the level of performance needed to achieve the
cost or time objectives.
iv) Project Statistics Portlet :-
The Project Statistics portlet enables you to analyze project information in row and
column format for a particular project or project group.In a dashboard, the portlet displays
the information you select down to the WBS level for all projects included in the current
dashboard filter. For example, if you filter a dashboard by a portfolio, the Project
Statistics portlet displays data for all projects included in that portfolio.
 In a project workspace, the portlet displays the information you select down to
the WBS level for the currently open project.
v) Project Health Portlet :-
The Project Health portlet enables you to quickly see how well a portfolio or individual
project is performing. Status indicators are based on performance thresholds you set in Global
Preferences. You can set performance thresholds to correspond to each of the status
indicators.
vi) Project Notebooks Portlet :-
The Project Notebooks portlet displays all of the notebook items assigned to the
selected project. It displays all of the notebook items assigned to the projects that meet the
dashboard's selected filter criteria. Notebooks are used to set up general categories for
information relating to activity, project, EPS, and WBS notes.
Vii) Project Gantt chart portlet :-
Use the Project Gantt Chart portlet to quickly view the status of projects and review
each project's milestones. The project table on the left side of the portlet lists projects that
meet the portfolio, project code value, or project filter criteria specified in the dashboard's
Filter by field. You can filter the milestones that display in the portlet by selecting an activity
code filter.
The Gantt Chart on the right side of the portlet displays a bar for each project, which
represents the span between the Planned Start and Scheduled Finish dates of the project. The
blue section of each project bar indicates current progress, while the green section of each
bar indicates remaining effort.
viii) Resource Team Summary Portlet :-
The Resource Team Summary portlet enables you to view the resources that belong to
a team you select, including each resource's primary role and number of active projects. For
example, if you choose to view a global resource team that includes a combination of
resources within and outside of your resource access node, you see only the team members
to which you have access. If you choose to view a resource team that is available only to you,
all resources that you added to the team are listed.
ix) Open Requests for Resources Portlet :-
The Open Requests for Resources portlet enables you to see which roles require
staffing at any time in your projects. You can organize and filter the portlet data to focus on
the roles and projects that interest you. You can then access resource staffing features that
enable you to search for and assign the best resources to staff a role.
x) Resource Analysis Chart Portlet :-
The Resource Analysis Chart portlet enables you to view, in a variety of chart formats,
total (remaining plus actuals) units or costs for a resource, resource team, or resource code
you select. The histograms display resource data summarized by calendar in weekly increments. While the
option to create charts with data summarized by financial period is unavailable from the portlet, you can
create histograms and other charts with data summarized by calendar period or financial period on
the Resource Analysis tab of the Resource Analysis page.
XI) My Projects Portlet :-
The My Projects portlet displays summaries for projects you are assigned to as a
resource or as an activity owner. The portlet displays the project start and finish dates,
current percent complete, date last summarized, and the project owner .The link to the
project name enables you to open the project in the Projects section
xii) My Activities Portlet :-
For the portfolio, project, or project code filter criteria specified for a dashboard, the
My Activities portlet lists activities to which you are either assigned as a resource or
designated as the activity owner. The portlet displays activities based on assignment dates
and your current portlet customization settings.
xiii) My Risks Portlet :-
For the portfolio, project, or project code filter criteria specified for a dashboard, the
My Risks portlet displays information about risks you are associated with. You can customize
the portlet to specify the columns of information you want to display, as well as the types of
risks you want to appear.
xiv) My Issues Portlet :-
Using this portlet we can view information about issues with which you are associated . The
information that appears depends on the display format and customize options you select.
xv) Communication Center Portlet :-
The Communication Center portlet enables you to share data and communicate with
other P6 Web Access users who are associated with a project, including the project owner. All
projects you are associated with are listed in the portlet; you can choose to communicate with
all of a project's team members, or with members you select.
xvi) My calendar portlet :-
The Calendar portlet enables you to see a week's worth of activities that pertain to
your projects. In a dashboard, the My Calendar portlet displays all activities that you are
either assigned to as a resource or designated as the activity owner. Display the current
week or click past or future dates to see the list of activities and milestones for the selected
week .
xvii) Portfolio Views Portlets :-
The Portfolio View portlet enables you to display a portfolio view on a dashboard to
help analyze data for a particular project group, or project. Depending on your information
needs, you can customize the portlet to analyze data in either a chart or scorecard format,
and you can choose the exact data fields you want to display in the view. When displaying a
scorecard in the portlet, you can also add and delete projects and edit some project data.

Mais conteúdo relacionado

Destaque

Destaque (15)

Recurring task IN MS project
Recurring task IN MS project Recurring task IN MS project
Recurring task IN MS project
 
Uses of Project Status field
Uses of  Project Status field Uses of  Project Status field
Uses of Project Status field
 
Oracle Primavera P6 PRO R8 Tips & tricks
Oracle Primavera P6 PRO R8 Tips & tricksOracle Primavera P6 PRO R8 Tips & tricks
Oracle Primavera P6 PRO R8 Tips & tricks
 
Tested configuration for different Primavera versions
Tested configuration for different Primavera versionsTested configuration for different Primavera versions
Tested configuration for different Primavera versions
 
User preference Option in Oracle Primavera EPPM P6
User preference Option in Oracle Primavera EPPM P6User preference Option in Oracle Primavera EPPM P6
User preference Option in Oracle Primavera EPPM P6
 
Team member in iphones and android
Team member in iphones and androidTeam member in iphones and android
Team member in iphones and android
 
Oracle Primavera contractor
Oracle Primavera  contractorOracle Primavera  contractor
Oracle Primavera contractor
 
Primavera manual
Primavera manual Primavera manual
Primavera manual
 
Oracle Primavera Team member 8.3
Oracle Primavera Team member 8.3Oracle Primavera Team member 8.3
Oracle Primavera Team member 8.3
 
Login methodology for Primavera V8.3 (EPPM)
Login methodology for Primavera V8.3 (EPPM)Login methodology for Primavera V8.3 (EPPM)
Login methodology for Primavera V8.3 (EPPM)
 
Oracle Primavera contract management
Oracle Primavera  contract managementOracle Primavera  contract management
Oracle Primavera contract management
 
S Curves Made Easy With Primavera P6
S Curves Made Easy With Primavera P6S Curves Made Easy With Primavera P6
S Curves Made Easy With Primavera P6
 
Difference between versions of primavera 6,7,R8.1,R8.2,R8.3
Difference between versions of primavera 6,7,R8.1,R8.2,R8.3Difference between versions of primavera 6,7,R8.1,R8.2,R8.3
Difference between versions of primavera 6,7,R8.1,R8.2,R8.3
 
Activity Duration Types Explained with example in Primavera
Activity Duration Types Explained with example in PrimaveraActivity Duration Types Explained with example in Primavera
Activity Duration Types Explained with example in Primavera
 
Pert master risk analysis tool
Pert master   risk analysis toolPert master   risk analysis tool
Pert master risk analysis tool
 

Semelhante a Primavera portlets

Project and Portfolio Management Training
Project and Portfolio Management TrainingProject and Portfolio Management Training
Project and Portfolio Management Training
Digite, Inc.
 
Modelingprogramstructure
ModelingprogramstructureModelingprogramstructure
Modelingprogramstructure
learnt
 
Info461ProjectCharterEskridgeAs08
Info461ProjectCharterEskridgeAs08Info461ProjectCharterEskridgeAs08
Info461ProjectCharterEskridgeAs08
Greg Eskridge
 
Mgmt404 entire class course project + all 7 weeks i labs devry university
Mgmt404 entire class course project + all 7 weeks i labs devry universityMgmt404 entire class course project + all 7 weeks i labs devry university
Mgmt404 entire class course project + all 7 weeks i labs devry university
dgahdazncvn
 
Mgmt404 entire class course project + all 7 weeks i labs devry university
Mgmt404 entire class course project + all 7 weeks i labs devry universityMgmt404 entire class course project + all 7 weeks i labs devry university
Mgmt404 entire class course project + all 7 weeks i labs devry university
scorpiosns123
 

Semelhante a Primavera portlets (20)

About metacost
About metacostAbout metacost
About metacost
 
Companion by Minitab - Desktop App
Companion by Minitab - Desktop AppCompanion by Minitab - Desktop App
Companion by Minitab - Desktop App
 
What's New In InCites
What's New In InCitesWhat's New In InCites
What's New In InCites
 
SAP PS overview
SAP PS overviewSAP PS overview
SAP PS overview
 
Resource planning for QC labs, R&D, RA, or multi- project environments
Resource planning for QC labs, R&D, RA, or multi- project environmentsResource planning for QC labs, R&D, RA, or multi- project environments
Resource planning for QC labs, R&D, RA, or multi- project environments
 
Project Planning Board Overview_SAP PS.pptx
Project Planning Board Overview_SAP PS.pptxProject Planning Board Overview_SAP PS.pptx
Project Planning Board Overview_SAP PS.pptx
 
Project Share Feature List - MS Project Services
Project Share Feature List - MS Project ServicesProject Share Feature List - MS Project Services
Project Share Feature List - MS Project Services
 
Project and Portfolio Management Training
Project and Portfolio Management TrainingProject and Portfolio Management Training
Project and Portfolio Management Training
 
Eresource nfra project management
Eresource nfra project managementEresource nfra project management
Eresource nfra project management
 
Modelingprogramstructure
ModelingprogramstructureModelingprogramstructure
Modelingprogramstructure
 
FACT V4 Spreading
FACT V4 SpreadingFACT V4 Spreading
FACT V4 Spreading
 
Primavera P6 EPPM Portlets Index
Primavera P6 EPPM Portlets IndexPrimavera P6 EPPM Portlets Index
Primavera P6 EPPM Portlets Index
 
Info461ProjectCharterEskridgeAs08
Info461ProjectCharterEskridgeAs08Info461ProjectCharterEskridgeAs08
Info461ProjectCharterEskridgeAs08
 
Day 1 - 3PM Revision
Day 1 - 3PM RevisionDay 1 - 3PM Revision
Day 1 - 3PM Revision
 
Kovair ALM and DevOps Reports and Dashboards - Product literature
Kovair ALM and DevOps Reports and Dashboards - Product literatureKovair ALM and DevOps Reports and Dashboards - Product literature
Kovair ALM and DevOps Reports and Dashboards - Product literature
 
Project Report Introduction
Project Report IntroductionProject Report Introduction
Project Report Introduction
 
Team Contract
Team ContractTeam Contract
Team Contract
 
]project-open[ Budget Planning and Tracking
]project-open[ Budget Planning and Tracking]project-open[ Budget Planning and Tracking
]project-open[ Budget Planning and Tracking
 
Mgmt404 entire class course project + all 7 weeks i labs devry university
Mgmt404 entire class course project + all 7 weeks i labs devry universityMgmt404 entire class course project + all 7 weeks i labs devry university
Mgmt404 entire class course project + all 7 weeks i labs devry university
 
Mgmt404 entire class course project + all 7 weeks i labs devry university
Mgmt404 entire class course project + all 7 weeks i labs devry universityMgmt404 entire class course project + all 7 weeks i labs devry university
Mgmt404 entire class course project + all 7 weeks i labs devry university
 

Mais de CADD Centre Software Solutions Private Limited

Mais de CADD Centre Software Solutions Private Limited (7)

A b-c-d-(e) of ccsspl corporate presentation
A b-c-d-(e) of ccsspl corporate presentationA b-c-d-(e) of ccsspl corporate presentation
A b-c-d-(e) of ccsspl corporate presentation
 
CPCL Case study
CPCL Case studyCPCL Case study
CPCL Case study
 
Oracle primavera Universal content management
Oracle primavera Universal content management Oracle primavera Universal content management
Oracle primavera Universal content management
 
Features comparison between Primavera and Microsoft Project
Features comparison between Primavera and Microsoft ProjectFeatures comparison between Primavera and Microsoft Project
Features comparison between Primavera and Microsoft Project
 
Project management software consulting
Project management software consultingProject management software consulting
Project management software consulting
 
Oracle Autovue
Oracle AutovueOracle Autovue
Oracle Autovue
 
Primavera vs microsoft project
Primavera vs microsoft projectPrimavera vs microsoft project
Primavera vs microsoft project
 

Último

Artificial Intelligence: Facts and Myths
Artificial Intelligence: Facts and MythsArtificial Intelligence: Facts and Myths
Artificial Intelligence: Facts and Myths
Joaquim Jorge
 

Último (20)

Strategies for Landing an Oracle DBA Job as a Fresher
Strategies for Landing an Oracle DBA Job as a FresherStrategies for Landing an Oracle DBA Job as a Fresher
Strategies for Landing an Oracle DBA Job as a Fresher
 
Bajaj Allianz Life Insurance Company - Insurer Innovation Award 2024
Bajaj Allianz Life Insurance Company - Insurer Innovation Award 2024Bajaj Allianz Life Insurance Company - Insurer Innovation Award 2024
Bajaj Allianz Life Insurance Company - Insurer Innovation Award 2024
 
TrustArc Webinar - Unlock the Power of AI-Driven Data Discovery
TrustArc Webinar - Unlock the Power of AI-Driven Data DiscoveryTrustArc Webinar - Unlock the Power of AI-Driven Data Discovery
TrustArc Webinar - Unlock the Power of AI-Driven Data Discovery
 
How to Troubleshoot Apps for the Modern Connected Worker
How to Troubleshoot Apps for the Modern Connected WorkerHow to Troubleshoot Apps for the Modern Connected Worker
How to Troubleshoot Apps for the Modern Connected Worker
 
The 7 Things I Know About Cyber Security After 25 Years | April 2024
The 7 Things I Know About Cyber Security After 25 Years | April 2024The 7 Things I Know About Cyber Security After 25 Years | April 2024
The 7 Things I Know About Cyber Security After 25 Years | April 2024
 
From Event to Action: Accelerate Your Decision Making with Real-Time Automation
From Event to Action: Accelerate Your Decision Making with Real-Time AutomationFrom Event to Action: Accelerate Your Decision Making with Real-Time Automation
From Event to Action: Accelerate Your Decision Making with Real-Time Automation
 
Handwritten Text Recognition for manuscripts and early printed texts
Handwritten Text Recognition for manuscripts and early printed textsHandwritten Text Recognition for manuscripts and early printed texts
Handwritten Text Recognition for manuscripts and early printed texts
 
Exploring the Future Potential of AI-Enabled Smartphone Processors
Exploring the Future Potential of AI-Enabled Smartphone ProcessorsExploring the Future Potential of AI-Enabled Smartphone Processors
Exploring the Future Potential of AI-Enabled Smartphone Processors
 
A Domino Admins Adventures (Engage 2024)
A Domino Admins Adventures (Engage 2024)A Domino Admins Adventures (Engage 2024)
A Domino Admins Adventures (Engage 2024)
 
04-2024-HHUG-Sales-and-Marketing-Alignment.pptx
04-2024-HHUG-Sales-and-Marketing-Alignment.pptx04-2024-HHUG-Sales-and-Marketing-Alignment.pptx
04-2024-HHUG-Sales-and-Marketing-Alignment.pptx
 
Tech Trends Report 2024 Future Today Institute.pdf
Tech Trends Report 2024 Future Today Institute.pdfTech Trends Report 2024 Future Today Institute.pdf
Tech Trends Report 2024 Future Today Institute.pdf
 
Artificial Intelligence: Facts and Myths
Artificial Intelligence: Facts and MythsArtificial Intelligence: Facts and Myths
Artificial Intelligence: Facts and Myths
 
Boost PC performance: How more available memory can improve productivity
Boost PC performance: How more available memory can improve productivityBoost PC performance: How more available memory can improve productivity
Boost PC performance: How more available memory can improve productivity
 
Mastering MySQL Database Architecture: Deep Dive into MySQL Shell and MySQL R...
Mastering MySQL Database Architecture: Deep Dive into MySQL Shell and MySQL R...Mastering MySQL Database Architecture: Deep Dive into MySQL Shell and MySQL R...
Mastering MySQL Database Architecture: Deep Dive into MySQL Shell and MySQL R...
 
A Year of the Servo Reboot: Where Are We Now?
A Year of the Servo Reboot: Where Are We Now?A Year of the Servo Reboot: Where Are We Now?
A Year of the Servo Reboot: Where Are We Now?
 
ProductAnonymous-April2024-WinProductDiscovery-MelissaKlemke
ProductAnonymous-April2024-WinProductDiscovery-MelissaKlemkeProductAnonymous-April2024-WinProductDiscovery-MelissaKlemke
ProductAnonymous-April2024-WinProductDiscovery-MelissaKlemke
 
Tata AIG General Insurance Company - Insurer Innovation Award 2024
Tata AIG General Insurance Company - Insurer Innovation Award 2024Tata AIG General Insurance Company - Insurer Innovation Award 2024
Tata AIG General Insurance Company - Insurer Innovation Award 2024
 
Workshop - Best of Both Worlds_ Combine KG and Vector search for enhanced R...
Workshop - Best of Both Worlds_ Combine  KG and Vector search for  enhanced R...Workshop - Best of Both Worlds_ Combine  KG and Vector search for  enhanced R...
Workshop - Best of Both Worlds_ Combine KG and Vector search for enhanced R...
 
Automating Google Workspace (GWS) & more with Apps Script
Automating Google Workspace (GWS) & more with Apps ScriptAutomating Google Workspace (GWS) & more with Apps Script
Automating Google Workspace (GWS) & more with Apps Script
 
HTML Injection Attacks: Impact and Mitigation Strategies
HTML Injection Attacks: Impact and Mitigation StrategiesHTML Injection Attacks: Impact and Mitigation Strategies
HTML Injection Attacks: Impact and Mitigation Strategies
 

Primavera portlets

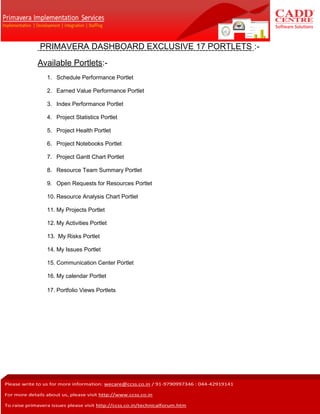
  • 1. PRIMAVERA DASHBOARD EXCLUSIVE 17 PORTLETS :- Available Portlets:- 1. Schedule Performance Portlet 2. Earned Value Performance Portlet 3. Index Performance Portlet 4. Project Statistics Portlet 5. Project Health Portlet 6. Project Notebooks Portlet 7. Project Gantt Chart Portlet 8. Resource Team Summary Portlet 9. Open Requests for Resources Portlet 10. Resource Analysis Chart Portlet 11. My Projects Portlet 12. My Activities Portlet 13. My Risks Portlet 14. My Issues Portlet 15. Communication Center Portlet 16. My calendar Portlet 17. Portfolio Views Portlets
  • 2. i) Schedule Performance Portlet :- Schedule Performance portlet displays both current and forecast schedule summary performance information, in either costs or labor units. Positive performance schedule values indicate that the project is ahead of schedule; negative values indicate that the project is behind schedule. Positive performance cost values indicate that the project is under budget; negative values indicate that the project is over budget. ii) Earned Value Performance Portlet :- The Earned Value Performance portlet displays both current and forecast earned value schedule variance (SV), cost variance (CV), and labor unit variance calculations. Data are calculated and displayed in either costs or labor units, depending on your preference. Negative values indicate unfavorable performance.
  • 3. iii) Index Performance Portlet :- The Index Performance portlet displays schedule performance index (SPI), cost performance index (CPI), and to complete performance index (TCPI) calculations  SPI indicates whether you are meeting earned and planned values within your schedule.  CPI indicates whether you have spent money over the budget to date.  TCPI enables you to determine the level of performance needed to achieve the cost or time objectives. iv) Project Statistics Portlet :- The Project Statistics portlet enables you to analyze project information in row and column format for a particular project or project group.In a dashboard, the portlet displays the information you select down to the WBS level for all projects included in the current dashboard filter. For example, if you filter a dashboard by a portfolio, the Project Statistics portlet displays data for all projects included in that portfolio.  In a project workspace, the portlet displays the information you select down to the WBS level for the currently open project.
  • 4. v) Project Health Portlet :- The Project Health portlet enables you to quickly see how well a portfolio or individual project is performing. Status indicators are based on performance thresholds you set in Global Preferences. You can set performance thresholds to correspond to each of the status indicators. vi) Project Notebooks Portlet :- The Project Notebooks portlet displays all of the notebook items assigned to the selected project. It displays all of the notebook items assigned to the projects that meet the dashboard's selected filter criteria. Notebooks are used to set up general categories for information relating to activity, project, EPS, and WBS notes. Vii) Project Gantt chart portlet :- Use the Project Gantt Chart portlet to quickly view the status of projects and review each project's milestones. The project table on the left side of the portlet lists projects that meet the portfolio, project code value, or project filter criteria specified in the dashboard's Filter by field. You can filter the milestones that display in the portlet by selecting an activity code filter.
  • 5. The Gantt Chart on the right side of the portlet displays a bar for each project, which represents the span between the Planned Start and Scheduled Finish dates of the project. The blue section of each project bar indicates current progress, while the green section of each bar indicates remaining effort. viii) Resource Team Summary Portlet :- The Resource Team Summary portlet enables you to view the resources that belong to a team you select, including each resource's primary role and number of active projects. For example, if you choose to view a global resource team that includes a combination of resources within and outside of your resource access node, you see only the team members to which you have access. If you choose to view a resource team that is available only to you, all resources that you added to the team are listed.
  • 6. ix) Open Requests for Resources Portlet :- The Open Requests for Resources portlet enables you to see which roles require staffing at any time in your projects. You can organize and filter the portlet data to focus on the roles and projects that interest you. You can then access resource staffing features that enable you to search for and assign the best resources to staff a role. x) Resource Analysis Chart Portlet :- The Resource Analysis Chart portlet enables you to view, in a variety of chart formats, total (remaining plus actuals) units or costs for a resource, resource team, or resource code you select. The histograms display resource data summarized by calendar in weekly increments. While the option to create charts with data summarized by financial period is unavailable from the portlet, you can create histograms and other charts with data summarized by calendar period or financial period on the Resource Analysis tab of the Resource Analysis page.
  • 7. XI) My Projects Portlet :- The My Projects portlet displays summaries for projects you are assigned to as a resource or as an activity owner. The portlet displays the project start and finish dates, current percent complete, date last summarized, and the project owner .The link to the project name enables you to open the project in the Projects section xii) My Activities Portlet :- For the portfolio, project, or project code filter criteria specified for a dashboard, the My Activities portlet lists activities to which you are either assigned as a resource or designated as the activity owner. The portlet displays activities based on assignment dates and your current portlet customization settings.
  • 8. xiii) My Risks Portlet :- For the portfolio, project, or project code filter criteria specified for a dashboard, the My Risks portlet displays information about risks you are associated with. You can customize the portlet to specify the columns of information you want to display, as well as the types of risks you want to appear. xiv) My Issues Portlet :- Using this portlet we can view information about issues with which you are associated . The information that appears depends on the display format and customize options you select.
  • 9. xv) Communication Center Portlet :- The Communication Center portlet enables you to share data and communicate with other P6 Web Access users who are associated with a project, including the project owner. All projects you are associated with are listed in the portlet; you can choose to communicate with all of a project's team members, or with members you select. xvi) My calendar portlet :- The Calendar portlet enables you to see a week's worth of activities that pertain to your projects. In a dashboard, the My Calendar portlet displays all activities that you are either assigned to as a resource or designated as the activity owner. Display the current week or click past or future dates to see the list of activities and milestones for the selected week .
  • 10. xvii) Portfolio Views Portlets :- The Portfolio View portlet enables you to display a portfolio view on a dashboard to help analyze data for a particular project group, or project. Depending on your information needs, you can customize the portlet to analyze data in either a chart or scorecard format, and you can choose the exact data fields you want to display in the view. When displaying a scorecard in the portlet, you can also add and delete projects and edit some project data.