Diversification: Stock Sector Correlations Increase while REIT-Stock Correlations Decline

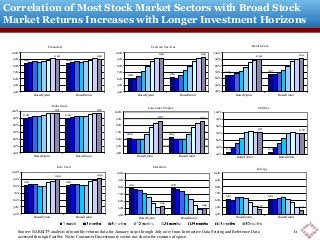
These two charts illustrate the importance of your investment horizon in evaluating diversification opportunities. Correlations are usually computed using monthly returns data, because that's what is readily available. But if your investment horizon is longer than one month, correlations based on monthly data can be very misleading: you should be using returns over longer horizons to evaluate diversification for your portfolio. The first chart shows the correlation between sector returns and returns in the broad stock market using investment horizons increasing from one month to 60 months (five years). Most sectors show what I call an "upward-sloping term structure of correlations," meaning that correlations over longer investment horizons are higher than correlations based on one-month returns. For example, one-month returns suggest that Telecom stocks have provided good diversification against the rest of the stock market, with a correlation of just 0.60 since the beginning of 1990--but over five-year periods the correlation between the Telecom sector and the broad market has actually been 0.93, meaning that Telecom stocks have provided very little diversification for retirement investors, endowments, foundations, and other investors with longer horizons. In essence, while events specific to a given sector matter in the short run, in the long run you're just getting exposure to the business (stock market) cycle and it doesn't matter whether you get that exposure through Telecom stocks, Financial stocks, Industrial stocks, or others. The only exceptions are the Energy sector and the Basic Materials sector, which have had a "downward-sloping term structure of correlations" with lower correlations over longer horizons. That's because Energy and Basic Materials stocks generally give exposure to a separate asset class, the Commodities asset class, even though the exposure comes through the stock market. The other major exception is shown on the second slide: listed equity REITs have had a very strongly downward-sloping term structure of correlations. In fact, the REIT-stock correlation over five-year horizons is only in the 0.25-0.35 range, meaning that investors with long horizons have benefited tremendously from the power of diversification. That's because REITs, too, give exposure to a very different asset class--the Real Estate asset class--even though the exposure comes through the stock market. Questions? Contact me at bcase@nareit.com.

Recommended
Recommended
More Related Content
More from Brad Case, PhD, CFA, CAIA
More from Brad Case, PhD, CFA, CAIA (10)
Recently uploaded
Recently uploaded (20)
Diversification: Stock Sector Correlations Increase while REIT-Stock Correlations Decline
- 1. 0.61 0.61 0.46 0.46 40% 50% 60% 70% 80% 90% 100% Russell 3000 Russell 1000 Energy 0.42 0.42 0.71 0.70 40% 50% 60% 70% 80% 90% 100% Russell 3000 Russell 1000 Utilities 0.60 0.61 0.92 0.93 40% 50% 60% 70% 80% 90% 100% Russell 3000 Russell 1000 Telecom Services Correlation of Most Stock Market Sectors with Broad Stock Market Returns Increases with Longer Investment Horizons Source: NAREIT® analysis of monthly returns data for January 1990 through July 2017 from Interactive Data Pricing and Reference Data accessed through FactSet. Note: Consumer Discretionary sector not shown for reasons of space. 0.65 0.67 0.90 0.91 40% 50% 60% 70% 80% 90% 100% Russell 3000 Russell 1000 Health Care 0.81 0.81 0.90 0.92 40% 50% 60% 70% 80% 90% 100% Russell 3000 Russell 1000 Info Tech 0.79 0.78 0.52 0.49 40% 50% 60% 70% 80% 90% 100% Russell 3000 Russell 1000 Materials 0 0.62 0.63 0.87 0.87 40% 50% 60% 70% 80% 90% 100% Russell 3000 Russell 1000 Consumer Staples 0.90 0.90 0.97 0.97 40% 50% 60% 70% 80% 90% 100% Russell 3000 Russell 1000 Industrials 0.83 0.84 0.90 0.90 40% 50% 60% 70% 80% 90% 100% Russell 3000 Russell 1000 Financials
- 2. 0.61 0.72 0.74 0.70 0.60 0.49 0.40 0.36 0% 10% 20% 30% 40% 50% 60% 70% 80% CorrelationwithReturnsonPubliclyTradedEquityREITs Correlations Between REITs and S&P Financial Sector Index 1 3 6 12 24 36 48 60 0.58 0.65 0.66 0.58 0.49 0.41 0.34 0.27 0% 10% 20% 30% 40% 50% 60% 70% 80% CorrelationwithReturnsonPubliclyTradedEquityREITs Correlations Between REITs and Russell 3000 US Total Market Index 1 3 6 12 24 36 48 60 0.57 0.64 0.65 0.56 0.46 0.38 0.31 0.24 0% 10% 20% 30% 40% 50% 60% 70% 80% CorrelationwithReturnsonPubliclyTradedEquityREITs Correlations Between REITs and Russell 1000 Large-Cap Stock Index 1 3 6 12 24 36 48 60 REIT-Stock Correlations Decline as Investment Horizon Lengthens Source: NAREIT® analysis of monthly returns data for January 1990 through July 2017 from Interactive Data Pricing and Reference Data accessed through FactSet. Equity REITs were part of the S&P Financial Sector until July 2017. • Declining REIT-stock correlation over increasing investment horizons indicates that asset returns increasingly differ as spillover (mispricing) effects are corrected • Declining correlation as errors are corrected is a sign that underlying return drivers are fundamentally different—that is, REITs and non-REIT stocks represent different asset classes 1