Monitoring .NET Applications with New Relic RPM
•
4 gostaram•2,722 visualizações

The document discusses how to monitor .NET applications using New Relic RPM. It explains that the New Relic RPM agent collects performance metrics from .NET applications and sends them to the New Relic service. Users can then sign up for a free RPM account, download and install the .NET agent to begin seeing performance metrics for their application within minutes in the New Relic user interface. The interface provides various dashboards and reports to help users track application performance, errors, database queries and more.

Recomendados
Recomendados
Mais conteúdo relacionado
Mais procurados
Mais procurados (20)
Destaque
Semelhante a Monitoring .NET Applications with New Relic RPM
Semelhante a Monitoring .NET Applications with New Relic RPM (20)
Monitoring .NET Applications with New Relic RPM
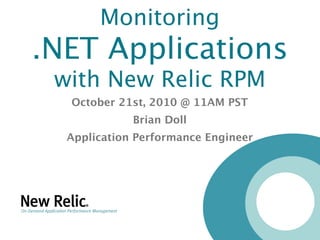
- 1. Monitoring .NET Applications with New Relic RPM October 21st, 2010 @ 11AM PST Brian Doll Application Performance Engineer
- 2. RPM Monitors, Troubleshoots, and Tunes Web Applications In the Cloud or in the Datacenter NewRelic.com
- 3. How New Relic RPM Works a! a! a! a! Https Applications New Relic Service Https ๏ Secure, reliable service ๏ No private user data ๏ View app performance from anywhere App Team NewRelic.com
- 4. Now supporting Ruby, Java, .NET and PHP a! a! a! a! NewRelic.com
- 5. Let’s get started with the New Relic .NET Agent NewRelic.com
- 6. First, sign up for your FREE RPM account NewRelic.com
- 7. Then download and run the installer... NewRelic.com
- 8. If you already have an account, download the .NET agent from the Support page NewRelic.com
- 9. You can find your License Key online in your RPM account NewRelic.com
- 10. After restarting IIS you will start seeing performance metrics right away NewRelic.com
- 11. Now that we’re sending data, we can log into New Relic RPM to see how we’re doing a! a! a! a! Https Applications New Relic Service Https NewRelic.com
- 12. Account Overview NewRelic.com
- 13. Application Overview NewRelic.com
- 14. Host Breakdown NewRelic.com
- 15. Web Transactions NewRelic.com
- 16. Web Transactions (Detail) NewRelic.com
- 17. Web Transactions (Detail) NewRelic.com
- 18. Web Transactions (Detail) NewRelic.com
- 19. Web Transactions (Table) NewRelic.com
- 20. Database Metrics NewRelic.com
- 21. Query Details NewRelic.com
- 22. Transaction Traces NewRelic.com
- 23. Transaction Traces / SQL NewRelic.com
- 24. Error Tracking NewRelic.com
- 25. Scalability Analysis NewRelic.com
- 26. What have we learned? RPM now supports Ruby, Java, .NET and PHP You can begin to see .NET metrics in minutes RPM is awesome and gets more awesome every week Production monitoring of .NET applications will blow you away, and you’ll wonder how you ever lived without it! NewRelic.com
- 27. Any Questions? Live Q&A during the webinar http://support.newrelic.com/ Email: support@newrelic.com Twitter: @NewRelic IRC: #NewRelic on Freenode NewRelic.com