External Trade A mixed bag of data

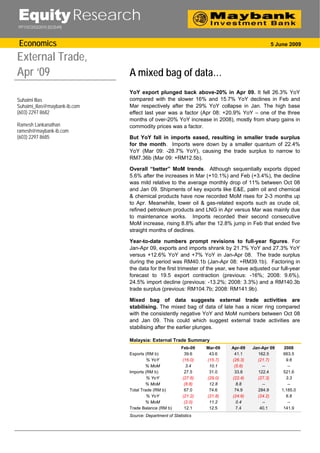
YoY export plunged back above-20% in Apr 09. It fell 26.3% YoY compared with the slower 16% and 15.7% YoY declines in Feb and Mar respectively after the 29% YoY collapse in Jan. The high base effect last year was a factor (Apr 08: +20.9% YoY – one of the three months of over-20% YoY increase in 2008), mostly from sharp gains in commodity prices was a factor. But YoY fall in imports eased, resulting in smaller trade surplus for the month. Imports were down by a smaller quantum of 22.4% YoY (Mar 09: -28.7% YoY), causing the trade surplus to narrow to RM7.36b (Mar 09: +RM12.5b). Overall “better” MoM trends. Although sequentially exports dipped 5.6% after the increases in Mar (+10.1%) and Feb (+3.4%), the decline was mild relative to the average monthly drop of 11% between Oct 08 and Jan 09. Shipments of key exports like E&E, palm oil and chemical & chemical products have now recorded MoM rises for 2-3 months up to Apr. Meanwhile, lower oil & gas-related exports such as crude oil, refined petroleum products and LNG in Apr versus Mar was mainly due to maintenance works. Imports recorded their second consecutive MoM increase, rising 8.8% after the 12.8% jump in Feb that ended five straight months of declines. Year-to-date numbers prompt revisions to full-year figures. For Jan-Apr 09, exports and imports shrank by 21.7% YoY and 27.3% YoY versus +12.6% YoY and +7% YoY in Jan-Apr 08. The trade surplus during the period was RM40.1b (Jan-Apr 08: +RM39.1b). Factoring in the data for the first trimester of the year, we have adjusted our full-year forecast to 19.5 export contraction (previous: -16%; 2008: 9.6%), 24.5% import decline (previous: -13.2%; 2008: 3.3%) and a RM140.3b trade surplus (previous: RM104.7b; 2008: RM141.9b). Mixed bag of data suggests external trade activities are stabilising. The mixed bag of data of late has a nicer ring compared with the consistently negative YoY and MoM numbers between Oct 08 and Jan 09. This could which suggest external trade activities are stabilising after the earlier plunges.

Recommended
More Related Content
More from Boyboy cute
More from Boyboy cute (20)
Recently uploaded
Recently uploaded (20)
External Trade A mixed bag of data
- 1. Equity Research PP11072/03/2010 (023549) Economics 5 June 2009 External Trade, Apr ‘09 A mixed bag of data… YoY export plunged back above-20% in Apr 09. It fell 26.3% YoY Suhaimi Ilias compared with the slower 16% and 15.7% YoY declines in Feb and Suhaimi_ilias@maybank-ib.com Mar respectively after the 29% YoY collapse in Jan. The high base (603) 2297 8682 effect last year was a factor (Apr 08: +20.9% YoY – one of the three months of over-20% YoY increase in 2008), mostly from sharp gains in Ramesh Lankanathan commodity prices was a factor. ramesh@maybank-ib.com (603) 2297 8685 But YoY fall in imports eased, resulting in smaller trade surplus for the month. Imports were down by a smaller quantum of 22.4% YoY (Mar 09: -28.7% YoY), causing the trade surplus to narrow to RM7.36b (Mar 09: +RM12.5b). Overall “better” MoM trends. Although sequentially exports dipped 5.6% after the increases in Mar (+10.1%) and Feb (+3.4%), the decline was mild relative to the average monthly drop of 11% between Oct 08 and Jan 09. Shipments of key exports like E&E, palm oil and chemical & chemical products have now recorded MoM rises for 2-3 months up to Apr. Meanwhile, lower oil & gas-related exports such as crude oil, refined petroleum products and LNG in Apr versus Mar was mainly due to maintenance works. Imports recorded their second consecutive MoM increase, rising 8.8% after the 12.8% jump in Feb that ended five straight months of declines. Year-to-date numbers prompt revisions to full-year figures. For Jan-Apr 09, exports and imports shrank by 21.7% YoY and 27.3% YoY versus +12.6% YoY and +7% YoY in Jan-Apr 08. The trade surplus during the period was RM40.1b (Jan-Apr 08: +RM39.1b). Factoring in the data for the first trimester of the year, we have adjusted our full-year forecast to 19.5 export contraction (previous: -16%; 2008: 9.6%), 24.5% import decline (previous: -13.2%; 2008: 3.3%) and a RM140.3b trade surplus (previous: RM104.7b; 2008: RM141.9b). Mixed bag of data suggests external trade activities are stabilising. The mixed bag of data of late has a nicer ring compared with the consistently negative YoY and MoM numbers between Oct 08 and Jan 09. This could which suggest external trade activities are stabilising after the earlier plunges. Malaysia: External Trade Summary Feb-09 Mar-09 Apr-09 Jan-Apr 09 2008 Exports (RM b) 39.6 43.6 41.1 162.5 663.5 % YoY (16.0) (15.7) (26.3) (21.7) 9.6 % MoM 3.4 10.1 (5.6) -- -- Imports (RM b) 27.5 31.0 33.8 122.4 521.6 % YoY (27.6) (29.0) (22.4) (27.3) 3.3 % MoM (8.8) 12.8 8.8 -- -- Total Trade (RM b) 67.0 74.6 74.9 284.9 1,185.0 % YoY (21.2) (21.8) (24.6) (24.2) 6.8 % MoM (2.0) 11.2 0.4 -- -- Trade Balance (RM b) 12.1 12.5 7.4 40.1 141.9 Source: Department of Statistics
- 2. External Trade, Apr 09 Malaysia: Export Growth, Import Growth & Trade Balance 50 40 30 20 10 0 Sep-03 Sep-04 Sep-05 Sep-06 Sep-07 Sep-08 Jan-03 Jan-04 Jan-05 Jan-06 Jan-07 Jan-08 Jan-09 May-03 May-04 May-05 May-06 May-07 May-08 (10) (20) (30) (40) Trade Balance (RM b) Exports (% YoY) Imports (% YoY) Source: Department of Statistics Forward-looking indicators further point to improving external trade conditions. China’s and Singapore’s purchasing managers’ new export orders index picked up in recent months, while Taiwan’s exports orders rose three months in a row to USD25.1b in Apr 09 after plunging from the high of USD32.1b in Aug 08 to USD17.7b in Jan 09. In addition, Malaysia’s imports of intermediate goods rebounded strongly MoM in Apr (+11.7%) and Mar (+10.4%) after five months of contractions. China, Taiwan, Singapore: Export Order Indicators 65 30 60 20 55 10 50 0 45 (10) 40 (20) 35 30 (30) 25 (40) 20 (50) Sep-07 Nov-07 Sep-08 Nov-08 Jan-07 Jan-08 Jan-09 Jul-07 Jul-08 May-07 May-08 May-09 Mar-07 Mar-08 Mar-09 China: New Export Orders Index Singapore: New Export Orders Index Taiwan: Export Orders (% YoY) Source: Department of Statistics Malaysia: Imports of Intermediate Goods 80 60 40 20 0 Oct-01 Oct-06 Apr-99 Apr-04 Feb-00 Jul-00 Feb-05 Jul-05 May-01 May-06 Jan-98 Jun-98 Jan-03 Jun-03 Jan-08 Jun-08 Nov-98 Sep-99 Dec-00 Aug-02 Dec-05 Nov-03 Sep-04 Aug-07 Nov-08 Mar-02 Mar-07 (20) % YoY % MoM (40) Source: Department of Statistics 5 June 2009 Page 2 of 4
- 3. External Trade, Apr 09 Malaysia: Export Value (RM b) By Products & Commodities Feb-08 Mar-08 Apr -08 Feb-09 Mar-09 Apr -09 Electrical & Electronics (E&E) 17.6 17.4 22.1 14.7 17.0 17.0 Chemicals & Chemical Products 2.9 3.2 3.6 2.3 2.4 2.7 Crude Petroleum 3.6 3.5 3.4 1.5 1.9 1.5 LNG 2.7 2.9 2.5 3.9 3.6 1.9 Palm Oil 3.8 4.9 4.6 2.6 3.0 3.0 Machinery, Appliances & Parts 1.7 2.0 2.0 1.6 1.6 1.5 Wood Products 1.1 1.3 1.3 1.0 1.1 1.1 Refined Petroleum Products 2.3 2.9 2.8 1.8 1.7 1.3 Manufactures of Metal 1.4 2.3 1.6 1.0 1.3 1.2 By Markets ASEAN 12.5 13.7 14.4 9.9 10.9 8.2 USA 6.0 6.3 7.9 4.1 4.6 4.9 EU 6.3 5.7 6.0 4.1 4.6 4.5 Japan 5.0 5.4 5.5 4.9 4.5 3.7 China 3.8 4.3 5.6 4.1 5.3 5.1 S. Korea 2.3 2.5 2.2 1.9 2.2 1.5 Hong Kong 1.6 1.7 2.7 1.9 2.3 2.3 Source: Department of Statistics Global: Exports in USD (% YoY) Aug-08 Sep-08 Oct-08 Nov-08 Dec-08 Jan-09 Feb-09 Mar-09 Apr -09 US 17.1 9.3 5.1 (5.4) (11.5) (21.1) (24.0) (22.1) - EU 4.9 7.9 (11.8) (23.6) (7.9) (35.2) (35.9) (30.3) - Germany 4.2 5.2 (11.4) (24.4) (12.3) (33.7) (35.9) (29.5) - Japan 6.8 9.7 8.0 (15.0) (20.0) (35.7) (46.2) (45.3) (35.7) UK 2.5 1.0 (13.7) (25.0) (23.8) (33.6) (33.0) (34.0) - Canada 12.1 18.0 19.3 4.6 1.7 (20.8) (18.3) - - Mexico 5.5 8.4 (6.4) (16.7) (19.7) (31.5) (29.5) (25.1) (35.6) Australia 46.2 43.0 26.2 14.3 10.2 (11.2) (4.4) (1.3) - China 21.1 21.4 19.1 (2.2) (2.8) (17.5) (25.7) (17.1) (22.6) Russia 44.5 61.7 7.6 (15.7) (25.3) (49.5) (46.2) (47.0) - India 26.9 10.4 (12.1) (9.9) (3.5) (19.1) (24.3) (37.7) - Brazil 30.8 41.3 17.4 5.0 (2.9) (26.3) (25.1) (6.4) (12.3) S. Korea 18.1 27.6 7.8 (19.5) (17.9) (34.2) (18.5) (22.0) (19.0) Taiwan 18.2 (1.6) (8.3) (23.3) (42.0) (44.1) (28.5) (35.7) (34.2) Singapore 15.8 15.3 (6.4) (15.7) (20.3) (41.7) (31.2) (28.2) (32.1) Hong Kong 1.8 3.6 9.5 (4.8) (10.8) (21.4) (22.8) (20.8) (17.8) Malaysia 14.2 13.9 (8.3) (11.9) (18.7) (35.3) (27.6) (26.0) (34.7) Thailand 15.5 19.5 4.7 (17.7) (15.7) (25.0) (10.2) (22.0) (24.6) Indonesia 30.3 28.5 4.9 (2.1) (20.0) (35.5) (32.8) (27.6) (22.9) Vietnam 40.4 44.8 18.4 (6.2) 4.3 (24.3) 38.6 4.0 (2.2) Philippines 6.6 1.3 (14.4) (11.4) (40.3) (40.6) (39.1) (30.8) - * Vietnam export growth in May’09 was -26% YoY Source: Bloomberg 5 June 2009 Page 3 of 4
- 4. External Trade, Apr 09 Definition of Ratings Maybank Investment Bank Research uses the following rating system: BUY Total return is expected to be above 10% in the next 12 months HOLD Total return is expected to be between -5% to 10% in the next 12 months SELL Total return is expected to be below -5% in the next 12 months Applicability of Ratings The respective analyst maintains a coverage universe of stocks, the list of which may be adjusted according to needs. Investment ratings are only applicable to the stocks which form part of the coverage universe. Reports on companies which are not part of the coverage do not carry investment ratings as we do not actively follow developments in these companies. Some common terms abbreviated in this report (where they appear): Adex = Advertising Expenditure FCF = Free Cashflow PE = Price Earnings BV = Book Value FV = Fair Value PEG = PE Ratio To Growth CAGR = Compounded Annual Growth Rate FY = Financial Year PER = PE Ratio Capex = Capital Expenditure FYE = Financial Year End QoQ = Quarter-On-Quarter CY = Calendar Year MoM = Month-On-Month ROA = Return On Asset DCF = Discounted Cashflow NAV = Net Asset Value ROE = Return On Equity DPS = Dividend Per Share NTA = Net Tangible Asset ROSF = Return On Shareholders’ Funds EBIT = Earnings Before Interest And Tax P = Price WACC = Weighted Average Cost Of Capital EBITDA = EBIT, Depreciation And Amortisation P.A. = Per Annum YoY = Year-On-Year EPS = Earnings Per Share PAT = Profit After Tax YTD = Year-To-Date EV = Enterprise Value PBT = Profit Before Tax Disclaimer This report is for information purposes only and under no circumstances is it to be considered or intended as an offer to sell or a solicitation of an offer to buy the securities referred to herein. Investors should note that income from such securities, if any, may fluctuate and that each security’s price or value may rise or fall. Opinions or recommendations contained herein are in form of technical ratings and fundamental ratings. Technical ratings may differ from fundamental ratings as technical valuations apply different methodologies and are purely based on price and volume-related information extracted from Bursa Malaysia Securities Berhad in the equity analysis. Accordingly, investors may receive back less than originally invested. Past performance is not necessarily a guide to future performance. This report is not intended to provide personal investment advice and does not take into account the specific investment objectives, the financial situation and the particular needs of persons who may receive or read this report. Investors should therefore seek financial, legal and other advice regarding the appropriateness of investing in any securities or the investment strategies discussed or recommended in this report. The information contained herein has been obtained from sources believed to be reliable but such sources have not been independently verified by Maybank Investment Bank Bhd and consequently no representation is made as to the accuracy or completeness of this report by Maybank Investment Bank Bhd and it should not be relied upon as such. Accordingly, no liability can be accepted for any direct, indirect or consequential losses or damages that may arise from the use or reliance of this report. Maybank Investment Bank Bhd, its affiliates and related companies and their officers, directors, associates, connected parties and/or employees may from time to time have positions or be materially interested in the securities referred to herein and may further act as market maker or may have assumed an underwriting commitment or deal with such securities and may also perform or seek to perform investment banking services, advisory and other services for or relating to those companies. Any information, opinions or recommendations contained herein are subject to change at any time, without prior notice. This report may contain forward looking statements which are often but not always identified by the use of words such as “anticipate”, “believe”, “estimate”, “intend”, “plan”, “expect”, “forecast”, “predict” and “project” and statements that an event or result “may”, “will”, “can”, “should”, “could” or “might” occur or be achieved and other similar expressions. Such forward looking statements are based on assumptions made and information currently available to us and are subject to certain risks and uncertainties that could cause the actual results to differ materially from those expressed in any forward looking statements. Readers are cautioned not to place undue relevance on these forward- looking statements. Maybank Investment Bank Bhd expressly disclaims any obligation to update or revise any such forward looking statements to reflect new information, events or circumstances after the date of this publication or to reflect the occurrence of unanticipated events. This report is prepared for the use of Maybank Investment Bank Bhd's clients and may not be reproduced, altered in any way, transmitted to, copied or distributed to any other party in whole or in part in any form or manner without the prior express written consent of Maybank Investment Bank Bhd and Maybank Investment Bank Bhd accepts no liability whatsoever for the actions of third parties in this respect. This report is not directed to or intended for distribution to or use by any person or entity who is a citizen or resident of or located in any locality, state, country or other jurisdiction where such distribution, publication, availability or use would be contrary to law or regulation. Published / Printed by Maybank Investment Bank Berhad (15938-H) (Formerly known as Aseambankers Malaysia Berhad) (A Participating Organisation of Bursa Malaysia Securities Berhad) 33rd Floor, Menara Maybank, 100 Jalan Tun Perak, 50050 Kuala Lumpur Tel: (603) 2059 1888; Fax: (603) 2078 4194 Stockbroking Business: Level 8, MaybanLife Tower, Dataran Maybank, No.1, Jalan Maarof 59000 Kuala Lumpur Tel: (603) 2297 8888; Fax: (603) 2282 5136 http://www.maybank-ib.com 5 June 2009 Page 4 of 4