SlideShare a Scribd company logo
1 of 6
Download to read offline
Quarterly Result Update

Wockhardt Ltd.
Focus on high margin products drives growth
  Outlook                                                                                                               Recommendation (Rs)
  Wockhardt surprisingly posted losses for Q4FY12 on the back on exceptional items pertaining to payment of             CMP                          718
  derivative liabilities, provisions on CDR and goodwill impairment. Ex- exceptional items, the net profit registered   Rating                       BUY
  robust growth and stood at Rs 261.6 crore, up by 57% yoy. The stock had been reeling under the pressure of
  derivative liabilities and FCCBs repayment over a long time. However, with the settlement of derivative liabilities   Index Details
  and strong cash flows, we expect the company to settle all the dues and return back to an era of strong growth in     Sensex                      16,026
  profitability. Wockhardt business had always been strong even at the resilient times but with focus back on the       Nifty                        4,861
  business and a strong pipeline of FTFs, we expect the company to post better growth in times ahead.                   Industry             Pharmaceuticals

  However, we have scaled down our earnings for FY13 and FY14 to factor in higher taxations and a likely                Scrip Details
  possibility of the deal fell through. Currently the stock is trading at 8.7x and 7.3x of its FY13 and FY14 earnings   Mkt Cap (Rs cr)              7,284
  estimates indicating cheap valuations. We, recommend a BUY with a revised price objective of Rs 885 at 10x            Eq Shares O/s (Cr)            10.9
  FY14EPS.                                                                                                              Avg Vol (Lakhs)                0.6
                                                                                                                        52 Week H/L                 741/251
  Key Takeaways                                                                                                         Dividend Yield (%)             0.0
      Beating street expectations handsomely, Wockhardt surprised the street with stellar performance registering       Face Value (Rs)                5.0
      adjusted net profit (for exceptional items) of Rs 261.6 crore against expectations of Rs 204.9 crore on the
      back of strong EBITDA margins. The EBITDA margins for the quarter stood at Rs 34.6% (+640 bps) yoy.               Latest shareholding pattern (%)
      However, post providing for exceptional items and higher tax rate, the company posted losses to the tune of –     Promoters                   73.6
                                                                                                                        Indian Institutions          4.2
      Rs 191.6 crore for the quarter ended on March 2012.
                                                                                                                        FII’s                        3.2
                                                                                                                        Public                      19.1
      Net sales for the quarter stood at Rs 1241.4 crore v/s Rs 938.7 crore, registering a strong growth of 32.2%       Total                        100
      yoy on the back of good growth in the existing business and in line with our estimates. With FTF opportunities
      and robust product portfolio, we expect the company to register a strong CAGR of 14.8% over three year            Stock performance (%)
      period to Rs 5681.5 crore in FY14.
                                                                                                                                      1m    3m          6m
                                                                                                                        Wockhardt    -4.8  38.1        75.9
      On the exceptional items front, the company provided for Rs 450.04 crore for the fourth quarter and Rs 528.2      Nifty        -7.3 -12.5         2.7
      crore for the full year 2012 which included Rs 133.7 crore on account of settlement of derivative losses, Rs      BSE- HC      -2.6   4.0        13.3
      160 crore on account of CDR recompense provisions and Rs 333.5 crore on account of good will impairment.
      The company gained Rs 99.7 crore from restructuring activities.


                                                                                                                                             nd
                                                                                                                                Tuesday, 22 May, 2012
                  .
Quarterly Result Update

    On the earnings front, the depreciation and interest expenses were in line with our expectations. However,
    the tax rate at 31%, stood higher than our estimates. Factoring in higher tax rate, we have scaled down our
    earnings to Rs 808.2 crore and 968.4 crore for FY13 and FY14 respectively v/s Rs 889.6 crore and Rs
    1070.1 crore previously.


    Further, the Wockhardt- Danone deal for the sale of nutrition business was supposed to be culminated in the
    month of March. However, it got delayed, considering the management has not given time line of the deal, we
    have scaled down our earnings and have not factored in the deal. However, the deal if sails through would be
    EPS accretive, we estimate the company to post an EPS of Rs 164 for FY13 v/s the current forecast of Rs
    82.4.


                                                                                                                             nd
                                                                                                                   Tuesday, 22 May, 2012
Quarterly Result Update

Description                   Q4FY12      Q4FY11     % Chg.     Q4FY12      Q3FY12    % Chg. FY201203 FY201103    % Chg.
Net Sales                      1241.4       938.7       32.2     1241.4      1208.7       2.7   4613.8   3751.2      23.0
Other operational Income            0.0       0.0        0.0          0.0       0.0       0.0      0.0      0.0       0.0
Total Oper. Income(TOI)        1241.4       938.7       32.2     1241.4      1208.7       2.7   4613.8   3751.2      23.0
Raw Materials Cons.-            312.5       216.4       44.4      312.5       327.1      -4.5   1213.0    875.0      38.6
% to TOI                          25.2       23.1          -        25.2       27.1         -     26.3     23.3         -
Stock adj. (-)Inc / (+)Dec-        -8.0       6.6           -        -8.0     -13.9     -42.4   -106.3     61.7          -
% to TOI                          -0.6        0.7          -        -0.6       -1.2         -     -2.3      1.6         -
Net Raw Mat adj. for stock      304.5       223.0       36.6      304.5       313.2      -2.8   1106.7    936.7      18.1
% to TOI                          24.5       23.8          -        24.5       25.9         -     24.0     25.0         -
Other expenses                  326.1       307.0        6.2      326.1       379.3     -14.0   1500.0   1381.1       8.6
% to TOI                          26.3       32.7          -        26.3       31.4         -     34.2     38.0         -
Contribution Net_Sales          610.8       408.8       49.4      610.8       486.6      25.5   1930.9   1390.1      38.9
Personnel                       181.5       143.8       26.2      181.5       139.8      29.8    567.3    524.7       8.1
% to TOI                          14.6       15.3          -        14.6       11.6         -     12.3     14.0         -
Total expenditure               812.1       673.7       20.5      812.1       832.3      -2.4   3173.9   2842.5      11.7
Operating Profit                429.3       265.0       62.0      429.3       376.4      14.1   1439.9    908.7      58.4
% to TOI                          34.6       28.2          -        34.6       31.1         -     29.6     23.1         -
Non-Operating Income              61.5      161.8      -62.0        61.5        8.6    615.1      78.2    196.0     -60.1
Interest                          48.2       90.1      -46.5        48.2       67.9     -29.0    214.4    267.1     -19.7
Exceptional Items              -450.4      -172.1     161.7      -450.4        19.9          -  -452.0   -529.8     -14.7
Gross Profit                    893.0       508.8       75.5      893.0       297.1    200.6    1755.7   1367.4      28.4
Depreciation                      28.8       27.1        6.2        28.8       27.7       4.0    122.5    116.6       5.1
PBT before Extra-ord             -36.7      137.4           -      -36.7      250.1          -   576.7    104.4    452.6
% to TOI                          -3.0       14.6          -        -3.0       20.7         -     12.5      2.8         -
Extraordinary Items                   -          -          -         0.0       0.0          -     0.0      0.0       0.0
PBT                              -36.7      137.4           -      -36.7      250.1          -   576.7    104.4    452.6
Tax Rate                       -415.3       -21.0    1880.0      -415.3        14.8          -    40.8      8.3    392.5
Prov. for Tax                   152.2       -28.8           -     152.2        37.0    311.4     235.1      8.6   2621.4
% to TOI                          12.3       -3.1          -        12.3        3.1         -      5.1      0.2         -
Profit after Tax               -188.9       166.2           -    -188.9       213.1          -   341.6     95.7    256.9
% to TOI                        -15.2        17.7          -      -15.2        17.6         -      7.4      2.6         -
Minority Interest                     -          -          -         0.0       0.0          -     0.0      0.0       0.0
PAT (adj. For MI)              -191.6       161.8           -    -191.6       212.8          -   342.7     90.5    278.5
Face Value                          5.0       5.0           -         5.0       5.0          -     5.0      5.0          -
Equity Share capital              54.7       54.7           -       54.7       54.7          -    54.7     54.7          -
EPS (Rs.)                        -17.3       15.2           -      -17.3       19.5          -    31.2      8.7    256.9
CEPS (Rs.)                       -14.6       17.7           -      -14.6       22.0          -    42.4     19.4    118.6


                                                                                                                                       nd
                                                                                                                             Tuesday, 22 May, 2012
Quarterly Result Update


                          P/E Bands                                                     P/B Bands                                          EV/EBITDA Bands
  2000                                                             2000                                                     25000
  1500                                                             1800
  1000                                                             1600                                                     20000
                                                                   1400
   500
                                                                   1200                                                     15000
     0
                                                                   1000
     Dec-00 Dec-02 Dec-04 Dec-06 Dec-08 Dec-10 Dec-12
  -500
                                                                    800                                                     10000
 -1000                                                              600
 -1500                                                              400                                                      5000
 -2000                                                              200
 -2500                                                               0                                                         0
                                                                     Dec-00 Dec-02 Dec-04 Dec-06 Dec-08 Dec-10 Dec-12          Dec-00 Dec-02 Dec-04 Dec-06 Dec-08 Dec-10 Dec-12
    CMP       8X       11.685X    15.37X       19.055X   22.74X
                                                                      CMP       1X       2.55X     4.1X     5.65X    7.2X      EV     5X     7.63X    10.26X   12.89X    15.52X


                   NIFTY Comparison                                       BSE-Healthcare Comparison
250.00                                                            250.0

200.00                                                            200.0

150.00                                                            150.0

100.00                                                            100.0

 50.00                                                             50.0

  0.00                                                              0.0
     May-11   Jul-11     Sep-11 Nov-11 Jan-12 Mar-12                 May-11   Jul-11   Sep-11 Nov-11 Jan-12 Mar-12

                          Wockhardt    NIFTY                                           Wockhardt    BSEHC


                                                                                                                                                                 nd
                                                                                                                                                     Tuesday, 22 May, 2012
Quarterly Result Update

                                                        Financial & Projections
       Y/E March, Fig in Rs. Cr     FY 2011 FY 2012e FY 2013e FY 2014e     Y/E March, Fig in Rs. Cr            FY 2011 FY 2012e FY 2013e FY 2014e
       Profit & Loss Statement                                             Per Share Data (Rs)
       Net Sales                     3751.2   4613.8     5208.7   5681.5   EPS                                      8.7    35.1     73.9      88.5
       % Chg.                                   23.0       12.9      9.1   Cash EPS                               19.4     46.3     86.5     101.9
       Total Expenditure             2842.5   3174.1     3605.7   3853.3   DPS                                      0.0      0.0      0.0      0.0
       % Chg.                                   11.7       13.6      6.9   Book Value                            103.0    134.5    208.3     296.4
       EBITDA                         908.7   1439.7     1603.1   1828.2   Capital, Liquidity, Returns Ratio
       EBITDA Margin %                 24.2     31.2       30.8     32.2   Debt / Equity (x)                        3.4      2.0      1.5      0.8
       Other Income                    15.9     23.5       26.5     30.5   Current Ratio (x)                        2.3      1.6      2.3      2.2
       Exceptional items              436.6    506.8        0.0      0.0   ROE (%)                                  8.5    26.1     35.5      29.9
       PBDIT                          488.1    956.4     1629.5   1858.7   ROCE (%)                                 9.8    21.5     28.8      31.9
       Depreciation                   116.6    122.5      138.0    147.0   Dividend Yield (%)                       0.0      0.0      0.0      0.0
       Interest & Finance Charges     267.1    214.4      320.2    310.4   Valuation Ratio (x)
       PBT                            104.3    619.5     1171.4   1401.3   P/E                                    82.1     20.4       9.7      8.1
       Tax Provisions                   8.6    235.1      363.1    432.9   P/BV                                     7.0      5.3      3.4      2.4
       Reported PAT                    95.7    384.3      808.2    968.4   EV/Sales                                 2.7      2.2      1.9      1.8
       PAT Margin (%)                   2.6       8.3      15.5     17.0   EV/EBIDTA                              11.1       7.0      6.3      5.5
                                                                           Efficiency Ratio (x)
       Manpower cost / Sales (%)       14.0     12.8       14.8     14.8   Inventory (days)                       69.4     70.0     70.0      70.0
       Other Exp / Sales (%)           20.1     19.6       18.8     18.5   Debtors (days)                         58.9     60.0     60.0      60.0
       Tax Rate (%)                     8.3     38.0       31.0     30.9   Creditors (days)                       42.5     45.0     45.0      45.0


       Balance Sheet                                                       Cash Flow statement
       Share Capital                  799.9    816.1      816.1    816.1   Profit After Tax                       90.5    342.7    808.2     963.6
       Reserves & Surplus             326.5    654.9     1463.2   2426.8   Depreciation                          116.6    122.5    138.0     147.0
       Minority Interest & Others       0.0       0.0       0.0      0.0   Working Capital Changes               258.0    578.6    -718.1    -86.2
       Total Loans                   3849.5   2967.2     3370.7   2587.1   Others                                151.1    -126.5      0.0      0.0
       Deferred Tax Iiability           0.0       0.0       0.0      0.0   Operating Cash Flow                   616.2    917.4    228.1    1024.4
       Total Liabilities             4975.9   4438.2     5649.9   5830.0   Capital Expenditure                   -214.3   -720.4   170.4    -300.0
       Goodwill                         0.0       0.0       0.0      0.0   Change in Investment                  -174.6   886.3    -879.3     -9.7
       Gross Block                   4048.7   4769.1     4598.6   4898.6   Cash Flow from Investing              -389.0   165.9    -708.8   -309.7
       Less: Acc. Depreciation       1468.4   1295.4     1433.4   1580.4   Proceeds from equity issue             76.6     16.2       0.0      0.0
       Net Block                     2580.2   3473.6     3165.3   3318.3   Inc/ Dec in Debt                      -168.0   -882.3   403.5    -783.6
       Capital Work in Progress       887.4       0.0     878.4    887.1   Dividend and DDT                         0.0      0.0      0.0      0.0
       Investments                     89.6     90.8       91.7     92.6   Cash Flow from Financing               -91.4   -866.2   403.5    -783.6
       Net Current Assets            1160.5    974.8     1615.7   1633.0   Net Change in Cash                    135.9    217.1     -77.3    -68.9
       Deferred Tax Assets            258.2    -101.0    -101.0   -101.0   Opening Cash Balance                  347.0    482.9    700.0     622.7
       Total Assets                  4975.9   4438.2     5649.9   5830.0   Closing Cash Balance                  482.9    700.0    622.7     553.9


                                                                                                                                                      nd
                                                                                                                                            Tuesday, 22 May, 2012
Quarterly Result Update


Ventura Securities Limited

Corporate Office: C-112/116, Bldg No. 1, Kailash Industrial Complex, Park Site, Vikhroli (W), Mumbai – 400079

This report is neither an offer nor a solicitation to purchase or sell securities. The information and views expressed herein are believed to be reliable, but no
responsibility (or liability) is accepted for errors of fact or opinion. Writers and contributors may be trading in or have positions in the securities mentioned in their
articles. Neither Ventura Securities Limited nor any of the contributors accepts any liability arising out of the above information/articles. Reproduction in whole or
in part without written permission is prohibited. This report is for private circulation.


                                                                                                                                                            nd
                                                                                                                                               Tuesday, 22 May, 2012

More Related Content

What's hot (19)

L&T - Result Update RU2QFY2011
L&T - Result Update RU2QFY2011L&T - Result Update RU2QFY2011
L&T - Result Update RU2QFY2011
 
GSPL
GSPLGSPL
GSPL
 
Hindalco
Hindalco Hindalco
Hindalco
 
Nmdc ru4 qfy2010-210510
Nmdc ru4 qfy2010-210510Nmdc ru4 qfy2010-210510
Nmdc ru4 qfy2010-210510
 
Sadbhav
SadbhavSadbhav
Sadbhav
 
Sail steel ru4 qfy2010-310510
Sail steel ru4 qfy2010-310510Sail steel ru4 qfy2010-310510
Sail steel ru4 qfy2010-310510
 
Larsen & Tourbo
Larsen & TourboLarsen & Tourbo
Larsen & Tourbo
 
First insights cairn india ltd
First insights  cairn india ltdFirst insights  cairn india ltd
First insights cairn india ltd
 
Shree Ganesh(Update)
Shree Ganesh(Update)Shree Ganesh(Update)
Shree Ganesh(Update)
 
Cairn India
Cairn IndiaCairn India
Cairn India
 
Investment Idea - BPCL : Recommended as "Sell"
Investment Idea  - BPCL : Recommended as "Sell"Investment Idea  - BPCL : Recommended as "Sell"
Investment Idea - BPCL : Recommended as "Sell"
 
Hdfc bank ru2 qfy2011-191010
Hdfc bank ru2 qfy2011-191010Hdfc bank ru2 qfy2011-191010
Hdfc bank ru2 qfy2011-191010
 
Dishman ru4 qfy2010-310510
Dishman ru4 qfy2010-310510Dishman ru4 qfy2010-310510
Dishman ru4 qfy2010-310510
 
credit-suisse Letter to shareholders Q4/2004
credit-suisse Letter to shareholders Q4/2004credit-suisse Letter to shareholders Q4/2004
credit-suisse Letter to shareholders Q4/2004
 
Deccan Chronicle
Deccan Chronicle Deccan Chronicle
Deccan Chronicle
 
Ongc ru4 qfy2010-280510
Ongc ru4 qfy2010-280510Ongc ru4 qfy2010-280510
Ongc ru4 qfy2010-280510
 
ConAgra QAFY06Q1
ConAgra QAFY06Q1ConAgra QAFY06Q1
ConAgra QAFY06Q1
 
United Spirits to operate Diageo brands in India; buy
United Spirits to operate Diageo brands in India; buyUnited Spirits to operate Diageo brands in India; buy
United Spirits to operate Diageo brands in India; buy
 
NMDC
NMDCNMDC
NMDC
 

Similar to Wockhardt Q4FY12 Results Drive Growth

Blue star ru4 qfy2010-190510
Blue star ru4 qfy2010-190510Blue star ru4 qfy2010-190510
Blue star ru4 qfy2010-190510Angel Broking
 
Marico Result Update
Marico Result UpdateMarico Result Update
Marico Result UpdateAngel Broking
 
Tata motors ru4 qfy2010-280510
Tata motors  ru4 qfy2010-280510Tata motors  ru4 qfy2010-280510
Tata motors ru4 qfy2010-280510Angel Broking
 
Rallis India - RU2QFY2011
Rallis India - RU2QFY2011Rallis India - RU2QFY2011
Rallis India - RU2QFY2011Angel Broking
 
Exide 2 qfy2011ru-121010
Exide 2 qfy2011ru-121010Exide 2 qfy2011ru-121010
Exide 2 qfy2011ru-121010Angel Broking
 
All ru2 qfy2011-201010
All ru2 qfy2011-201010All ru2 qfy2011-201010
All ru2 qfy2011-201010Angel Broking
 
Graphite india ru4 qfy2010-140510
Graphite india ru4 qfy2010-140510Graphite india ru4 qfy2010-140510
Graphite india ru4 qfy2010-140510Angel Broking
 
McNally Result Update 4qfy2010-180510
McNally Result Update 4qfy2010-180510McNally Result Update 4qfy2010-180510
McNally Result Update 4qfy2010-180510Angel Broking
 
Bharat forge ru4 qfy2010-210510
Bharat forge ru4 qfy2010-210510Bharat forge ru4 qfy2010-210510
Bharat forge ru4 qfy2010-210510Angel Broking
 
Shoppers stop result update 4 qfy2010 040510
Shoppers stop result update 4 qfy2010 040510Shoppers stop result update 4 qfy2010 040510
Shoppers stop result update 4 qfy2010 040510Angel Broking
 
Gail ru4 qfy2010-18-05-10
Gail ru4 qfy2010-18-05-10Gail ru4 qfy2010-18-05-10
Gail ru4 qfy2010-18-05-10Angel Broking
 
MPL Result Update 4qfy2010-030510-final
MPL Result Update 4qfy2010-030510-finalMPL Result Update 4qfy2010-030510-final
MPL Result Update 4qfy2010-030510-finalAngel Broking
 
Sterlite Result Update
Sterlite Result UpdateSterlite Result Update
Sterlite Result UpdateAngel Broking
 
Bajaj auto ru4 qfy2010-140510
Bajaj auto ru4 qfy2010-140510Bajaj auto ru4 qfy2010-140510
Bajaj auto ru4 qfy2010-140510Angel Broking
 
Gdl result update 4 qfy2010-300410
Gdl  result update 4 qfy2010-300410Gdl  result update 4 qfy2010-300410
Gdl result update 4 qfy2010-300410Angel Broking
 

Similar to Wockhardt Q4FY12 Results Drive Growth (20)

Blue star ru4 qfy2010-190510
Blue star ru4 qfy2010-190510Blue star ru4 qfy2010-190510
Blue star ru4 qfy2010-190510
 
Marico Result Update
Marico Result UpdateMarico Result Update
Marico Result Update
 
Tata motors ru4 qfy2010-280510
Tata motors  ru4 qfy2010-280510Tata motors  ru4 qfy2010-280510
Tata motors ru4 qfy2010-280510
 
RIL Result Update
RIL Result UpdateRIL Result Update
RIL Result Update
 
Bhel 020212
Bhel 020212Bhel 020212
Bhel 020212
 
Rallis India - RU2QFY2011
Rallis India - RU2QFY2011Rallis India - RU2QFY2011
Rallis India - RU2QFY2011
 
Exide 2 qfy2011ru-121010
Exide 2 qfy2011ru-121010Exide 2 qfy2011ru-121010
Exide 2 qfy2011ru-121010
 
Hindalco Novelis
Hindalco Novelis Hindalco Novelis
Hindalco Novelis
 
All ru2 qfy2011-201010
All ru2 qfy2011-201010All ru2 qfy2011-201010
All ru2 qfy2011-201010
 
Graphite india ru4 qfy2010-140510
Graphite india ru4 qfy2010-140510Graphite india ru4 qfy2010-140510
Graphite india ru4 qfy2010-140510
 
McNally Result Update 4qfy2010-180510
McNally Result Update 4qfy2010-180510McNally Result Update 4qfy2010-180510
McNally Result Update 4qfy2010-180510
 
Cipla
Cipla Cipla
Cipla
 
Bharat forge ru4 qfy2010-210510
Bharat forge ru4 qfy2010-210510Bharat forge ru4 qfy2010-210510
Bharat forge ru4 qfy2010-210510
 
Shoppers stop result update 4 qfy2010 040510
Shoppers stop result update 4 qfy2010 040510Shoppers stop result update 4 qfy2010 040510
Shoppers stop result update 4 qfy2010 040510
 
Gail ru4 qfy2010-18-05-10
Gail ru4 qfy2010-18-05-10Gail ru4 qfy2010-18-05-10
Gail ru4 qfy2010-18-05-10
 
Persistent systems
Persistent systemsPersistent systems
Persistent systems
 
MPL Result Update 4qfy2010-030510-final
MPL Result Update 4qfy2010-030510-finalMPL Result Update 4qfy2010-030510-final
MPL Result Update 4qfy2010-030510-final
 
Sterlite Result Update
Sterlite Result UpdateSterlite Result Update
Sterlite Result Update
 
Bajaj auto ru4 qfy2010-140510
Bajaj auto ru4 qfy2010-140510Bajaj auto ru4 qfy2010-140510
Bajaj auto ru4 qfy2010-140510
 
Gdl result update 4 qfy2010-300410
Gdl  result update 4 qfy2010-300410Gdl  result update 4 qfy2010-300410
Gdl result update 4 qfy2010-300410
 

More from Vinit Bolinjkar LION bolinjkar.vinit@gmail.com

More from Vinit Bolinjkar LION bolinjkar.vinit@gmail.com (20)

Burger King Equity Research & Valuation Webinar Slide Deck| School of Market ...
Burger King Equity Research & Valuation Webinar Slide Deck| School of Market ...Burger King Equity Research & Valuation Webinar Slide Deck| School of Market ...
Burger King Equity Research & Valuation Webinar Slide Deck| School of Market ...
 
Varun Beverages Equity Research & Valuation | School of Market Studies Webina...
Varun Beverages Equity Research & Valuation | School of Market Studies Webina...Varun Beverages Equity Research & Valuation | School of Market Studies Webina...
Varun Beverages Equity Research & Valuation | School of Market Studies Webina...
 
Voltas Equity Research & Valuation | School of Market Studies Webinar Learnin...
Voltas Equity Research & Valuation | School of Market Studies Webinar Learnin...Voltas Equity Research & Valuation | School of Market Studies Webinar Learnin...
Voltas Equity Research & Valuation | School of Market Studies Webinar Learnin...
 
HUL Equity Research & Valuation | School of Market Studies Webinar Learning S...
HUL Equity Research & Valuation | School of Market Studies Webinar Learning S...HUL Equity Research & Valuation | School of Market Studies Webinar Learning S...
HUL Equity Research & Valuation | School of Market Studies Webinar Learning S...
 
Get LinkedIn₹ - Ask Me Anything
Get LinkedIn₹ - Ask Me AnythingGet LinkedIn₹ - Ask Me Anything
Get LinkedIn₹ - Ask Me Anything
 
#Coronavirus Important Facts We Should Know
#Coronavirus Important Facts We Should Know#Coronavirus Important Facts We Should Know
#Coronavirus Important Facts We Should Know
 
Metal Pipe Stocks - Technical Analysis (Weekly Charts)
Metal Pipe Stocks - Technical Analysis (Weekly Charts)Metal Pipe Stocks - Technical Analysis (Weekly Charts)
Metal Pipe Stocks - Technical Analysis (Weekly Charts)
 
Webinar: 10 Businesses With Superlative Moats
Webinar: 10 Businesses With Superlative MoatsWebinar: 10 Businesses With Superlative Moats
Webinar: 10 Businesses With Superlative Moats
 
Multibagger stock picking_using_8_criteria_elimination
Multibagger stock picking_using_8_criteria_eliminationMultibagger stock picking_using_8_criteria_elimination
Multibagger stock picking_using_8_criteria_elimination
 
Dematerialization: A Silent Revolution in the Indian Capital Markets
Dematerialization: A Silent Revolution in the Indian Capital MarketsDematerialization: A Silent Revolution in the Indian Capital Markets
Dematerialization: A Silent Revolution in the Indian Capital Markets
 
Ocl India - Explosive Growth Ahead
Ocl India - Explosive Growth AheadOcl India - Explosive Growth Ahead
Ocl India - Explosive Growth Ahead
 
South Indian Bank
South Indian BankSouth Indian Bank
South Indian Bank
 
India Union Budget 2014-15 | A Holistic Plan of Action
India Union Budget 2014-15 | A Holistic Plan of ActionIndia Union Budget 2014-15 | A Holistic Plan of Action
India Union Budget 2014-15 | A Holistic Plan of Action
 
Technical analysis-select-commodities-april-2013
Technical analysis-select-commodities-april-2013Technical analysis-select-commodities-april-2013
Technical analysis-select-commodities-april-2013
 
India budget-2013-14
India budget-2013-14India budget-2013-14
India budget-2013-14
 
Indian_Pharma_Sector_Technical_Outlook_Dec_2012
Indian_Pharma_Sector_Technical_Outlook_Dec_2012Indian_Pharma_Sector_Technical_Outlook_Dec_2012
Indian_Pharma_Sector_Technical_Outlook_Dec_2012
 
Initiating coverage gmdc_ltd_buy_for_36_per_appreciation
Initiating coverage gmdc_ltd_buy_for_36_per_appreciationInitiating coverage gmdc_ltd_buy_for_36_per_appreciation
Initiating coverage gmdc_ltd_buy_for_36_per_appreciation
 
Divis' lab ltd
Divis' lab ltdDivis' lab ltd
Divis' lab ltd
 
Petronet lng
Petronet lngPetronet lng
Petronet lng
 
Initiating coverage Mahindra & Mahindra ltd
Initiating coverage  Mahindra & Mahindra ltdInitiating coverage  Mahindra & Mahindra ltd
Initiating coverage Mahindra & Mahindra ltd
 

Recently uploaded

Nicola Mining Inc. Corporate Presentation April 2024
Nicola Mining Inc. Corporate Presentation April 2024Nicola Mining Inc. Corporate Presentation April 2024
Nicola Mining Inc. Corporate Presentation April 2024nicola_mining
 
Q1 Quarterly Update - April 16, 2024.pdf
Q1 Quarterly Update - April 16, 2024.pdfQ1 Quarterly Update - April 16, 2024.pdf
Q1 Quarterly Update - April 16, 2024.pdfProbe Gold
 
9654467111 Low Rate Call Girls In Tughlakabad, Delhi NCR
9654467111 Low Rate Call Girls In Tughlakabad, Delhi NCR9654467111 Low Rate Call Girls In Tughlakabad, Delhi NCR
9654467111 Low Rate Call Girls In Tughlakabad, Delhi NCRSapana Sha
 
The Concept of Humanity in Islam and its effects at future of humanity
The Concept of Humanity in Islam and its effects at future of humanityThe Concept of Humanity in Islam and its effects at future of humanity
The Concept of Humanity in Islam and its effects at future of humanityJohanAspro
 
如何办理东俄勒冈大学毕业证(文凭)EOU学位证书
如何办理东俄勒冈大学毕业证(文凭)EOU学位证书如何办理东俄勒冈大学毕业证(文凭)EOU学位证书
如何办理东俄勒冈大学毕业证(文凭)EOU学位证书Fir La
 
如何办理北卡罗来纳大学教堂山分校毕业证(文凭)UNC学位证书
如何办理北卡罗来纳大学教堂山分校毕业证(文凭)UNC学位证书如何办理北卡罗来纳大学教堂山分校毕业证(文凭)UNC学位证书
如何办理北卡罗来纳大学教堂山分校毕业证(文凭)UNC学位证书Fir La
 
slideshare_2404_presentation materials_en.pdf
slideshare_2404_presentation materials_en.pdfslideshare_2404_presentation materials_en.pdf
slideshare_2404_presentation materials_en.pdfsansanir
 
Corporate Presentation Probe April 2024.pdf
Corporate Presentation Probe April 2024.pdfCorporate Presentation Probe April 2024.pdf
Corporate Presentation Probe April 2024.pdfProbe Gold
 
The resilient U.S. late-cycle expansion contributed to a stalling pattern in ...
The resilient U.S. late-cycle expansion contributed to a stalling pattern in ...The resilient U.S. late-cycle expansion contributed to a stalling pattern in ...
The resilient U.S. late-cycle expansion contributed to a stalling pattern in ...Kumaran637735
 
the 25 most beautiful words for a loving and lasting relationship.pdf
the 25 most beautiful words for a loving and lasting relationship.pdfthe 25 most beautiful words for a loving and lasting relationship.pdf
the 25 most beautiful words for a loving and lasting relationship.pdfFrancenel Paul
 
9654467111 Call Girls In Katwaria Sarai Short 1500 Night 6000
9654467111 Call Girls In Katwaria Sarai Short 1500 Night 60009654467111 Call Girls In Katwaria Sarai Short 1500 Night 6000
9654467111 Call Girls In Katwaria Sarai Short 1500 Night 6000Sapana Sha
 
Corporate Presentation Probe April 2024.pdf
Corporate Presentation Probe April 2024.pdfCorporate Presentation Probe April 2024.pdf
Corporate Presentation Probe April 2024.pdfProbe Gold
 
Basic Accountants in|TaxlinkConcept.pdf
Basic  Accountants in|TaxlinkConcept.pdfBasic  Accountants in|TaxlinkConcept.pdf
Basic Accountants in|TaxlinkConcept.pdftaxlinkcpa
 
WheelTug PLC Pitch Deck | Investor Insights | April 2024
WheelTug PLC Pitch Deck | Investor Insights | April 2024WheelTug PLC Pitch Deck | Investor Insights | April 2024
WheelTug PLC Pitch Deck | Investor Insights | April 2024Hector Del Castillo, CPM, CPMM
 
如何办理密苏里大学堪萨斯分校毕业证(文凭)UMKC学位证书
如何办理密苏里大学堪萨斯分校毕业证(文凭)UMKC学位证书如何办理密苏里大学堪萨斯分校毕业证(文凭)UMKC学位证书
如何办理密苏里大学堪萨斯分校毕业证(文凭)UMKC学位证书Fir La
 

Recently uploaded (20)

young Call girls in Dwarka sector 1🔝 9953056974 🔝 Delhi escort Service
young Call girls in Dwarka sector 1🔝 9953056974 🔝 Delhi escort Serviceyoung Call girls in Dwarka sector 1🔝 9953056974 🔝 Delhi escort Service
young Call girls in Dwarka sector 1🔝 9953056974 🔝 Delhi escort Service
 
Nicola Mining Inc. Corporate Presentation April 2024
Nicola Mining Inc. Corporate Presentation April 2024Nicola Mining Inc. Corporate Presentation April 2024
Nicola Mining Inc. Corporate Presentation April 2024
 
Q1 Quarterly Update - April 16, 2024.pdf
Q1 Quarterly Update - April 16, 2024.pdfQ1 Quarterly Update - April 16, 2024.pdf
Q1 Quarterly Update - April 16, 2024.pdf
 
9654467111 Low Rate Call Girls In Tughlakabad, Delhi NCR
9654467111 Low Rate Call Girls In Tughlakabad, Delhi NCR9654467111 Low Rate Call Girls In Tughlakabad, Delhi NCR
9654467111 Low Rate Call Girls In Tughlakabad, Delhi NCR
 
The Concept of Humanity in Islam and its effects at future of humanity
The Concept of Humanity in Islam and its effects at future of humanityThe Concept of Humanity in Islam and its effects at future of humanity
The Concept of Humanity in Islam and its effects at future of humanity
 
如何办理东俄勒冈大学毕业证(文凭)EOU学位证书
如何办理东俄勒冈大学毕业证(文凭)EOU学位证书如何办理东俄勒冈大学毕业证(文凭)EOU学位证书
如何办理东俄勒冈大学毕业证(文凭)EOU学位证书
 
如何办理北卡罗来纳大学教堂山分校毕业证(文凭)UNC学位证书
如何办理北卡罗来纳大学教堂山分校毕业证(文凭)UNC学位证书如何办理北卡罗来纳大学教堂山分校毕业证(文凭)UNC学位证书
如何办理北卡罗来纳大学教堂山分校毕业证(文凭)UNC学位证书
 
young call girls in Govindpuri 🔝 9953056974 🔝 Delhi escort Service
young call girls in Govindpuri 🔝 9953056974 🔝 Delhi escort Serviceyoung call girls in Govindpuri 🔝 9953056974 🔝 Delhi escort Service
young call girls in Govindpuri 🔝 9953056974 🔝 Delhi escort Service
 
young call girls in Hauz Khas,🔝 9953056974 🔝 escort Service
young call girls in Hauz Khas,🔝 9953056974 🔝 escort Serviceyoung call girls in Hauz Khas,🔝 9953056974 🔝 escort Service
young call girls in Hauz Khas,🔝 9953056974 🔝 escort Service
 
slideshare_2404_presentation materials_en.pdf
slideshare_2404_presentation materials_en.pdfslideshare_2404_presentation materials_en.pdf
slideshare_2404_presentation materials_en.pdf
 
Corporate Presentation Probe April 2024.pdf
Corporate Presentation Probe April 2024.pdfCorporate Presentation Probe April 2024.pdf
Corporate Presentation Probe April 2024.pdf
 
Model Call Girl in Uttam Nagar Delhi reach out to us at 🔝9953056974🔝
Model Call Girl in Uttam Nagar Delhi reach out to us at 🔝9953056974🔝Model Call Girl in Uttam Nagar Delhi reach out to us at 🔝9953056974🔝
Model Call Girl in Uttam Nagar Delhi reach out to us at 🔝9953056974🔝
 
The resilient U.S. late-cycle expansion contributed to a stalling pattern in ...
The resilient U.S. late-cycle expansion contributed to a stalling pattern in ...The resilient U.S. late-cycle expansion contributed to a stalling pattern in ...
The resilient U.S. late-cycle expansion contributed to a stalling pattern in ...
 
the 25 most beautiful words for a loving and lasting relationship.pdf
the 25 most beautiful words for a loving and lasting relationship.pdfthe 25 most beautiful words for a loving and lasting relationship.pdf
the 25 most beautiful words for a loving and lasting relationship.pdf
 
young call girls in Yamuna Vihar 🔝 9953056974 🔝 Delhi escort Service
young  call girls in   Yamuna Vihar 🔝 9953056974 🔝 Delhi escort Serviceyoung  call girls in   Yamuna Vihar 🔝 9953056974 🔝 Delhi escort Service
young call girls in Yamuna Vihar 🔝 9953056974 🔝 Delhi escort Service
 
9654467111 Call Girls In Katwaria Sarai Short 1500 Night 6000
9654467111 Call Girls In Katwaria Sarai Short 1500 Night 60009654467111 Call Girls In Katwaria Sarai Short 1500 Night 6000
9654467111 Call Girls In Katwaria Sarai Short 1500 Night 6000
 
Corporate Presentation Probe April 2024.pdf
Corporate Presentation Probe April 2024.pdfCorporate Presentation Probe April 2024.pdf
Corporate Presentation Probe April 2024.pdf
 
Basic Accountants in|TaxlinkConcept.pdf
Basic  Accountants in|TaxlinkConcept.pdfBasic  Accountants in|TaxlinkConcept.pdf
Basic Accountants in|TaxlinkConcept.pdf
 
WheelTug PLC Pitch Deck | Investor Insights | April 2024
WheelTug PLC Pitch Deck | Investor Insights | April 2024WheelTug PLC Pitch Deck | Investor Insights | April 2024
WheelTug PLC Pitch Deck | Investor Insights | April 2024
 
如何办理密苏里大学堪萨斯分校毕业证(文凭)UMKC学位证书
如何办理密苏里大学堪萨斯分校毕业证(文凭)UMKC学位证书如何办理密苏里大学堪萨斯分校毕业证(文凭)UMKC学位证书
如何办理密苏里大学堪萨斯分校毕业证(文凭)UMKC学位证书
 

Wockhardt Q4FY12 Results Drive Growth

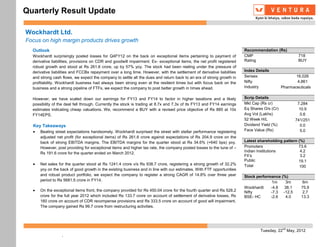
  • 1. Quarterly Result Update Wockhardt Ltd. Focus on high margin products drives growth Outlook Recommendation (Rs) Wockhardt surprisingly posted losses for Q4FY12 on the back on exceptional items pertaining to payment of CMP 718 derivative liabilities, provisions on CDR and goodwill impairment. Ex- exceptional items, the net profit registered Rating BUY robust growth and stood at Rs 261.6 crore, up by 57% yoy. The stock had been reeling under the pressure of derivative liabilities and FCCBs repayment over a long time. However, with the settlement of derivative liabilities Index Details and strong cash flows, we expect the company to settle all the dues and return back to an era of strong growth in Sensex 16,026 profitability. Wockhardt business had always been strong even at the resilient times but with focus back on the Nifty 4,861 business and a strong pipeline of FTFs, we expect the company to post better growth in times ahead. Industry Pharmaceuticals However, we have scaled down our earnings for FY13 and FY14 to factor in higher taxations and a likely Scrip Details possibility of the deal fell through. Currently the stock is trading at 8.7x and 7.3x of its FY13 and FY14 earnings Mkt Cap (Rs cr) 7,284 estimates indicating cheap valuations. We, recommend a BUY with a revised price objective of Rs 885 at 10x Eq Shares O/s (Cr) 10.9 FY14EPS. Avg Vol (Lakhs) 0.6 52 Week H/L 741/251 Key Takeaways Dividend Yield (%) 0.0 Beating street expectations handsomely, Wockhardt surprised the street with stellar performance registering Face Value (Rs) 5.0 adjusted net profit (for exceptional items) of Rs 261.6 crore against expectations of Rs 204.9 crore on the back of strong EBITDA margins. The EBITDA margins for the quarter stood at Rs 34.6% (+640 bps) yoy. Latest shareholding pattern (%) However, post providing for exceptional items and higher tax rate, the company posted losses to the tune of – Promoters 73.6 Indian Institutions 4.2 Rs 191.6 crore for the quarter ended on March 2012. FII’s 3.2 Public 19.1 Net sales for the quarter stood at Rs 1241.4 crore v/s Rs 938.7 crore, registering a strong growth of 32.2% Total 100 yoy on the back of good growth in the existing business and in line with our estimates. With FTF opportunities and robust product portfolio, we expect the company to register a strong CAGR of 14.8% over three year Stock performance (%) period to Rs 5681.5 crore in FY14. 1m 3m 6m Wockhardt -4.8 38.1 75.9 On the exceptional items front, the company provided for Rs 450.04 crore for the fourth quarter and Rs 528.2 Nifty -7.3 -12.5 2.7 crore for the full year 2012 which included Rs 133.7 crore on account of settlement of derivative losses, Rs BSE- HC -2.6 4.0 13.3 160 crore on account of CDR recompense provisions and Rs 333.5 crore on account of good will impairment. The company gained Rs 99.7 crore from restructuring activities. nd Tuesday, 22 May, 2012 .
  • 2. Quarterly Result Update On the earnings front, the depreciation and interest expenses were in line with our expectations. However, the tax rate at 31%, stood higher than our estimates. Factoring in higher tax rate, we have scaled down our earnings to Rs 808.2 crore and 968.4 crore for FY13 and FY14 respectively v/s Rs 889.6 crore and Rs 1070.1 crore previously. Further, the Wockhardt- Danone deal for the sale of nutrition business was supposed to be culminated in the month of March. However, it got delayed, considering the management has not given time line of the deal, we have scaled down our earnings and have not factored in the deal. However, the deal if sails through would be EPS accretive, we estimate the company to post an EPS of Rs 164 for FY13 v/s the current forecast of Rs 82.4. nd Tuesday, 22 May, 2012
  • 3. Quarterly Result Update Description Q4FY12 Q4FY11 % Chg. Q4FY12 Q3FY12 % Chg. FY201203 FY201103 % Chg. Net Sales 1241.4 938.7 32.2 1241.4 1208.7 2.7 4613.8 3751.2 23.0 Other operational Income 0.0 0.0 0.0 0.0 0.0 0.0 0.0 0.0 0.0 Total Oper. Income(TOI) 1241.4 938.7 32.2 1241.4 1208.7 2.7 4613.8 3751.2 23.0 Raw Materials Cons.- 312.5 216.4 44.4 312.5 327.1 -4.5 1213.0 875.0 38.6 % to TOI 25.2 23.1 - 25.2 27.1 - 26.3 23.3 - Stock adj. (-)Inc / (+)Dec- -8.0 6.6 - -8.0 -13.9 -42.4 -106.3 61.7 - % to TOI -0.6 0.7 - -0.6 -1.2 - -2.3 1.6 - Net Raw Mat adj. for stock 304.5 223.0 36.6 304.5 313.2 -2.8 1106.7 936.7 18.1 % to TOI 24.5 23.8 - 24.5 25.9 - 24.0 25.0 - Other expenses 326.1 307.0 6.2 326.1 379.3 -14.0 1500.0 1381.1 8.6 % to TOI 26.3 32.7 - 26.3 31.4 - 34.2 38.0 - Contribution Net_Sales 610.8 408.8 49.4 610.8 486.6 25.5 1930.9 1390.1 38.9 Personnel 181.5 143.8 26.2 181.5 139.8 29.8 567.3 524.7 8.1 % to TOI 14.6 15.3 - 14.6 11.6 - 12.3 14.0 - Total expenditure 812.1 673.7 20.5 812.1 832.3 -2.4 3173.9 2842.5 11.7 Operating Profit 429.3 265.0 62.0 429.3 376.4 14.1 1439.9 908.7 58.4 % to TOI 34.6 28.2 - 34.6 31.1 - 29.6 23.1 - Non-Operating Income 61.5 161.8 -62.0 61.5 8.6 615.1 78.2 196.0 -60.1 Interest 48.2 90.1 -46.5 48.2 67.9 -29.0 214.4 267.1 -19.7 Exceptional Items -450.4 -172.1 161.7 -450.4 19.9 - -452.0 -529.8 -14.7 Gross Profit 893.0 508.8 75.5 893.0 297.1 200.6 1755.7 1367.4 28.4 Depreciation 28.8 27.1 6.2 28.8 27.7 4.0 122.5 116.6 5.1 PBT before Extra-ord -36.7 137.4 - -36.7 250.1 - 576.7 104.4 452.6 % to TOI -3.0 14.6 - -3.0 20.7 - 12.5 2.8 - Extraordinary Items - - - 0.0 0.0 - 0.0 0.0 0.0 PBT -36.7 137.4 - -36.7 250.1 - 576.7 104.4 452.6 Tax Rate -415.3 -21.0 1880.0 -415.3 14.8 - 40.8 8.3 392.5 Prov. for Tax 152.2 -28.8 - 152.2 37.0 311.4 235.1 8.6 2621.4 % to TOI 12.3 -3.1 - 12.3 3.1 - 5.1 0.2 - Profit after Tax -188.9 166.2 - -188.9 213.1 - 341.6 95.7 256.9 % to TOI -15.2 17.7 - -15.2 17.6 - 7.4 2.6 - Minority Interest - - - 0.0 0.0 - 0.0 0.0 0.0 PAT (adj. For MI) -191.6 161.8 - -191.6 212.8 - 342.7 90.5 278.5 Face Value 5.0 5.0 - 5.0 5.0 - 5.0 5.0 - Equity Share capital 54.7 54.7 - 54.7 54.7 - 54.7 54.7 - EPS (Rs.) -17.3 15.2 - -17.3 19.5 - 31.2 8.7 256.9 CEPS (Rs.) -14.6 17.7 - -14.6 22.0 - 42.4 19.4 118.6 nd Tuesday, 22 May, 2012
  • 4. Quarterly Result Update P/E Bands P/B Bands EV/EBITDA Bands 2000 2000 25000 1500 1800 1000 1600 20000 1400 500 1200 15000 0 1000 Dec-00 Dec-02 Dec-04 Dec-06 Dec-08 Dec-10 Dec-12 -500 800 10000 -1000 600 -1500 400 5000 -2000 200 -2500 0 0 Dec-00 Dec-02 Dec-04 Dec-06 Dec-08 Dec-10 Dec-12 Dec-00 Dec-02 Dec-04 Dec-06 Dec-08 Dec-10 Dec-12 CMP 8X 11.685X 15.37X 19.055X 22.74X CMP 1X 2.55X 4.1X 5.65X 7.2X EV 5X 7.63X 10.26X 12.89X 15.52X NIFTY Comparison BSE-Healthcare Comparison 250.00 250.0 200.00 200.0 150.00 150.0 100.00 100.0 50.00 50.0 0.00 0.0 May-11 Jul-11 Sep-11 Nov-11 Jan-12 Mar-12 May-11 Jul-11 Sep-11 Nov-11 Jan-12 Mar-12 Wockhardt NIFTY Wockhardt BSEHC nd Tuesday, 22 May, 2012
  • 5. Quarterly Result Update Financial & Projections Y/E March, Fig in Rs. Cr FY 2011 FY 2012e FY 2013e FY 2014e Y/E March, Fig in Rs. Cr FY 2011 FY 2012e FY 2013e FY 2014e Profit & Loss Statement Per Share Data (Rs) Net Sales 3751.2 4613.8 5208.7 5681.5 EPS 8.7 35.1 73.9 88.5 % Chg. 23.0 12.9 9.1 Cash EPS 19.4 46.3 86.5 101.9 Total Expenditure 2842.5 3174.1 3605.7 3853.3 DPS 0.0 0.0 0.0 0.0 % Chg. 11.7 13.6 6.9 Book Value 103.0 134.5 208.3 296.4 EBITDA 908.7 1439.7 1603.1 1828.2 Capital, Liquidity, Returns Ratio EBITDA Margin % 24.2 31.2 30.8 32.2 Debt / Equity (x) 3.4 2.0 1.5 0.8 Other Income 15.9 23.5 26.5 30.5 Current Ratio (x) 2.3 1.6 2.3 2.2 Exceptional items 436.6 506.8 0.0 0.0 ROE (%) 8.5 26.1 35.5 29.9 PBDIT 488.1 956.4 1629.5 1858.7 ROCE (%) 9.8 21.5 28.8 31.9 Depreciation 116.6 122.5 138.0 147.0 Dividend Yield (%) 0.0 0.0 0.0 0.0 Interest & Finance Charges 267.1 214.4 320.2 310.4 Valuation Ratio (x) PBT 104.3 619.5 1171.4 1401.3 P/E 82.1 20.4 9.7 8.1 Tax Provisions 8.6 235.1 363.1 432.9 P/BV 7.0 5.3 3.4 2.4 Reported PAT 95.7 384.3 808.2 968.4 EV/Sales 2.7 2.2 1.9 1.8 PAT Margin (%) 2.6 8.3 15.5 17.0 EV/EBIDTA 11.1 7.0 6.3 5.5 Efficiency Ratio (x) Manpower cost / Sales (%) 14.0 12.8 14.8 14.8 Inventory (days) 69.4 70.0 70.0 70.0 Other Exp / Sales (%) 20.1 19.6 18.8 18.5 Debtors (days) 58.9 60.0 60.0 60.0 Tax Rate (%) 8.3 38.0 31.0 30.9 Creditors (days) 42.5 45.0 45.0 45.0 Balance Sheet Cash Flow statement Share Capital 799.9 816.1 816.1 816.1 Profit After Tax 90.5 342.7 808.2 963.6 Reserves & Surplus 326.5 654.9 1463.2 2426.8 Depreciation 116.6 122.5 138.0 147.0 Minority Interest & Others 0.0 0.0 0.0 0.0 Working Capital Changes 258.0 578.6 -718.1 -86.2 Total Loans 3849.5 2967.2 3370.7 2587.1 Others 151.1 -126.5 0.0 0.0 Deferred Tax Iiability 0.0 0.0 0.0 0.0 Operating Cash Flow 616.2 917.4 228.1 1024.4 Total Liabilities 4975.9 4438.2 5649.9 5830.0 Capital Expenditure -214.3 -720.4 170.4 -300.0 Goodwill 0.0 0.0 0.0 0.0 Change in Investment -174.6 886.3 -879.3 -9.7 Gross Block 4048.7 4769.1 4598.6 4898.6 Cash Flow from Investing -389.0 165.9 -708.8 -309.7 Less: Acc. Depreciation 1468.4 1295.4 1433.4 1580.4 Proceeds from equity issue 76.6 16.2 0.0 0.0 Net Block 2580.2 3473.6 3165.3 3318.3 Inc/ Dec in Debt -168.0 -882.3 403.5 -783.6 Capital Work in Progress 887.4 0.0 878.4 887.1 Dividend and DDT 0.0 0.0 0.0 0.0 Investments 89.6 90.8 91.7 92.6 Cash Flow from Financing -91.4 -866.2 403.5 -783.6 Net Current Assets 1160.5 974.8 1615.7 1633.0 Net Change in Cash 135.9 217.1 -77.3 -68.9 Deferred Tax Assets 258.2 -101.0 -101.0 -101.0 Opening Cash Balance 347.0 482.9 700.0 622.7 Total Assets 4975.9 4438.2 5649.9 5830.0 Closing Cash Balance 482.9 700.0 622.7 553.9 nd Tuesday, 22 May, 2012
  • 6. Quarterly Result Update Ventura Securities Limited Corporate Office: C-112/116, Bldg No. 1, Kailash Industrial Complex, Park Site, Vikhroli (W), Mumbai – 400079 This report is neither an offer nor a solicitation to purchase or sell securities. The information and views expressed herein are believed to be reliable, but no responsibility (or liability) is accepted for errors of fact or opinion. Writers and contributors may be trading in or have positions in the securities mentioned in their articles. Neither Ventura Securities Limited nor any of the contributors accepts any liability arising out of the above information/articles. Reproduction in whole or in part without written permission is prohibited. This report is for private circulation. nd Tuesday, 22 May, 2012