SlideShare uma empresa Scribd logo
1 de 183
Baixar para ler offline
QQuuaalliittyy AAssssuurraannccee
IInnffoorrmmaattiioonn GGuuiiddee
1. Quality Assurance Terms and Acronyms
A B C D E F G H I J K L M N O P Q R S T U V W XYZ #
2. Acronyms of Technical Organizations (with website links)
3. Quality Standards List
4. Quality Assurance Definitions
A B C D E F G H I J K L M N O P Q R S T U V W XYZ
Page No. Beginning Definition Ending Definition
A
1 Abilene paradox Acceptance control chart
2 Acceptance sampling plan Activity Based Costing
3 Activity network diagram Am. Customer Satisfaction Index
4 Am. National Standards Institute Am. Std. Code for Info. Interchange
5 Analysis of Means Appearance item
6 Apportionment Assignable cause
7 Assn. for Quality and Participation Average chart
8 Average Outgoing Quality Axiomatic design
B
9 Baka-yoke Baseline measurement
10 Batch Bias
11 Big Q, little q Blocking
12 Board of Standards Review Brown–Forsythe test
13 BS 7799 Bx Life
C
14 c-chart Cascading
15 CASCO Certified Calibration Technician
16 Certified HACCP Auditor Chain reaction
17 Chain sampling plan Checklist
18 Check sheet Company culture
 
Page No. Beginning Definition Ending Definition
C
19 Complaint tracking Conformity assessment
20 Confounding Consumer risk
21 Contingency table Control limits
22 Control plan Correlation
23 Cost of Poor Quality Cost of Quality
24 Count chart Critical Product Measurements
25 Cross functional Current Reality Tree
26 Customer Cycle Time
D
27 Data Define, Measure, Analyze, Improve,
Control
28 Define, Measure, Analyze, Design,
Verify
Deming prize
29 Deming's 14 points Dependent events
30 Deployment Design information checklist
31 Design of Experiment Design of Experiment
32 Design record Discrimination
33 Dissatisfiers Durability
E
34 Effect Empowerment
35 EN 46000 Evaporating Cloud
36 Evolutionary Operation External Work
F
37 F-tests Failure mode avoidance
38 Failure Mode and Effects Analysis First In, First Out
39 First Pass Yield Five S’s
40 Five whys Force field analysis
41 FSNP Future Reality Tree
G
42 Gauge Repeatability and
Reproducibility
Genchi Genbutsu
43 Genjitsu Green Belt
44 Group dynamic Groupthink
H
45 Hawthorne effect Histogram
46 Hooke's Law House of quality
I
47 Imagineering Informative inspection
48 Indifference Quality Level Inspection, reduced
49 Inspection, tightened Internal work
50 Intra Class Correlation Inventory
Page No. Beginning Definition Ending Definition
I 51 Ishikawa Diagrams ISO/TS 16949
J 52 J.D. Power and Associates Just-In-Time Training
K
53 Kaizen Key characteristics
54 Key Performance Indicators Kruskal-Wallis test
L
55 Laboratory Lean manufacturing/production
56 Lean migration Listening post
57 Load-load Lower Control Limit
M
58 Machine capability (Cmk) Manufacturing Resource Planning
59 Mapping symbols or icons Measurement
60 Measurement error Metrology
61 MIL-Q-9858A Moving range chart
62 Muda Myers-Briggs Type Indicator
N
63 n Nonconformity
64 Non-Destructive Testing and Eval. Numerical Evaluation of Metrics
O
65 Objective Operations
66 Original Equipment Manufacturer Ownership
P
67 Packaging Part Submission Warrant
68 Paynter chart PICK chart
69 P.I.S.M.O.E.A error model Poka-yoke
70 Policy Probability
71 Probability density function Process analysis tools
72 Process average quality Process capability studies
73 Process capability studies (cont’d) Process kaizen
74 Process location Process potential index (Cp)
75 Process quality Production part app. submissions
76 Production smoothing Pull system
Q
77 QEDS Standards Group Quality assurance/quality control
78 Quality assurance plan Quality Improvement
79 Quality Lever Quality management principle
80 Quality Management System Quality rate
81 Quality records Quincunx
R
82 RABQSA International Random sampling
83 Rational subgroup Registrar
84 Registration Required waste
85 Requirements Risk management
Page No. Beginning Definition Ending Definition
R
86 Risk Priority Number Root Sum Squared Analysis
87 Run chart Runner
S
88 SAE International Sampling, single
89 Sampling, unit s chart
90 Scorecard Severity
91 Shadow board Simultaneous engineering
92 Single-minute exchange of dies Special causes
93 Software quality assurance Stability
94 Stages of team growth Standard work
95 Standard work instructions Strategic planning
96 Stratification Supermarket
97 Supplier quality assurance Survey
98 Sustain System kaizen
T
99 Taguchi methods Technical Report
100 Technical Specification Timing plan
101 TL 9000 Total Defects per Unit
102 Total productive maintenance Transition Tree
103 Tree diagram Type II errors
U 104 u-chart Uptime
V
105 Validation Value stream manager
106 Value Stream Map Virtual team
107 Vision Voluntary standard
W 108 Waiver World-class quality
XYZ 109 x Zero Defects
5. People in Quality Biographies
6. Addendums
7. Bibliography
Definitions, Terms and Acronyms were taken from existing terminology standards with references.
William L. Harbin
Technical director
BND TechSource – Kuching, Malaysia
(last update 15MAR10)
Bill Harbin
Digitally signed by Bill Harbin
DN: cn=Bill Harbin, o=BND
TechSource, ou=BND TechSource,
email=harbin_bill@yahoo.com, c=US
Date: 2010.03.17 10:24:06 +08'00'
Quality Acronyms – Page 1 (Return to Index)
A2LA - American Association for Laboratory Accreditation (more)
AAR - Appearance Approval Report (more)
ABC - Activity Based Costing (more)
ACSI - American Customer Satisfaction Index (more)
AHP - Analytical Hierarchy Process (more)
AIAG - Automotive Industry Action Group (more)
AKC - Assembly Key Characteristics (more)
ANOM - Analysis of Means (more)
ANOVA - Analysis of Variance (more)
ANSI - American National Standards Institute (more)
ANSI-ASQ - American National Standards Institute-American Society for Quality (more)
AOQ - Average Outgoing Quality (more)
AOQL - Average Outgoing Quality Limit (more)
APLAC - Asia Pacific Laboratory Accreditation Cooperation (more)
APQP - Advanced Product Quality Planning (more)
APQC - American Productivity & Quality Council
AQIP - Academic Quality Improvement Project (more)
AQL - Acceptable Quality Level or Average Quality Level (more)
AQP - Assn. for Quality and Participation (more)
ARL - Average Run Length (more)
ASCII - American Standard Code for Information Interchange (more)
ASN - Average Sample Number (more)
ASNT - American Society for Nondestructive Testing (more)
ASQ - American Society for Quality (more)
Quality Acronyms – Page 2 (Return to Index)
ASQC - American Society for Quality Control (more)
ASTD - American Society for Training and Development (more)
ASTM - American Society for Testing and Materials (more)
ATI - Average Total Inspection (more)
Quality Acronyms – Page 3 (Return to Index)
BAT- Best Available Techniques
BB - Black Belt (more)
BCR - Blast Create Refine
BIC (AP) - Best in Class (Action Plans)
BIST - Built-In Self Test
BKM - Best Known Methods
BOK - Body of Knowledge (more)
BOM - Bill Of Material (more)
BPM - Business Process Management
BPMS - Business Process Management System (more)
BPO - Business Process Outsourcing
BPR - Business Process Reengineering (more)
BSR - Board of Standards Review (more); Buzz, Squeak, Rattle
BTS - Build-To-Schedule Ratio (more)
Quality Acronyms – Page 4 (Return to Index)
CAB - Corrective Action Board; Competitive Analysis Benchmarking
CAD - Computer Aided Design (more)
CAE - Computer Aided Engineering (more)
CAF - Common Assessment Framework
CAM - Computer Aided Manufacturing (more)
CAPA - Corrective And Preventive Action (more)
CAPS - Computer-Assisted Problem Solving
CAR - Corrective Action Report (Request, Recommendation) (more)
CAIT - Computer-Aided Inspection and Testing
CART - Classification and Regression Tree
CAT - Complex Adaptive Thinking
CBA - ASQ Certified Biomedical Auditor (more)
CC - Critical Characteristic (more)
C-chart - Count chart (more)
CCT - ASQ Certified Calibration Technician (more)
CE - Concurrent Engineering (more)
CFT - Cross Functional Team
CFA - Component Failure Analysis
CFR - Constant Failure Rate
CGMP - Current Good Manufacturing Practices (more)
CHA - ASQ Certified HACCP Auditor (more)
CHAID - Chi-square Automatic Interaction Detection (more)
CI - Continuous Improvement (more)
CIM - Computer Integrated Manufacturing
CIP - Continuous Improvement Program
CLCA - Closed-Loop Corrective Action (more)
CLL - Cycle Line Layout (more)
CMI - ASQ Certified Mechanical Inspector; superseded by CQI (more)
Quality Acronyms – Page 5 (Return to Index)
Cmk - Machine capability (more)
CMM - Capability Maturity Model (more); Coordinate Measuring Machine (more)
CMQ/OE - ASQ Certified Manager of Quality/Organizational Excellence (more)
CMS - Coordinate Measuring System
CMVSS - Canadian Motor Vehicle Safety Standards (per Transport Canada)
COB - Close Of Business
COP - Conformity of Production; Customer Ordered Production
COPQ - Cost of Poor Quality (more)
COQ - Cost of Quality (more)
CoV - Coefficient of Variance
Cp - Process potential index (more)
CPIM - Certified in Production and Inventory Management
CPIP - Current Product Improvement Team
Cpk - Process capability index (more)
CPM - Critical Path Method
CQA - ASQ Certified Quality Auditor (more)
CQE - ASQ Certified Quality Engineer (more)
CQI - ASQ Certified Quality Inspector (more); Continuous Quality Improvement (more)
CQIA - ASQ Certified Quality Improvement Associate (more)
CQM - ASQ Certified Quality Manager; superseded by CMQ/OE (more)
CQP - Critical Quality Problem
CQPA - ASQ Certified Quality Process Analyst (more)
CQT - ASQ Certified Quality Technician (more)
CRD - Conflict Resolution Diagram (more)
CRE - ASQ Certified Reliability Engineer (more)
CRM - Customer Relationship Management (more)
CRT - Current Reality Tree (more)
Quality Acronyms – Page 6 (Return to Index)
CSF - Critical Success Factors
CSI – Customer Satisfaction Index (more)
CSM - Customer-Supplier Model (more)
C-Sketch - Collaborative Sketch (more)
CSP - Continuous Sampling Plan
CSQE - Certified Software Quality Engineer (more)
CSSBB - ASQ Certified Six Sigma Black Belt (more)
CSSGB - ASQ Certified Six Sigma Green Belt (more)
CSU - Consistent Standard Units
C/T – Cycle Time (more)
CTC - Critical to Cost, Concept to Customer
CTD - Critical to Delivery
CTP - Critical to Process
CTQ - Critical to Quality (more)
CTQC - Critical to Quality Characteristic
CTS - Critical to Satisfaction
CUSUM - Cumulative Sum (more)
CWQC - Company Wide Quality Control
CWQI - Company Wide Quality Improvement
CY - Calendar Year
Quality Acronyms – Page 7 (Return to Index)
D-chart – Demerit chart (more)
DCOV - Define Characterize Optimize Verify (failure mode avoidance process)
DCP - Dimensional Control Plan / Dynamic Control Plan
DCT - Defect Control Tool
DD - Defect Density
DDMS - Defect Data Management System
DFA - Design For Assembly
DFC - Datum Flow Chain
DFE - Design For Excellence
DFMA - Design For Manufacturing and Assembly (more)
DFMEA - Design Failure Mode Effects Analysis (more)
DFMC - Design for Mass Customization
DFSS - Design For Six Sigma (more)
DFR - Design For Reliability
DIF-DOF - Design In Function - Design Out Failure
DM - Defect Management
DMADV - Design Measure Analyze Design Verify (more)
DMAIC (R) -Define, Measure, Analyze, Implement and Control (Realize) (more)
DMEDI - Define, Measure, Explore, Develop, Implement
DMR - Discrepant Material Report (SCAR)
DOE - Design Of Experiments (more)
DOPU - Defect Opportunities Per Unit
DP - Dual Phase
DPMO - Defects Per Million Opportunities
DPO - Defects Per Opportunity
DPR - Design Pre-Requisites
DPU - Defects Per Unit
DQR - Durability Quality Reliability
Quality Acronyms – Page 8 (Return to Index)
DRC - Design Rule Check
DTD - Dock to Dock (more)
DTR - Dimensional Test Report
DVER - Design rule Verification (more)
DVP&R - Design Verification Plan & Report (more)
Quality Acronyms – Page 9 (Return to Index)
E3 - Early Equipment Evaluation
EA - European Cooperation for Accreditation (more)
EAR - Engineering Action Request
EAU - Estimated Annual Usage
ECA - Engineering Capability Assessment
ECN - Engineering Change Notification
ECO - Engineering Change Order
ECR - Engineering Change Request
EDA - Exploratory Data Analysis
EDI - Electric Data Interchange (more)
EFR - Early Failure Rate (also ELF, IMF)
EI - Employee Involvement (more)
EIP - Equipment Improvement Program; Equipment Improvement Project
ELF - Early Life Failure (also EFR, IMF)
EWMA - Exponentially Weighted Moving Average
EPLS - Economic Production Lot Size
EPM - Equipment Performance Metrics
EQA - European Quality Award
ES - Engineering Specification
ESC - Early Stage Control
ESS - Environmental Stress Screening
ETQR - External Total Quality and Reliability
EVM - Earned Value Management
EVOP - Evolutionary Operation (more)
EWMA - Exponentially Weighted Moving Average
Quality Acronyms – Page 10 (Return to Index)
FA - Failure Analysis
FAA - Function Attribute Analysis
FACR - Findings, Analysis, Conclusions and Recommendations
FAIT - First Article Inspection and Test
FDC - Fault Detection and Classification
FEA - Finite Element Analysis
FEED – Front End Engineering and Design
FIFO - First In, First Out (more)
FIRTFT - Fix It Right The First Time
FLD - Forming Limit Diagram
FMA - Failure Mode Analysis (more)
FMEA - Failure Mode and Effects Analysis (more)
FMECA - Failure Mode Effects and Criticality Analysis (more)
FMEM - Failure Mode and Effects Management
FMS - Forms Management System; Facility Management System
FMVSS - Federal Motor Vehicle Safety Standards (per NHTSA)
FORM - First Order Reliability Method
FPY - First Pass Yield (more)
FRACAS - Failure Reporting Analysis, Corrective Action System
FRC - First Run Capability (more)
FRT - Future Reality Tree (more)
FSNP - Forming Storming Norming Performing (in team problem solving efforts) (more)
FTA - Fault Tree Analysis (more)
FTC - First Time Capability
FTQ - First Time Quality (more)
FTT - First Time Through (more)
Quality Acronyms – Page 11 (Return to Index)
GB - Green Belt (more)
GLP - Good Laboratory Practice
GCA - Global Customer Audit
GD&T – Geometric Dimensioning and Tolerancing (more)
GLP - Good Laboratory Practices (more)
GMP - Good Manufacturing Practices (more)
GR&R - Gauge Repeatability & Reproducibility (more)
Quality Acronyms – Page 12 (Return to Index)
HACCP - Hazard Analysis and Critical Control Point (more)
HALT - Highly Accelerated Life Test (more)
HASA - Highly Accelerated Stress Audits (more)
HASS - Highly Accelerated Stress Screening (more)
HPEM - Harr's Point Estimation Method
HRA - Human Reliability Analysis
HSE – Health, Safety, Environmental
Quality Acronyms – Page 13 (Return to Index)
IAAC - Inter-American Accreditation Cooperation (more)
IAR - International Accreditation Registry (more)
IATF - International Automotive Task Force (more)
ICC – Intra Class Correlation (more)
ICIS - In Control and In Specification
IDEA - Investigate, Design, Execute, Adjust
IDOV - Identify, Design, Optimize, Verify
ILAC - International Laboratory Accreditation Cooperation (more)
IMF - Infant Mortality Failure (also EFR, ELF)
I/MR - Individual/Moving Range (chart) (more)
IPE - Interpret, Plan, Execute (a problem-solving methodology)
IPO – Input(s), Process, Output(s)
IQ - Installation Qualification
IQL - Indifference Quality Level (more)
ISIR - Initial Sample Inspection Report (now PSW)
ISR - Initial Sample Report (now PSW)
ISW - Initial Sample Warrant (now PSW)
Quality Acronyms – Page 14 (Return to Index)
JIT - Just in Time (more)
JITT - Just in Time Training (more)
Quality Acronyms – Page 15 (Return to Index)
KCC - Key Control Characteristic
KLT - Key Life Test
KPA - Key Process Area
KPC - Key Process (Product) Characteristic (more)
KPI - Key Process (Product) Indicator (more)
KPIV - Key Process Improvement Variable (more)
KPOV - Key Process Output Variables (more)
KQI - Key Quality Indicator
Quality Acronyms – Page 16 (Return to Index)
LAR - Lot Age Report
LCA – Life Cycle Analysis, Life Cycle Assessment
LCC - Life Cycle Cost
LCL - Lower Control Limit (more)
LDA - Linear Discriminant Analysis
LFMEA - Logistics Failure Modes and Effects Analysis
LHS - Latin Hypercube Simulation
LOC - Level of Concern
LSL - Lower Specification Limit (more)
LTPD - Lot Tolerance Percentage Defective (more)
LUTI - Learn Use Train Inspect
Quality Acronyms – Page 17 (Return to Index)
MANOVA - Multi-variant Analysis of Variances
MAP - Manufacturing Automation Protocol
MBB - Master Black Belt (more)
M &TE - Measuring & Test Equipment
MBNQA - Malcolm Baldrige National Quality Award (more)
MBTI - Myers-Briggs Type Indicator (more)
MCS - Monte Carlo Simulation (more)
MCT - Machine Cycle Time
MDO - Multidisciplinary Design Optimization
MDR - Material Discrepancy Report (SCAR)
MDT - Module Development Team
MEOST - Multiple Environment Over Stress Test
MEPEM - Materials Equipment People Environment Methods
MKC - Manufacturing Key Characteristics (more)
MRA - Mutual Recognition Agreement (more)
MRP - Material Requirements Planning (more)
MRP II - Manufacturing Resource Planning (more)
MSA - Measurement System Analysis (more)
MSE - Mean Squared Error; Measurement System Evaluation (more)
MSDS - Material Safety Data Sheet
MTBF - Mean Time Between Failures (more)
MTQ - Motivation Teamwork Quality
MTR - Material Test Report
MTTA - Mean Time To Assist
MTTC - Mean Time To Correct
MTTCR - Mean Time To Correct and Recover
MTTF - Mean Time To Failure
MTTR - Mean Time To Repair
Quality Acronyms – Page 18 (Return to Index)
NBR - Negative Branch Reservations
NCR - Non-Conformance Report
NDE - Non-Destructive Evaluation (more)
NDT - Non-Destructive Testing (more)
NEM - Numerical Evaluation of Metrics (more)
NFF - No Fault Found
NGT - Nominal Group Technique (more)
NIST - National Institute of Standards and Technology (more)
NMR - Non-conformance Material Report
NP chart - Number of affected units chart (more)
Quality Acronyms – Page 19 (Return to Index)
OCLP - Ongoing Process Control Plan
OC - Operating Characteristic curve (more)
OCT - Operator Cycle Time
OEE - Overall Equipment Effectiveness (more)
OEM - Original Equipment Manufacturer (more)
OFAT - One Factor At a Time
OIC - Observe, Infiltrate, Collaborate (ways to grasp the situation)
OPT - Optimized Production Technology
OQ - Operational Qualification
OTED - One Touch Exchange of Dies (more)
OVAT - One Variable At a Time
Quality Acronyms – Page 20 (Return to Index)
PAPA - Part and Process Audit
PCA - Principal Component Analysis
P-chart - Percent chart (more)
PCP - Part Certification Process
PCPA - Process Control Plan Audit
PCR - Principle Component Regression
PDCA (E. Deming) or PDSA (W. Shewhart) - Plan Do Check (Study) Act (more)
PDF - Probability Density Function
PDLA - Plant Design Layout & Analysis
PDP - Product Development Planning
PDPC - Process Decision Program Chart
PDQ - Proactive Design for Quality
PDM – Product Data Management
PERT - Program Evaluation and Review Technique
PFA - Product Family Architecture
PFMEA - Process Failure Mode Effects Analysis (more)
PICK - Possible, Implement, Challenge and Kill (more)
PIP - Product Improvement Plan (more)
P.I.S.M.O.E.A - Part, Instrument, Standard, Method, Operator, Environment, &
Assumptions (more)
PIST - Percent of Inspection points Satisfying Tolerance (more)
PKC - Product Key Characteristics (more)
PLEX - Plant Experiments
PLM - Product Lifecycle Management
PM - Preventive Maintenance
PMAP - Process Map (more)
Quality Acronyms – Page 21 (Return to Index)
PMT - Program Management Team
P/N - Part Number
PO - Purchase Order
POM - Production & Operations Management
PONC - Price of Non-Conformance
PPAP - Production Parts Approval Process (more)
PPC - Pre-Product Clinic
Ppk - Process performance index (more)
PPM - Parts Per Million - defects per one million parts (more)
PQ - Performance Qualification
PQP - Purchasing Quality Procedure
PRA - Probabilistic Risk Assessment
PRT - Pre-requisite Tree (more)
PSW - Product Sample Warrant (more)
PTR - Performance Test Report; Product Technical Requirements
PTQ - Partnering for Total Quality
PVP&R - Process Validation Plan & Report
Quality Acronyms – Page 22 (Return to Index)
QA - Quality Assurance (more)
QADF - Quality Assurance Document File
QC - Quality Control (more)
QCD - Quality Cost Delivery
Q chart - Quality score chart (more)
QCIR - Quality Control Inspection Record
QFD - Quality Function Deployment (more)
QFS - Qualified for Sourcing
QITD - Quality is In The Detail
QIS - Quality Information System
QM - Quality Management (more)
QMS - Quality Management System (more)
QOO - Quality of Operations
QOS - Quality Operating System
QP - Quality Procedure
QPR - Quality Problem Report
QS-9000 - Quality System 9000 (superseded by ISO/TS 16949:2002)
QSA - Quality System Assessment (or Audit)
QSER - Questioning, Solving, Experimenting, Reflecting
QSIT - Quality System Inspection Technique (US Food & Drug Administration)
QSR - Quality System Requirements
QTAT - Quick Turn Around Time
QWL - Quality of Working Life
Quality Acronyms – Page 23 (Return to Index)
RAM - Reliability, Availability, and Maintainability
R Chart – Range Chart (more)
RCA - Request for Corrective Action; Root Cause Analysis (more)
RBDO - Reliability Based Design Optimization
RFP - Request For Proposal
RFQ - Request For Quotation
RIMCY - Residuals, Interactions, Main, Cube, Y = c + mx (response optimization)
RMSEP - Root Mean Square Error of Prediction
ROCOF - Rate of Change of Failure
RPEM - Rosenblueth's Point Estimation Method
RPM - Recurrence Prevention Meeting
RPN - Risk Priority Number (ref: FMEA) (more)
RSM - Response Surface Method
RSS - Root Sum Square (more)
RSS Analysis - Root Sum Square Analysis (more)
RTY - Rolled Throughput Yield (more)
R&M - Reliability & Maintainability
Quality Acronyms – Page 24 (Return to Index)
SARA - Scan, Analyze, Respond, Assess
SC - Significant Characteristic
SCAMPER - Substitute, Combine, Adapt, Modify, Put (to other uses), Eliminate,
Reverse (more)
SCAR - Supplier Corrective Action Report
SCOR - Supply Chain Operations Reference (more)
SCORE - Supplier Cost Reduction Effort (Chrysler)
SCP - Systematic Creativity Process
SDE - Supplier Development Engineer
SDS - System Design Specification
SDWT - Self Directed Work Teams (more)
SET - Simultaneous Engineering Team
SFDC - Shop Floor Data Collection
SFMEA - System Failure Mode and Effects Analysis
SIC - Standard Industrial Classification
SIPOC - Suppliers-Inputs-Process-Outputs-Customers (process thinking-helps with
deriving the process map) (more)
SIT - Structured Inventive Thinking
SMART - Specific Measurable Achievable Relevant Time Bound
SMED - Single Minute Exchange of Dies (more)
S/N - Signal to Noise ratio (more)
SNN - Supplier Non-conformance Notice
SNR - Signal to Noise Ratio
SOFM - Self Organizing Feature Map
Quality Acronyms – Page 17 (Return to Index)
SOP - Standard Operating Procedure (more); Start of Production
SORM - Second Order Reliability Method
SOW - Statement of Work
SP - System Procedure
SPC - Statistical Process Control (more)
SPIT - Single Point in Time
SPS - Statistical Problem Solving
SPSM - Structured Problem Solving Methodologies
SQA - Software Quality Assurance (more); Supplier Quality Assistance (more)
SQC - Statistical Quality Control (more)
SQE - Supplier Quality Engineering
SQTF - Supplier Quality Task Force
SSDD - Six Sigma for Design and Development
SSI - Sales Satisfaction Index (JD Power)
STAC - Statistical Test Acceptance Criteria
STAP - Short-Term Action Program
STCA - Space and Time Characteristics Analysis
STEP - Standard for the Exchange of Product Model Data
SWIMTOO - Scrap-rework, Waiting, Inventory, Motion, Transportation, Over-processing,
Over-production (See 7 wastes)
SWOT - Strengths, Weaknesses, Opportunities, Threats (more)
Quality Acronyms – Page 25 (Return to Index)
T&E - Tooling & Equipment
TBD - To Be Determined
TDU - Total Defects per Unit (more)
TGR – Things Gone Right
TGW – Things Gone Wrong
TRIZ - Theory of Inventive Problem Solving; (Teoriya Resheniya Izobreatatelskikh
Zadatch) (more)
TMAP or TMP - Thought Process Map (more)
TOC - Theory of Constraints (more)
TOPS - Team Oriented Problem Solving
TPM - Total Productive Maintenance (more)
TPS - Toyota Production System (more)
TQC - Total Quality Control (more)
TQM - Total Quality Management (more)
TR - Technical Report (more)
TRT - Transition Tree (more)
TS - Technical Specification (more)
Quality Acronyms – Page 26 (Return to Index)
UCL - Upper Control Limit (more)
UDE - Undesired Effects
USL - Upper Specification Limit (more)
V4L - Variety, Velocity, Variability, Visibility & Learning
VA / VE - Value Analysis / Value Engineering (more)
VLQ - Vehicle Line Quality
VOC - Voice of the Customer (more)
VOP - Voice of Process (more)
VPDQ - Vehicle Product Data Quality
VRT - Variability Reduction Team
VSA – Variation Simulation Analysis (i.e. Vis VSA)
VSM - Value Stream Mapping (more)
WFM - Work Flow Measurement (Management)
WI - Work Instructions
WIIFM - What's in it for me
WYSIWYG – What you see is what you get
YTD - Year To Date
Quality Acronyms – Page 19 (Return to Index)
3D’s – Dirty, Dangerous, and Demeaning.
3 K’s - kiken (dangerous), kitanai (dirty), kitsui (stressful) - Japanese words referring to
hazards of the conventional work place.
3 M’s - muda (waste), mura (irregular, uneven or inconsistent), muri (unreasonable or
excessive strain).
3 R’s - The three fundamental steps of recording, recalling and reconstructing which
most innovators go through when generating new product ideas.
4 S’s - Arrangement, Organization, Cleanliness, Act of cleaning
5 P’s - Plant, Product, People, Policies, Procedures (can be used in a for fishbone)
5 S’s - Sort, Simplify, Sanitize, Standardize, Sustain (more)
Ordered actions used to achieve a clean, well-organized workplace.
5W2H - Who, What, When, Where, Why & How and How Many (root cause analysis)
6 M’s - Man, Method, Material, Measurement, Mother Nature, Machine
Categories representing the sources of variation.
7 P’s - Proper Prior Planning Prevents Pitifully Poor Performance
8 Wastes – Defects (Scrap-rework), Waiting, Inventory/Storage, Unnecessary
Movement (Motion), Transportation, Over-Processing, Over-Production, Under-
Utilization (of employees’ skills) (more)
8D - Eight Discipline Problem Solving Method and Report
Acronyms of Technical Organizations – Page 1 (Return to Index)
AALA or A2LA - American Association for Laboratory Accreditation
(http://www.a2la.org/)
AIAG - Automotive Industry Action Group (http://www.aiag.org/)
ANSI - American National Standards Institute (http://www.ansi.org/)
ASQ - American Society for Quality (http://www.asq.org/)
ASTM - American Society for Testing and Materials (http://www.astm.org/)
CSA - Canadian Standards Association (http://www.csa.ca/cm/ca/en/home)
DIN - Deutsches Institut für Normung e.V. (DIN; in English, the German Institute for
Standardization) (http://www.din.de/cmd?level=tpl-home&languageid=en)
EFQM - European Foundation for Quality Management (http://ww1.efqm.org/en/)
IAOB - International Automotive Oversight Bureau (http://www.iaob.org/)
IAQG - International Aerospace Quality Group (http://www.iaqg.sae.org/iaqg/)
IATF - International Automotive Task Force (http://www.iatfglobaloversight.org/)
ISO - International Standards Organization (http://www.iso.org/)
NHTSA - National Highway Traffic Safety Administration (http://www.nhtsa.dot.gov/)
SAE – Society of Automotive Engineers (http://www.sae.org/)
SCC - Standards Council of Canada (http://www.scc.ca/en/)
SME – Society of Manufacturing Engineers (http://www.sme.org/)
TC - Transport Canada (http://www.tc.gc.ca/eng/acts-regulations/regulations-crc-
c1038.htm)
TÜV - Technischer Überwachungs-Verein, (Technical Inspection Association in English)
(http://www.tuv.com/global/en/index.html)
UNECE - United Nations Economic Commission for Europe - Translation of UNECE
regulations in the area of vehicle approval
(http://ec.europa.eu/enterprise/sectors/automotive/documents/unece/table/index_en.htm
)
Quality Standards List – Page 1 (Return to Index)
AS9100 - Quality Management System Requirements for Design and/or Manufacture of
Aerospace Products
AS9110 - Quality Management System Requirements for Maintenance Organizations
AS9120 - Quality Management System Requirements for Stock list Distributors
AS9003 - Inspection & Testing (USA only)
AS9006 - Aerospace Deliverable Software Supplement to AS9100 standards (USA
only)
ISO-9000 (series of standards) - Quality standard for evaluating Quality Management
Systems (QMS)
ISO-14001 - Standard that sets out how you can go about putting in place an effective
Environmental Management System (EMS)
ISO/IEC 27001 - Formally specifies a management system that is intended to bring
information security under explicit management control
ISO/TS 16949 - An ISO technical specification which aligns existing US, German,
French and Italian automotive quality system standards within the global automotive
industry
Quality Definitions – Page 1 (Return to Index)
Abilene paradox
A paradox in which a group of people collectively decide on a course of action that is
counter to the preferences of any of the individuals in the group. It involves a common
breakdown of group communication in which each member mistakenly believes that
their own preferences are counter to the group's, and therefore, does not raise
objections. A common phrase relating to the Abilene paradox is "rocking the boat".
Academic Quality Improvement Project (AQIP)
A forum for higher education institutions to review one another’s action projects.
Accelerated test
Test in which the applied stress level is chosen to exceed that stated in the reference
conditions in order to shorten the time required to observe the stress response of the
item, or to magnify the response in a given duration. To be valid, an accelerated test
must not alter the basic modes and/or mechanisms of failure.
Acceptance quality limit
In a continuing series of lots, a quality level that, for the purpose of sampling inspection,
is the limit of a satisfactory process average.
Acceptance criteria
Specification criteria for acceptance of individual product or service characteristics.
Sometimes, as in acceptance sampling, the term "acceptance criteria" is used for a set
of several characteristics rather than an individual characteristic.
Acceptance inspection
Inspection to determine whether an item or lot delivered or offered for delivery is
acceptable.
Acceptance number
The maximum number of defects or defectives allowable in a sampling lot for the lot to
be acceptable.
Acceptance sampling
Sampling inspection in which decisions are made to accept or not to accept a lot (or
other grouping of product, material, or service) based on the results of a sample or
samples selected from that lot.
Acceptance control chart
A graphical method for the dual purposes of evaluating a process in terms of: (a)
whether or not it can be expected to satisfy product or service requirements for the
characteristic(s) being measured, and (b) whether or not it is in a "state of statistical
control" with respect to within-sample or sub-group variability. Also see “Acceptance
Control Chart Example”.
Quality Definitions – Page 2 (Return to Index)
Acceptance sampling plan
A specific plan that indicates the sampling sizes and associated acceptance or
nonacceptance criteria to be used.
Accreditation
Certification by a recognized body of the facilities, capability, objectivity, competence
and integrity of an agency, service or operational group or individual to provide the
specific service or operation needed.
Accreditation body
An organization with authority to accredit other organizations to perform services such
as quality system certification.
Accredited registrars
Accredited Registrars are qualified organizations certified by a national body to perform
audits to the QS9000 standard and to register the audited facility as meeting these
requirements for a given commodity.
Acceptable Quality Level (AQL)
AQL is limit of a satisfactory process average at a particular quality level when a
continuing series of lots is considered. Also called “average quality level”.
Accuracy
The closeness of agreement between an observed value and an accepted reference
value. Also see “precision”.
ACLASS Accreditation Services
An ANSI-ASQ National Accreditation Board company that provides accreditation
services for: testing and calibration laboratories in accordance with ISO/IEC 17025;
reference material producers in accordance with ISO Guide 34; and inspection bodies in
accordance with ISO/IEC 17020.
Activity Based Costing (ABC)
A system for making business decisions based on cost information of fundamental
business activities as tasks related to product design, development, quality,
manufacturing, distribution, customer acquisition, service and support. ABC is
sometimes considered a form of business process re-engineering as it insists on
surfacing a manageable number of cost drivers that can be used to trace variable
business costs to customer, products and processes.
Quality Definitions – Page 3 (Return to Index)
Activity network diagram
An arrow diagram used in planning. Also see “Activity Network Diagram Example”.
Advanced Product Quality Planning (APQP)
A structured method of defining the steps necessary to ensure that a product satisfies
the customer. In the automotive industry, APQP is a systematic product introduction
process that aims to facilitate supply chain communication and ensure quality
throughout the vehicle development process. It is used during the design and
development of new vehicles and component systems to reduce the risk of unexpected
failure due to errors in design and manufacture. This is a structured method of defining
and establishing the steps necessary to assure that a product satisfies the customer.
Also see “PPAP”.
Adverse event
Healthcare term for any event that is not consistent with the desired, normal or usual
operation of the organization; also known as a sentinel event.
Affinity diagram
A way to organize facts, opinions, ideas and issues into natural groupings as an aid to
diagnosis on a complex problem. A large number of ideas are generated and then
organized into groupings to reveal major themes.
Agile manufacturing
Tools, techniques, and initiatives that enable a plant or company to thrive under
conditions of unpredictable change. Agile manufacturing not only enables a plant to
achieve rapid response to customer needs, but also includes the ability to quickly
reconfigure operations and strategic alliances to respond rapidly to unforeseen shifts in
the marketplace.
Alignment
Actions to ensure that a process or activity supports the organization’s strategy, goals
and objectives.
American Association for Laboratory Accreditation (A2LA)
An organization that formally recognizes another organization’s competency to perform
specific tests, types of tests or calibrations.
American Customer Satisfaction Index (ACSI)
Released for the first time in October 1994, an economic indicator and cross industry
measure of the satisfaction of U.S. household customers with the quality of the goods
and services available to them. This includes goods and services produced in the United
States and imports from foreign firms that have substantial market shares or dollar
sales. ASQ is a founding sponsor of the ACSI, along with the University of Michigan
Business School and the CFI Group.
Quality Definitions – Page 4 (Return to Index)
American National Standards Institute (ANSI)
A private, nonprofit organization that administers and coordinates the U.S. voluntary
standardization and conformity assessment system. It is the U.S. member body in the
International Organization for Standardization, known as ISO.
American National Standards Institute-American Society for Quality (ANSI-ASQ)
Organization that accredits certification bodies for ISO 9001 quality management
systems, ISO 14001 environmental management systems and other industry specific
requirements.
American Society for Nondestructive Testing (ASNT)
A technical society for non-destructive testing (NDT) professionals.
American Society for Quality (ASQ)
A professional, non-profit association that develops, promotes and applies quality
related information and technology for the private sector, government and academia.
ASQ serves more than 108,000 individuals and 1,100 corporate members in the United
States and 108 other countries.
American Society for Quality Control (ASQC)
Name of ASQ from 1946 through the middle of 1997, when the name was changed to
ASQ.
American Society for Testing and Materials (ASTM)
Non-profit organization that provides a forum for the development and publication of
voluntary consensus standards for materials, products, systems and services.
American Society for Testing and Materials (ASTM) International
International non-profit organization that provides a forum for the development and
publication of voluntary consensus standards for materials, products, systems and
services.
American Society for Training and Development (ASTD)
A membership organization providing materials, education and support related to
workplace learning and performance.
American Standard Code for Information Interchange (ASCII)
Basic computer characters accepted by all American machines and many foreign ones.
Quality Definitions – Page 5 (Return to Index)
Analysis of Means (ANOM)
A statistical procedure for troubleshooting industrial processes and analyzing the results
of experimental designs with factors at fixed levels. It provides a graphical display of
data. Ellis R. Ott developed the procedure in 1967 because he observed that
nonstatisticians had difficulty understanding analysis of variance. Analysis of means is
easier for quality practitioners to use because it is an extension of the control chart. In
1973, Edward G. Schilling further extended the concept, enabling analysis of means to
be used with non-normal distributions and attributes data in which the normal
approximation to the binomial distribution does not apply. This is referred to as analysis
of means for treatment effects. Also see “Analysis of Means (ANOM) Chart Example”.
Analysis of Variance (ANOVA)
A basic statistical technique for determining the proportion of influence a factor or set of
factors has on total variation. It subdivides the total variation of a data set into
meaningful component parts associated with specific sources of variation to test a
hypothesis on the parameters of the model or to estimate variance components. There
are three models: fixed, random and mixed.
Analytical Hierarchy Process (AHP)
Developed by Thomas Saaty, AHP provides a proven, effective means to deal with
complex decision making and can assist with identifying and weighting selection criteria,
analyzing the data collected for the criteria and expediting the decision-making process.
Andon board
A production area visual control device, such as a lighted overhead display. It
communicates the status of the production system and alerts team members to
emerging problems (from andon, a Japanese word meaning “light”). It is one of the main
tools of Jidohka. An example of visual management or visual control.
ANOVA Gauge Repeatability & Reproducibility
Is a Measurement Systems Analysis technique which uses Analysis of Variance
(ANOVA) random effects model to assess a measurement system. Also see “gauge
R&R”.
ANSI ACS X12
Transaction standards for electronic communication and shipping notification.
Appearance Approval Report (AAR)
A standard report form, to communicate information on product / part appearance.
Appearance item
A product that is visible once the vehicle is complete. Certain customers will identify
appearance items on the engineering drawings. In these cases, special approval for
appearance (color, grain, texture, etc.) is required prior to production part submissions.
Quality Definitions – Page 6 (Return to Index)
Apportionment
Synonymous with the term Reliability Apportionment, which is the assignment of
reliability goals from system to subsystem in such a way that the whole system will have
the required reliability.
Appraisal cost
The cost of ensuring an organization is continually striving to conform to customers’
quality requirements.
Approved drawing
Is an engineering drawing signed by the engineer and released through the customer's
system.
Approved material
Approved Materials are materials governed either by industry standard specifications
(e.g., SAE, ASTM, DIN, ISO, etc.) or by customer specifications.
Arrow diagram
A planning tool to diagram a sequence of events or activities (nodes) and their
interconnectivity. It is used for scheduling and especially for determining the critical path
through nodes. Also see “ Arrow Diagram Example”.
AS9100
An international quality management standard for the aerospace industry published by
the Society of Automotive Engineers and other organizations worldwide. It is known as
EN9100 in Europe and JIS Q 9100 in Japan. The standard is controlled by the
International Aerospace Quality Group. Also see “JIS Q 9100”.
Asia Pacific Laboratory Accreditation Cooperation (APLAC)
A cooperative of laboratory accreditation bodies.
Assessment
A systematic evaluation procedure of collecting and analyzing data to determine the
current, historical or projected compliance of an organization to a standard. This process
includes a document review, an on-site audit, and an analysis and report. Customers
may also include a self-assessment, internal audit results and other materials in the
assessment.
Assignable cause
A name for the source of variation in a process that is not due to chance and therefore
can be identified and eliminated. Also called “special cause”.
Quality Definitions – Page 7 (Return to Index)
Assn. for Quality and Participation (AQP)
It was an independent organization until 2004, when it became an affiliate organization
of ASQ. Continues today as ASQ’s Team and Workplace Excellence Forum.
Attribute
The property a unit has of being either bad or good. That is, the quality characteristic of
a unit is either within the specified requirements or it is not.
Attribute data
Attributes data are qualitative data that can be counted for recording and analysis.
Examples include the presence or absence of a required label, the installation of all
required fasteners. Attributes data are not acceptable for production part submissions
unless variables data cannot be obtained. The control charts based on attribute data are
percent chart, number of affected units chart, count chart, count-per-unit chart, quality
score chart, and demerit chart.
Audit
The on-site verification activity, such as inspection or examination, of a process or
quality system, to ensure compliance to requirements. An audit can apply to an entire
organization or might be specific to a function, process or production step.
Automotive Industry Action Group (AIAG)
A global automotive trade association with about 1,600 member companies that focuses
on common business procedures, implementation guidelines, education and training.
Autonomation
A form of automation in which machinery automatically inspects each item after
producing it and ceases production and notifies humans if a defect is detected. Toyota
expanded the meaning of jidohka to include the responsibility of all workers to function
similarly—to check every item produced and, if a defect is detected, make no more until
the cause of the defect has been identified and corrected. Also see “jidohka”.
Availability
The ability of a product to be in a state to perform its designated function under stated
conditions at a given time.
Average amount of inspection
In a given sampling scheme, the number of items expected to be inspected per lot in
order to reach a decision for a certain average batch quality level.
Average chart
A control chart in which the subgroup average, X-bar, is used to evaluate the stability of
the process level. Also see “Control Chart Examples”.
Quality Definitions – Page 8 (Return to Index)
Average Outgoing Quality (AOQ)
The expected average quality level of outgoing product for a given value of incoming
product quality.
Average Outgoing Quality Limit (AOQL)
The maximum average outgoing quality over all possible levels of incoming quality for a
given acceptance sampling plan and disposal specification.
Average Run Lengths (ARL)
On a control chart, the number of subgroups expected to be inspected before a shift in
magnitude takes place.
Average Sample Number (ASN)
The average number of sample units inspected per lot when reaching decisions to
accept or reject.
Average Total Inspection (ATI)
The average number of units inspected per lot, including all units in rejected lots
(applicable when the procedure calls for 100% inspection of rejected lots).
A3 report
The A3 report is a tool used for problem solving in the course of work. The name "A3"
describes the size of paper on which the report is written. The steps of the report include
identifying a problem, understanding the current condition, determining the root cause,
developing a target condition, implementation plan, and follow-up plan. These steps are
all written and drawn (not typed) out on a single piece of A3 paper.
Axiomatic design
A systems design methodology using matrix methods to systematically analyze the
transformation of customer needs into functional requirements, design parameters, and
process variables.
Quality Definitions – Page 9 (Return to Index)
Baka-yoke
A Japanese term for a manufacturing technique for preventing mistakes by designing
the manufacturing process, equipment and tools so an operation literally cannot be
performed incorrectly. In addition to preventing incorrect operation, the technique
usually provides a warning signal of some sort for incorrect performance. Also see
“poka-yoke”.
Balanced array
In an experiment the array of factors and levels must be balanced. To satisfy this there
must be:
1. Equal numbers of levels in each column.
2. The Sum Product of each pair of columns equals zero (taking levels as '+' and '-').
Balanced plant
A plant in which the capacity of all resources is balanced exactly with market demand.
Balanced scorecard
A framework which translates a company's vision and strategy into a coherent set of
performance measures. A balanced business scorecard helps businesses evaluate how
well they meet their strategic objectives. It typically has four to six components, each
with a series of sub-measures. Each component highlights one aspect of the business.
The balanced scorecard includes measures of performance that are lagging (return on
capital, profit), medium-term indicators (like customer satisfaction indices) and leading
indicators (such as adoption rates for, or revenue from, new products).
Balancing the line
The process of evenly distributing both the quantity and variety of work across available
work time, avoiding overburden and underuse of resources. This eliminates bottlenecks
and downtime, which translates into shorter flow time.
Baldrige award
See “Malcolm Baldrige National Quality Award”.
Bartlett test
A form of F-test for more than 2 samples of data. Used for showing equal variances for
normal data. Bartlett's test is sensitive to departures from normality. That is, if your
samples come from non-normal distributions, then Bartlett's test may simply be testing
for non-normality. The Levene test and Brown-Forsythe test are alternatives to the
Bartlett test that are less sensitive to departures from normality.
Baseline measurement
The beginning point, based on an evaluation of output over a period of time, used to
determine the process parameters prior to any improvement effort; the basis against
which change is measured.
Quality Definitions – Page 10 (Return to Index)
Batch
A definite quantity of some product or material produced under conditions that are
considered uniform.
Batch and queue
Producing more than one piece and then moving the pieces to the next operation before
they are needed.
Bathtub curve
The sum of all reliability failures over time. Consists of the effects of early life failures,
useful life failures and wear out failures.
Bayes’ theorem
A formula to calculate conditional probabilities by relating the conditional and marginal
probability distributions of random variables.
Bayesian inference
A numerical estimate of the degree of belief in a hypothesis before and after evidence
has been observed.
Benchmarking
A technique in which a company measures its performance against that of best in class
companies, determines how those companies achieved their performance levels and
uses the information to improve its own performance. Subjects that can be
benchmarked include strategies, operations and processes.
Benchmark data
The results of an investigation to determine how competitors and/or best-in-class
companies achieve their level of performance.
Benefit-cost analysis
An examination of the relationship between the monetary cost of implementing an
improvement and the monetary value of the benefits achieved by the improvement, both
within the same time period.
Best practices
A superior method or innovative practice that contributes to the improved performance
of an organization, usually recognized as best by other peer organizations.
Bias
A systematic error which contributes to the difference between a population mean of
measurements or test results and an accepted reference value. It is the difference
between the observed range of measurements and a reference (known) value.
Quality Definitions – Page 11 (Return to Index)
Big Q, little q
A term used to contrast the difference between managing for quality in all business
processes and products (big Q) and managing for quality in a limited capacity—
traditionally only in factory products and processes (little q).
Bimodal distribution
A statistical distribution having two modes - indicating a mixing of two populations such
as different shifts, machines, workers, etc.
Binomial distribution
The distribution of a binomial response variable, one which has two possible outcomes -
yes, no; pass, fail, etc.
Bill of Material (BOM)
Total list of all components/materials required to manufacture the product.
Black Belt (BB)
A leadership structure for Six-sigma process improvement teams. Black Belts are
highly-regarded, technically-oriented product or line personnel who have an ability to
lead teams as well as to advise management. Full-time team leader responsible for
implementing process improvement projects—define, measure, analyze, improve and
control (DMAIC) or define, measure, analyze, design and verify (DMADV)—within a
business to drive up customer satisfaction and productivity levels.
Blemish
An imperfection severe enough to be noticed but that should not cause any real
impairment with respect to intended normal or reasonably foreseeable use. Also see
“defect”, “imperfection” and “nonconformity”.
Block diagram
A diagram that shows the operation, interrelationships and interdependencies of
components in a system. Boxes, or blocks (hence the name), represent the
components; connecting lines between the blocks represent interfaces. There are two
types of block diagrams:
1. A functional block diagram, which shows a system’s subsystems and lower level
products and their interrelationships and which interfaces with other systems.
2. A reliability block diagram, which is similar to the functional block diagram but is
modified to emphasize those aspects influencing reliability.
They are heavily used in the engineering world in hardware design, software design,
and process flow diagrams. Also see “Block Diagram Example”.
Blocking
A technique used in classical DOE to remove the effects of unwanted noise or variability
from the experimental response so that only the effects from the control factors are
present in the response data.
Quality Definitions – Page 12 (Return to Index)
Board of Standards Review (BSR)
An American National Standards Institute board responsible for the approval and
withdrawal of American National Standards.
Body of Knowledge (BOK)
The prescribed aggregation of knowledge in a particular area an individual is expected
to have mastered to be considered or certified as a practitioner.
Bottleneck
Any resource whose capacity is equal to or less than the demand placed on it.
Bottom line
The essential or salient point; the primary or most important consideration. Also, the line
at the bottom of a financial report that shows the net profit or loss.
Boundary diagram
Graphical illustration of a process or product and its interfaces to other parts, processes,
sub-systems and systems. Also see “Boundary Diagram Example.”
Box plot
A box plot, also known as a box and whisker diagram, is a basic graphing tool that
displays centering, spread, and distribution of a continuous data set. Also see “Box and
Whisker Plot Analysis”.
Box Score reporting
Box Scores are used widely within lean accounting. The standard format of the box
score shows a 3-dimensional view of value stream performance; operational
performance measurements, financial performance, and how the value stream capacity
is being used. The capacity information shows how much of the capacity within the
value stream is used productively, how much is used to do non-productive activities, and
how much value stream capacity is available for use. The box score shows the value
stream performance on a single sheet of paper and using a simple and accessible
format. Also see “Box Score Reporting Example” and “Decision-Making using Box
Scores”.
Brainstorming
A method to get ideas from persons who are potential contributors. No criticism or
discussion of ideas is allowed until all the ideas are recorded. The ideas are critically
reviewed after the brainstorming session.
Breakthrough improvement
A dynamic, decisive movement to a new, higher level of performance.
Brown–Forsythe test
The Brown and Forsyth test statistic is the F statistic resulting from an ordinary one-way
analysis of variance on the absolute deviations from the median.
Quality Definitions – Page 13 (Return to Index)
BS 7799
A standard written by British commerce, government and industry stakeholders to
address information security management issues, including fraud, industrial espionage
and physical disaster. Might become an International Organization for Standardization
standard.
Build-To-Schedule Ratio (BTS)
A metric that measures how well a plant executes plans to produce precisely what
customers, in the proper sequence and mix.
Bulk materials
Products that do not have the characteristics of formed parts when received, but
become part of the product during the manufacturing process.
Business process
Series of logically related activities or tasks (such as planning, production, sales)
performed together to produce a defined set of results. Also called “business function”.
 
Business process mapping
Refers to activities involved in defining exactly what a business entity does, who is
responsible, to what standard a process should be completed and how the success of a
business process can be determined.
Business Process Management System (BPMS)
A nine step model enables companies to model, deploy and manage mission-critical
business processes, that span multiple enterprise applications, corporate departments.
BPMS is usually used for lesser mature processes to make them Repeatable &
Reliable.
The nine step approach includes:
1. Create Process Mission.
2. Document Process.
3. Document Customer & Process requirements.
4. Identify Output & Process Measures.
5. Build process management system.
6. Establish data collection plan.
7. Process performance monitoring.
8. Develop dashboards with spec limits & targets.
9. Identify improvement opportunities.
Business Process Reengineering (BPR)
The concentration on improving a business' process(es) to deliver output(s) that will
achieve results meeting the firm’s objectives, priorities and mission.
Bx Life
The time at which x% of parts are expected to have failed. For example, B5 Life = time
at which 5% of parts have failed.
Quality Definitions – Page 14 (Return to Index)
c-chart
See “count chart”.
Calibration
The comparison of a measurement instrument or system of unverified accuracy to a
measurement instrument or system of known accuracy to detect any variation from the
required performance specification.
Capability
The total range of inherent variation in a stable process determined by using data from
control charts.
Capability index
The ratio of tolerance to 6 sigma, or the upper specification limit (USL) minus the lower
specification limit (LSL) divided by 6 sigma. It is sometimes referred to as the
engineering tolerance divided by the natural tolerance and is only a measure of
dispersion.
Measures of the capability of a manufacturing process to produce parts within given
upper and lower variability limits (tolerances). In a process that is in statistical control
(has only common causes of variation), as the Cp increases so does the difference
between what the process is capable of producing and what it is required to produce. A
Cp of 1 indicates 0.3 percent rejects or 3000 rejected parts per million (PPM), and is
called the condition of Three Sigma. A Cp of 2 indicates 0.0007 percent rejects or 7
rejected ppm, a condition of six sigma. Also called process capability index, production
capability index, or production capability ratio. Formula: (Upper variability limit - Lower
variability limit) ÷ 6 x Standard deviation of the spread of variation.
Capability Maturity Model (CMM)
A framework that describes the key elements of an effective software process. It’s an
evolutionary improvement path from an immature process to a mature, disciplined
process. The CMM covers practices for planning, engineering and managing software
development and maintenance to improve the ability of organizations to meet goals for
cost, schedule, functionality and product quality.
Capacity constraint resources
A series of non-bottlenecks (based on the sequence in which jobs are performed) that
can act as a constraint.
Cascading
The continuing flow of the quality message down to, not through, the next level of
supervision until it reaches all workers. Also see “deployment”.
Quality Definitions – Page 15 (Return to Index)
CASCO
An International Organization for Standardization policy development committee for
conformity assessment.
Cause
An identified reason for the presence of a defect or problem.
Cause and effect diagrams
A tool for analyzing process dispersion. Also see Fishbone or Ishikawa Diagrams. One
of the 7 Basic Tools of Quality Control. Also see “Ishikawa Diagram Example”.
Cell
An arrangement of people, machines, materials and equipment in which the production
(processing) steps are placed next to each other in sequential order and through which
parts are produced (processed) in a continuous flow. The most common cell layout is a
U shape.
Cellular manufacturing
Arranging machines in the correct production (processing) sequence, with operators
remaining within the cell and materials presented to them from outside.
CE mark
A mandatory conformity mark on many products placed on the single market in the
European Economic Area (EEA). The CE marking certifies that a product has met EU
consumer safety, health or environmental requirements. CE stands for Conformité
Européenne, "European conformity" in French.
Centerline
A line on a graph that represents the overall average (mean) operating level of the
process.
Central tendency
The tendency of data gathered from a process to cluster toward a middle value
somewhere between the high and low values of measurement.
Certification
The result of a person meeting the established criteria set by a certificate granting
organization.
Certified Biomedical Auditor (CBA)
An ASQ certification.
Certified Calibration Technician (CCT)
An ASQ certification.
Quality Definitions – Page 16 (Return to Index)
Certified HACCP Auditor (CHA)
An ASQ certification.
Certified Manager of Quality/Organizational Excellence (CMQ/OE)
An ASQ certification; formerly certified quality manager (CQM).
Certified Quality Auditor (CQA)
An ASQ certification.
Certified Quality Engineer (CQE)
An ASQ certification.
Certified Quality Improvement Associate (CQIA)
An ASQ certification.
Certified Quality Inspector (CQI)
An ASQ certification; formerly certified mechanical inspector (CMI).
Certified Quality Process Analyst (CQPA)
An ASQ certification.
Certified Quality Technician (CQT)
An ASQ certification.
Certified Reliability Engineer (CRE)
An ASQ certification.
Certified Six Sigma Black Belt (CSSBB)
An ASQ certification.
Certified Six Sigma Green Belt (CSSGB)
An ASQ certification.
Certified Software Quality Engineer (CSQE)
An ASQ certification.
Chain reaction
A chain of events described by W. Edwards Deming: improve quality, decrease costs,
improve productivity, increase market with better quality and lower price, stay in
business, provide jobs and provide more jobs.
Quality Definitions – Page 17 (Return to Index)
Chain sampling plan
In acceptance sampling, a plan in which the criteria for acceptance and rejection apply
to the cumulative sampling results for the current lot and one or more immediately
preceding lots.
Champion
A business leader or senior manager who ensures resources will be available for
training and projects, and who is involved in periodic project reviews; also an executive
who supports and addresses Six Sigma organizational issues.
Change agent
An individual from within or outside an organization who facilitates change in the
organization; might be the initiator of the change effort, but not necessarily.
Changeover
A process in which a production device is assigned to perform a different operation or a
machine is set up to make a different part—for example, a new plastic resin and new
mold in an injection molding machine.
Changeover time
The time required to modify a system or workstation, usually including both teardown
time for the existing condition and setup time for the new condition.
Characteristic
The factors, elements or measures that define and differentiate a process, function,
product, service or other entity.
Characteristic matrix
An analytical technique for displaying the relationship between process parameters and
manufacturing stations.
Chart
A tool for organizing, summarizing and depicting data in graphic form.
Charter
A written commitment approved by management stating the scope of authority for an
improvement project or team.
Checklist
A tool for ensuring that all the important steps or actions in an operation have been
taken. Checklists contain items important or relevant to an issue or situation. Checklists
are often confused with check sheets.
Quality Definitions – Page 18 (Return to Index)
Check sheet
A simple document that is used for collecting data in real-time and at the location where
the data is generated. The document is typically a blank form that is devised for the
quick, easy, and efficient recording of the desired information, which can be either
quantitative or qualitative. When the information is quantitative, the check sheet is
sometimes called a tally sheet. One of the 7 Basic Tools of Quality Control.
Chi-square Automatic Interaction Detection (CHAID)
A statistical technique used to segment customers on the basis of multiple alternative
variables. The analysis creates a segmentation tree and continues to add different
variables (branches), to the tree as long as it is statistically significant.
Classification of defects
The listing of possible defects of a unit, classified according to their seriousness. Note:
Commonly used classifications: class A, class B, class C, class D; or critical, major,
minor and incidental; or critical, major and minor. Definitions of these classifications
require careful preparation and tailoring to the product(s) being sampled to ensure
accurate assignment of a defect to the proper classification. A separate acceptance
sampling plan is generally applied to each class of defects.
Closed-Loop Corrective Action (CLCA)
A sophisticated engineering system to document, verify and diagnose failures,
recommend and initiate corrective action, provide follow-up and maintain
comprehensive statistical records. Code of conduct: Expectations of behavior are
mutually agreed upon by the team members.
Collaborative Sketch (C-Sketch)
Similar to Method 635, except that its starting point is the initial presentation of a single
design concept, as a sketch, by each of the team members.
Combinatorial optimization
The efficient allocation of limited resources to yield the best solution to meet the
objectives when the values of some or all of the variables must be integers and there
are many possible combinations.
Common causes
Used to refer to variation that happens in the same way from worker to worker, hour to
hour, lot to lot, etc. On a control chart, common causes by definition always fall within
control limits. Also see “special causes”.
Company culture
A system of values, beliefs and behaviors inherent in a company. To optimize business
performance, top management must define and create the necessary culture.
Quality Definitions – Page 19 (Return to Index)
Complaint tracking
Collecting data, disseminating them to appropriate persons for resolution, monitoring
complaint resolution progress and communicating results.
Compliance
The state of an organization that meets prescribed specifications, contract terms,
regulations or standards.
Computer Aided Design (CAD)
A type of software used by architects, engineers, drafters and artists to create precision
drawings or technical illustrations of their designs. CAD software can be used to create
2-D drawings or 3-D models.
Computer Aided Engineering (CAE)
A broad term used by the electronic design automation industry for the use of computers
to design, analyze and manufacture products and processes. CAE includes CAD and
computer aided manufacturing (CAM), which is the use of computers for managing
manufacturing processes.
Computer-aided manufacturing (CAM)
The use of computer software to control machine tools and related machinery in the
manufacturing of work pieces. CAM may also refer to the use of a computer to assist in
all operations of a manufacturing plant, including planning, management, transportation
and storage.
Concurrent Engineering (CE)
A way to reduce cost, improve quality and shrink cycle time by simplifying a product’s
system of life cycle tasks during the early concept stages.
Conflict resolution
The management of a conflict situation to arrive at a resolution satisfactory to all parties.
Conflict Resolution Diagram (CRD)
See “evaporating cloud”. (Part of the Theory of Constraints Thinking Process). Also see
“Conflict Resolution Diagram Example”.
Conformance
An affirmative indication or judgment that a product or service has met the requirements
of a relevant specification, contract or regulation.
Conformity assessment
All activities concerned with determining that relevant requirements in standards or
regulations are fulfilled, including sampling, testing, inspection, certification,
management system assessment and registration, accreditation of the competence of
those activities and recognition of an accreditation program’s capability.
.
Quality Definitions – Page 20 (Return to Index)
Confounding
Allowing two or more variables to vary together so that it is impossible to separate their
unique effects. If an experiment does not vary x and y separately then the effects of the
two factors cannot be distinguished. Blocking may be used to separate these effects
where one is expected to be a critical x and one appears to be noise. The main effects
and interactions can be confounded in order to reduce the number of runs in a fractional
factorial design of experiments.
Conjoint analysis
Involves measurement of psychological judgments (such as one's preferences) or
perceived similarities or differences between alternatives (for example - which factors -
price, quality, dealer location - are most important to customers when buying a new car).
Conjoint measurement
The difference from conjoint analysis is that it permits the use of rating when evaluating
pairs of attributes or attribute profiles.
Consensus
A state in which all the members of a group support an action or decision, even if some
of them don’t fully agree with it.
Constraint
Anything that limits a system from achieving higher performance or throughput; also, the
bottleneck that most severely limits the organization’s ability to achieve higher
performance relative to its purpose or goal.
Constraint analysis
The use of one or more constraint satisfaction algorithms to specify the set of feasible
solutions. Constraints are programmed in rules or procedures that produce solutions to
particular configuration and design problems using one or more constraint satisfaction
algorithms.
Constraints management
See “theory of constraints”.
Consultant
An individual who has experience and expertise in applying tools and techniques to
resolve process problems and who can advise and facilitate an organization’s
improvement efforts.
Consumer
The external customer to whom a product or service is ultimately delivered; also called
end user.
Consumer risk
Pertains to sampling and the potential risk that bad products will be accepted and
shipped to the consumer.
Quality Definitions – Page 21 (Return to Index)
Contingency table
A two-dimensional table constructed for classifying count data, the purpose of which is
to determine whether two variables are dependent (or contingent) on each other.
Continuous flow processing
A method in which items are produced and moved from one production (processing)
step to the next, one piece at a time. Each stage (process) makes only the one piece
that the next stage (process) needs, and the transfer batch size is one. Also referred to
as one-piece flow and single-piece flow.
Continuous Improvement (CI) Process
An ongoing effort to improve products, services or processes. These efforts can seek
"incremental" improvement over time or "breakthrough" improvement all at once.
Delivery (customer valued) processes are constantly evaluated and improved in the light
of their efficiency, effectiveness and flexibility.
Continuous Quality Improvement (CQI)
A philosophy and attitude for analyzing capabilities and processes and improving them
repeatedly to achieve customer satisfaction.
Continuous sampling plan
In acceptance sampling, a plan, intended for application to a continuous flow of
individual units of product, which involves acceptance and rejection on a unit-by-unit
basis and employs alternate periods of 100% inspection and sampling. The relative
amount of 100% inspection depends on the quality of submitted product. Continuous
sampling plans usually require that each t period of 100% inspection be continued until
a specified number, i, of consecutively inspected units are found clear of defects. Note:
For single level continuous sampling plans, a single d sampling rate (for example,
inspect one unit in five or one unit in 10) is used during sampling. For multilevel
continuous sampling plans, two or more sampling rates can be used. The rate at any
time depends on the quality of submitted product.
Control chart
Based on the statistical variation of any process - control charts help focus on stability of
a process. A graphical tool for monitoring a process and/or for determining where
variation lies; control charts show results over time, with +/- 3σ boundaries representing
the upper and lower control limits (UCL/LCLs). The chart frequently shows a central line
to help detect a trend of plotted values toward either control limit. One of the 7 Basic
Tools of Quality Control. Also see “Control Chart Examples”.
Control limits
The natural boundaries of a process within specified confidence levels, expressed as
the upper control limit (UCL) and the lower control limit (LCL).
Quality Definitions – Page 22 (Return to Index)
Control plan
Written descriptions of the systems for controlling part and process quality by
addressing the key characteristics and engineering requirements. They are written by
suppliers to address the important characteristics and engineering requirements of the
product. Each part shall have a Control Plan, but in many cases, "family" Control Plans
can cover a number of parts produced using a common process. Customer approval of
Control Plans may be required prior to production part submission.
Control methods
Standard methods implemented during the “control” phase of the DMAIC process
include: fix, minimize, standardize, measure and monitor, communicate and audit.
Controllable input(s)
Input variables (x’s) that can be changed to see the effect on process output variables
(y’s); sometimes called “Knob” variables.
Coordinate Measuring Machine (CMM)
A device that dimensionally measures 3-D products, tools and components with an
accuracy approaching 0.0001 inches (0.0025mm).
Corrective action
A solution meant to reduce or eliminate an identified problem.
Corrective Action Report (CAR)
The full cycle corrective action tool that offers ease and simplicity for employee
involvement in the corrective action/process improvement cycle.
Corrective and Preventive Action (CAPA)
CAPA focuses on the systematic investigation of discrepancies (failures and/or
deviations) in an attempt to prevent their recurrence (for corrective action) or prevent
from occurrence (for preventive action). To ensure that corrective and preventive actions
are effective, the systematic investigation of the failure incidence is pivotal in identifying
the corrective and preventive actions undertaken. CAPA is part of the overall quality
management system (QMS).
Correlation (statistical)
A measure of the relationship between two data sets of variables.
Quality Definitions – Page 23 (Return to Index)
Cost of Poor Quality (COPQ)
The costs associated with providing poor quality products or services. There are four
categories: internal failure costs (costs associated with defects found before the
customer receives the product or service), external failure costs (costs associated with
defects found after the customer receives the product or service), appraisal costs (costs
incurred to determine the degree of conformance to quality requirements) and
prevention costs (costs incurred to keep failure and appraisal costs to a minimum).
Cost of Quality (COQ)
The price of nonconformance (Philip B. Crosby) or the cost of poor quality (Joseph M.
Juran), the term 'Cost of Quality', refers to the costs associated with providing poor
quality product or service.
Quality processes cannot be justified simply because "everyone else is doing them" -
but return on quality (ROQ) has dramatic impacts as companies mature. Research
shows that the costs of poor quality can range from 15%-40% of business costs (e.g.,
rework, returns or complaints, reduced service levels, lost revenue). Most businesses do
not know what their quality costs are because they do not keep reliable statistics.
Finding and correcting mistakes consumes an inordinately large portion resource.
Typically, the cost to eliminate a failure in the customer phase is five times greater than
it is at the development or manufacturing phase. Effective quality management
decreases production costs because the sooner an error is found and corrected, the
less costly it will be.
Cost of quality comprises of four elements:
1 External Failure Cost
Cost associated with defects found after the customer receives the product or
service ex: processing customer complaints, customer returns, warranty claims,
product recalls.
2 Internal Failure Cost
Cost associated with defects found before the customer receives the product or
service ex: scrap, rework, re-inspection, re-testing, material review, material
downgrades.
3 Inspection (appraisal) Cost
Cost incurred to determine the degree of conformance to quality requirements
(measuring, evaluating or auditing) ex: inspection, testing, process or service
audits, calibration of measuring and test equipment.
4 Prevention Cost
Cost incurred to prevent (keep failure and appraisal cost to a minimum) poor quality
ex: new product review, quality planning, supplier surveys, process reviews, quality
improvement teams, education and training.
Quality Definitions – Page 24 (Return to Index)
Count chart (c-chart)
A type of control chart used to monitor "count"-type data, typically total number of
nonconformities per unit. It is also occasionally used to monitor the total number of
events occurring in a given unit of time. The c-chart differs from the p-chart in that it
accounts for the possibility of more than one nonconformity per inspection unit. Also see
“Control Chart Examples”.
Count per unit chart
A control chart for evaluating the stability of a process in terms of the average count of
events of a given classification per unit occurring in a sample. Also see “Control Chart
Examples”.
Cpk index
Equals the lesser of the USL minus the mean divided by 3 sigma (or the mean) minus
the LSL divided by 3 sigma. The greater the Cpk value, the better. Also see
“differentiating Cpk and Ppk values”.
Critical to Quality (CTQ) tree
Used to decompose broad customer requirements into more easily quantified
requirements. CTQs are what the customer expects of a product. The spoken needs of
the customer. These needs would then be converted to measurable terms using tools
such as DFMEA, etc.
Critical Characteristics (CC) (in FMEA)
Critical Characteristics are those product requirements (dimensions, performance tests)
or process parameters that can affect compliance with government regulations of safe
vehicle/product function and which require specific supplier, assembly, shipping, or
monitoring and inclusion on Control Plans. Critical characteristics are identified with the
inverted delta symbol.
Critical input(s)
x’s input for the tools (FMEA, DOE, SPC, etc.) and significant process knowledge have
proved to have a major impact on the variability of the y’s.
Critical process(es)
Process(es) that present serious potential dangers to human life, health and the
environment or that risk the loss of significant sums of money or customers.
Critical product measurements
Statistical measurements of the process capability in terms of its design specifications
(limits) and performance (variability). Used in quality control, Cpk takes into account
both accuracy (centering) and precision (dispersion) and helps determine the cause of
failures and the need for changes in the product design, tooling, or the manufacturing
process. Higher the Cpk value, greater the indication that the process is consistently
under control (is within limits). A Cpk value of 1.33 is considered the minimum and, as it
nears 2.0, the process approaches six sigma value meaning there are only 3.4 defective
units out of one million produced. Also see “process capability”.
Quality Definitions – Page 25 (Return to Index)
Cross functional
A term used to describe a process or an activity that crosses the boundary between
functions. A cross functional team consists of individuals from more than one
organizational unit or function.
Cross pilot
See “scatter diagram”.
Cultural resistance
A form of resistance based on opposition to the possible social and organizational
consequences associated with change.
Culture change
A major shift in the attitudes, norms, sentiments, beliefs, values, operating principles
and behavior of an organization.
Culture, organizational
A common set of values, beliefs, attitudes, perceptions and accepted behaviors shared
by individuals within an organization.
Cumulative Sum control charts (CUSUM)
A control chart on which the plotted value is the cumulative sum of deviations of
successive samples from a target value. The ordinate of each plotted point represents
the algebraic sum of the previous ordinate and the most recent deviations from the
target. The CUSUM approach uses the current and recent past process data to detect
small to moderate shifts in the process average or variability. CUSUM stands for
"cumulative sum" of deviations from the target and puts equal weight on the current and
recent past data. Also see “Cumulative Sum Control Chart Example”.
Current controls (in FMEA)
The mechanisms (for both design and process) which prevent the cause of the failure
mode from occurring, or detect the failure mode, should it occur, before the product
reaches your customer. For example, current controls include SPC, inspections, written
procedures, training, preventive maintenance and all other activities that ensure a
smooth running process.
Current Good Manufacturing Practices (CGMP)
Regulations enforced by the U.S. Food and Drug Administration for food and chemical
manufacturers and packagers.
Current Reality Tree (CRT)
A way of analyzing many system or organizational problems at once. By identifying root
causes common to most or all of the problems, the CRT can greatly aid focused
improvement of the system. (Part of the Theory of Constraints Thinking Process) Also
see “Current Reality Tree Example”.
Quality Definitions – Page 26 (Return to Index)
Customer
See “external customer” and “internal customer”.
Customer delight
The result of delivering a product or service that exceeds customer expectations.
Customer Relationship Management (CRM)
A strategy for learning more about customers’ needs and behaviors to develop stronger
relationships with them. It brings together information about customers, sales,
marketing, effectiveness, responsiveness, and market trends. It helps businesses use
technology and human resources to gain insight into the behavior of customers and the
value of those customers.
Customer satisfaction
The result of delivering a product or service that meets customer requirements.
Customer Satisfaction Index (CSI)
Introduced in 1994 by University of Michigan's Ross School of Business - CSI measures
customer satisfaction at national level.
Customer-Supplier Model (CSM)
A model depicting Inputs flowing into a work process that, in turn, add value and
produce Outputs delivered to a customer. Also called “customer-supplier methodology”.
Customer-supplier partnership
A long-term relationship between a buyer and supplier characterized by teamwork and
mutual confidence. The supplier is considered an extension of the buyer’s organization.
The partnership is based on several commitments. The buyer provides long-term
contracts and uses fewer suppliers. The supplier implements quality assurance
processes so incoming inspection can be minimized. The supplier also helps the buyer
reduce costs and improve product and process designs.
Cycle
A sequence of operations repeated regularly.
Cycle Line Layout (CLL)
CLL provides a visual overview (to depict opportunities to eliminate waste, which
enables process optimization) of a manufacturing process including - Operator Type
(Direct/Indirect) and Percentage Utilization of Direct Labor, Operator Density by
Workstation, Station Pitch, Line Side Layout including stock & stock storage methods &
Identification of main fixed facilities.
Cycle Time (C/T)
Time that elapses between one product exiting the process to the next product coming
out or the time it takes to complete a process step; typically the value-added time. If
cycle time for every operation in a complete process can be reduced to equal takt time,
products can be made in single-piece flow. Also see “takt time”.
Quality Definitions – Page 27 (Return to Index)
Data
A set of collected facts. There are two basic kinds of numerical data: measured or
variable data, such as “16 ounces,” “4 miles” and “0.75 inches;” and counted or attribute
data, such as “162 defects.”
Data analysis
Breaking down the data to draw significant insights. Steps involved in data analysis -
validate (make sure that the data is good), summarize (compute central tendency and
dispersion), assess (histograms, etc) search for structure (relationship between
variables with scatter plots, correlation, regression, etc), compare (mean, standard
deviation, etc) and present results and draw conclusions.
Decision matrix
A matrix teams use to evaluate problems or possible solutions. For example, a team
might draw a matrix to evaluate possible solutions, listing them in the far left vertical
column. Next, the team selects criteria to rate the possible solutions, writing them across
the top row. Then, each possible solution is rated on a scale of 1 to 5 for each criterion,
and the rating is recorded in the corresponding grid. Finally, the ratings of all the criteria
for each possible solution are added to determine its total score. The total score is then
used to help decide which solution deserves the most attention.
Defect
An event of nonconformance to specification. Occurrence is measured in DPU (Defects
Per Unit), DPO (Defects Per Opportunity), DPMO (Defects Per Million Opportunities) or
Sigma Level. A given unit may have any number of defects - based on the number of
opportunities. A unit with one or more defects is defective. Defects are caused by errors
and measured using c-chart or u-chart. A binomial distribution characterizes defectives.
There are four classes of defects: class 1, very serious, leads directly to severe injury or
catastrophic economic loss; class 2, serious, leads directly to significant injury or
significant economic loss; class 3, major, is related to major problems with respect to
intended normal or reasonably foreseeable use; and class 4, minor, is related to minor
problems with respect to intended normal or reasonably foreseeable use. Also see
“blemish”, “imperfection” and “nonconformity”.
Defective
A defective unit; a unit of product that contains one or more defects with respect to the
quality characteristic(s) under consideration.
Define, Measure, Analyze, Improve, Control (DMAIC)
An improvement system for existing processes which fall below specifications and need
to be improved incrementally.
Quality Definitions – Page 28 (Return to Index)
Define, Measure, Analyze, Design, Verify (DMADV)
An improvement system intended to develop new processes and/ or products at Six
Sigma quality levels.
Delighter
A feature of a product or service that a customer does not expect to receive but that
gives pleasure to the customer when received. Also called an “exciter”.
Delphi method
A systematic, interactive forecasting method which relies on a panel of experts. The
experts answer questionnaires in two or more rounds. After each round, a facilitator
provides an anonymous summary of the experts’ forecasts from the previous round as
well as the reasons they provided for their judgments. Thus, experts are encouraged to
revise their earlier answers in light of the replies of other members of their panel. Since
its creation, the method has been used frequently to make predictions, seek consensus
and generate ideas. The technique recognizes human judgment as legitimate and useful
contribution and allows experts to generate ideas systematically for a complex problem.
1. Form the team
2. Selection of experts - most studies use a 15-35 member panel
3. Develop the first set of question or issues for idea generation
4. Transmission of the first set of questions to experts
5. Analysis of the first round of responses and feedback
6. Preparation and transmission of the second set of questions
7. Analysis of the second round of responses
8. Resolution
Demerit chart (d-chart)
A control chart for evaluating a process in terms of a demerit (or quality score); in other
words, a weighted sum of counts of various classified nonconformities. Also see
“Control Chart Examples”.
Deming cycle
Another term for the plan-do-study-act cycle. Walter Shewhart created it (calling it the
plan-do-check-act cycle), but W. Edwards Deming popularized it, calling it plan-do-
study-act. Also see “plan-do-check-act cycle.
Deming prize
Award given annually to organizations that, according to the award guidelines, have
successfully applied companywide quality control based on statistical quality control and
will continue to do so. Although the award is named in honor of W. Edwards Deming, its
criteria are not specifically related to Deming’s teachings. There are three separate
divisions for the award: the Deming Application Prize, the Deming Prize for Individuals
and the Deming Prize for Overseas Companies. The award process is overseen by the
Deming Prize Committee of the Union of Japanese Scientists and Engineers in Tokyo.
Quality Definitions – Page 29 (Return to Index)
Deming's 14 points
1. Establish Constancy of Purpose: plan and manage to the plan; detect and correct
deviations.
2. Improve constantly and forever every system of production and service: small
continuous improvement is better than infrequent quantum leaps.
3. Eliminate numerical goals and quotas, including management by objective:
unsupported arbitrary objectives can be both restrictive & demoralizing.
4. Eliminate fear so that everyone may work effectively for the Company: mistakes
happen and fear of disclosure impedes correction.
5. Institute leadership: managers must not be cops or directors but rather coaches
of the creative team.
6. End the practice of awarding business largely on the basis of price: product
quality, product improvement and reliability of supply are important.
7. Break down the barriers between departments: encourage communication and
cooperation - eliminate chimneys and silos.
8. Institute training on the job: as product and process content grows, not all
employees come equally prepared.
9. Eliminate the annual rating or merit system: performance is subject to variation
whereas shared reward develops teamwork.
10.Institute a vigorous program of education and self-improvement: as employees
promote the company, the company must develop its employees.
11.Eliminate slogans and exhortations: management, not an individual worker, is
responsible for system performance.
12.Cease dependence on mass inspection: it is impractical to sort quality into a
system that produces bad product.
13.Adopt the new philosophy: every department of the company can quantitatively
measure its productivity.
14.Create a structure in top management to accomplish the transformation:
successful systems can only be introduced and maintained by top management.
Density function
The function which yields the probability that a particular random variable takes on any
one of its possible values.
Dependability
The degree to which a product is operable and capable of performing its required
function at any randomly chosen time during its specified operating time, provided that
the product is available at the start of that period. (Non-operation related influences are
not included.) Dependability can be expressed by the ratio: time available divided by
(time available + time required).
Dependent events
Events that occur only after a previous event.
Quality Definitions – Page 30 (Return to Index)
Deployment
Dispersion, dissemination, broadcasting or spreading communication throughout an
organization, downward and laterally. Also see “cascading”.
Detection (in FMEA)
An assessment of the likelihood that the current controls (design and process) will
detect the cause (process weakness) of the failure mode, should it occur, thus
preventing it from reaching your customer; the customer in this case could be the next
operation, subsequent operations, or the end user.
Design
The planning that lays the basis for the making of every object or system. Most
commonly linked with engineering. It can be used both as a noun and as a verb.
• As a verb, "to design" refers to the process of originating and developing a plan
for a product, structure, system, or component with intention.
• As a noun, "a design" is used for either the final (solution) plan (e.g. proposal,
drawing, model, description) or the result of implementing that plan in the form of
the final product of a design process.
Design Failure Mode Effects Analysis (DFMEA)
The application of the Failure Mode and Effects Analysis method specifically to product
design. It is a paper-and-pencil analysis method used in engineering to document and
explore ways that a product design might fail in real-world use. A DFMEA documents
the key functions of a design, the primary potential failure modes relative to each
function and the potential causes of each failure mode. The DFMEA method allows the
design team to document what they know and suspect about a product's failure modes
prior to completing the design, and then use this information to design out or mitigate
the causes of failure. See also FMEA.
Design for Manufacturability and Assembly (DFMA)
A simultaneous engineering method designed to optimize the relationship between
design function, manufacturability, and ease of assembly.
Design for Six Sigma (DFSS)
A separate and emerging business process management methodology related to
traditional Six Sigma. While the tools and order used in Six Sigma require a process to
be in place and functioning, DFSS has the objective of determining the needs of
customers and the business, and driving those needs into the product solution so
created. DFSS is relevant to the complex system/product synthesis phase, especially in
the context of unprecedented system development. It is process generation in contrast
with process improvement.
Design information checklist
A mistake proofing checklist designed to assure that all important items were considered
in establishing design requirements.
Quality Definitions – Page 31 (Return to Index)
Design of Experiment (DOE)
DOE is a systematic approach to investigation of a system or process. A series of
structured tests are created in which planned changes are made to the input variables of
a process or system. The effects of these changes on a pre-defined output are then
assessed.
'One change at a time' testing always carries the risk that the experimenter may find one
input variable to have a significant effect on the response (output) while failing to
discover that changing another variable may alter the effect of the first (i.e. some kind of
dependency or interaction).
This is because the temptation is to stop the test when this first significant effect has
been found. In order to reveal an interaction or dependency, 'one change at a time'
testing relies on the experimenter carrying the tests in the appropriate direction. In terms
of resource the exact length and size of the experiment are set by the design (i.e. before
testing begins).
DOE is important as a formal way of maximizing information gained while resources
required. It has more to offer than 'one change at a time' experimental methods,
because it allows a judgment on the significance to the output of input variables acting
alone, as well input variables acting in combination with one another.
DOE can be used to find answers in situations such as "what is the main contributing
factor to a problem?", "how well does the system/process perform in the presence of
noise?", "what is the best configuration of factor values to minimize variation in a
response?" etc. In general, these questions are given labels as particular types of study.
In the examples given above, these are problem solving, parameter design and
robustness study. In each case, DOE is used to find the answer; the only thing that
marks them different is which factors would be used in the experiment.
The order of tasks to using this tool starts with identifying the input variables and the
response (output) that is to be measured.
For each input variable, a number of levels are defined that represent the range for
which the effect of that variable is desired to be known. An experimental plan is
produced which tells the experimenter where to set each test parameter for each run of
the test. The response is then measured for each run. The method of analysis is to look
for differences between response (output) readings for different groups of the input
changes. These differences are then attributed to the input variables acting alone (called
a single effect) or in combination with another input variable (called an interaction).
DOE is team oriented with a variety backgrounds (e.g. design, manufacturing, statistics
etc.) should be involved when identifying factors and levels and developing the matrix as
this is the most skilled part. Moreover, as this tool is used to answer specific questions,
the team should have a clear understanding of the difference between control and noise
factors.
In order to draw the maximum amount of information a full matrix is needed which
contains all possible combinations of factors and levels. If this requires too many
experimental runs to be practical, fractions of the matrix can be taken dependent on
which effects are of particular interest. The fewer the runs in the experiment the less
information is available.
Quality Definitions – Page 32 (Return to Index)
Design record
Engineering requirements typically contained in various formats; examples include
engineering drawings, math data and referenced specifications. Designing in quality
versus inspecting in quality. Also see “prevention versus detection”.
Design reviews
A proactive procedure to prevent problems and misunderstandings during the design
and development of a product or process.
Design validation
Testing to ensure that product conforms to defined user needs and/or requirements.
Design validation follows successful design verification and is normally performed on the
final product under defined, operating conditions. Multiple validations may be performed
if there are different intended uses.
Design Verification (DVER)
Testing to ensure that all design output(s) meet design input requirements. Design
verification may include activities such as: Design Review, Performing Alternate
Calculations, Understanding Tests & Demonstrations and Review of Design Stage
Documents before Release.
Design Verification Plan and Report (DVP&R)
Summary form which lists each individual test, when it was performed, the specification,
results and the assessment pass/fail. Part of PPAP.
Deviation
In numerical data sets, the difference or distance of an individual observation or data
value from the center point (often the mean) of the set distribution.
Diagnosis
The activity of discovering the cause(s) of quality deficiencies; the practice of
investigating symptoms, collecting and analyzing data, and conducting experiments to
test theories to determine the root cause(s) of deficiencies.
Diagnostic journey and remedial journey
A two-phase investigation used by teams to solve chronic quality problems. In the first
phase, the diagnostic journey, the team journeys from the symptom of a chronic
problem to its cause. In the second phase, the remedial journey, the team journeys from
the cause to its remedy.
Discrimination (in MSE)
The technological ability of the measurement system to adequately differentiate
between measured values for a selected parameter.
Quality Assurance Guide with Definitions and Acronyms

Mais conteúdo relacionado

Mais procurados

Quality Objective, Policy and Core values of Ascend Telecom
Quality Objective, Policy and Core values of Ascend TelecomQuality Objective, Policy and Core values of Ascend Telecom
Quality Objective, Policy and Core values of Ascend TelecomDr. Harry Charles Devasagayam
 
An introduction to the PDCA cycle
An introduction to the PDCA cycle An introduction to the PDCA cycle
An introduction to the PDCA cycle Alan M. Jones
 
ISO 9001 2015 Overview presentation
ISO 9001 2015 Overview presentation ISO 9001 2015 Overview presentation
ISO 9001 2015 Overview presentation Govind Ramu
 
Awareness of qms
Awareness of qmsAwareness of qms
Awareness of qmsalabs
 
Core tools apqp, ppap, fmea, spc and msa
Core tools   apqp, ppap, fmea, spc and msa Core tools   apqp, ppap, fmea, spc and msa
Core tools apqp, ppap, fmea, spc and msa Mouhcine Nahal
 
What is quality, Quality Policy and Objectives?
What is  quality, Quality Policy and Objectives?What is  quality, Quality Policy and Objectives?
What is quality, Quality Policy and Objectives?Connie Dello Buono
 
411705005-IATF-16949-PPT-TRAINING-AWARENESS.pptx
411705005-IATF-16949-PPT-TRAINING-AWARENESS.pptx411705005-IATF-16949-PPT-TRAINING-AWARENESS.pptx
411705005-IATF-16949-PPT-TRAINING-AWARENESS.pptx401apecgkvelu
 
Ppap training-presentation
Ppap training-presentationPpap training-presentation
Ppap training-presentationRanvijay Akela
 
Iso 9001 quality policy
Iso 9001 quality policyIso 9001 quality policy
Iso 9001 quality policyvitomannone333
 
Cost of-poor-quality - juran institute
Cost of-poor-quality - juran instituteCost of-poor-quality - juran institute
Cost of-poor-quality - juran instituteManish Chaurasia
 
List of mandatory IATF 16949 documents
List of mandatory IATF 16949 documents List of mandatory IATF 16949 documents
List of mandatory IATF 16949 documents Global Manager Group
 
Quality Management System - ISO 9001-2015
Quality Management System - ISO 9001-2015Quality Management System - ISO 9001-2015
Quality Management System - ISO 9001-2015Abhishek Raj
 
Quality management system
Quality management systemQuality management system
Quality management systemPOONAM PARDHI
 
Iso 9001:2015 internal auditor Course
Iso 9001:2015  internal auditor Course Iso 9001:2015  internal auditor Course
Iso 9001:2015 internal auditor Course Atif Alhaj
 

Mais procurados (20)

ISO 9001:2015 Awareness
 ISO 9001:2015 Awareness  ISO 9001:2015 Awareness
ISO 9001:2015 Awareness
 
Quality Objective, Policy and Core values of Ascend Telecom
Quality Objective, Policy and Core values of Ascend TelecomQuality Objective, Policy and Core values of Ascend Telecom
Quality Objective, Policy and Core values of Ascend Telecom
 
An introduction to the PDCA cycle
An introduction to the PDCA cycle An introduction to the PDCA cycle
An introduction to the PDCA cycle
 
Measurement System Analysis
Measurement System AnalysisMeasurement System Analysis
Measurement System Analysis
 
ISO 9001 2015 Overview presentation
ISO 9001 2015 Overview presentation ISO 9001 2015 Overview presentation
ISO 9001 2015 Overview presentation
 
Awareness of qms
Awareness of qmsAwareness of qms
Awareness of qms
 
Core tools apqp, ppap, fmea, spc and msa
Core tools   apqp, ppap, fmea, spc and msa Core tools   apqp, ppap, fmea, spc and msa
Core tools apqp, ppap, fmea, spc and msa
 
Seven QC Tools Training; Quiz
Seven QC Tools Training; QuizSeven QC Tools Training; Quiz
Seven QC Tools Training; Quiz
 
Kaizen final ppt
Kaizen final pptKaizen final ppt
Kaizen final ppt
 
ISO 9001 2008 Part I
ISO 9001 2008 Part IISO 9001 2008 Part I
ISO 9001 2008 Part I
 
What is quality, Quality Policy and Objectives?
What is  quality, Quality Policy and Objectives?What is  quality, Quality Policy and Objectives?
What is quality, Quality Policy and Objectives?
 
411705005-IATF-16949-PPT-TRAINING-AWARENESS.pptx
411705005-IATF-16949-PPT-TRAINING-AWARENESS.pptx411705005-IATF-16949-PPT-TRAINING-AWARENESS.pptx
411705005-IATF-16949-PPT-TRAINING-AWARENESS.pptx
 
Ppap training-presentation
Ppap training-presentationPpap training-presentation
Ppap training-presentation
 
Iso standards
Iso standardsIso standards
Iso standards
 
Iso 9001 quality policy
Iso 9001 quality policyIso 9001 quality policy
Iso 9001 quality policy
 
Cost of-poor-quality - juran institute
Cost of-poor-quality - juran instituteCost of-poor-quality - juran institute
Cost of-poor-quality - juran institute
 
List of mandatory IATF 16949 documents
List of mandatory IATF 16949 documents List of mandatory IATF 16949 documents
List of mandatory IATF 16949 documents
 
Quality Management System - ISO 9001-2015
Quality Management System - ISO 9001-2015Quality Management System - ISO 9001-2015
Quality Management System - ISO 9001-2015
 
Quality management system
Quality management systemQuality management system
Quality management system
 
Iso 9001:2015 internal auditor Course
Iso 9001:2015  internal auditor Course Iso 9001:2015  internal auditor Course
Iso 9001:2015 internal auditor Course
 

Semelhante a Quality Assurance Guide with Definitions and Acronyms

Process Certification Implementation Presentation
Process Certification Implementation PresentationProcess Certification Implementation Presentation
Process Certification Implementation Presentationmdmilward
 
Procon Engineering Private Limited
Procon Engineering Private LimitedProcon Engineering Private Limited
Procon Engineering Private LimitedSaad_Sarfraz
 
1 marty howard_asq_qm_qe_resume
1 marty howard_asq_qm_qe_resume1 marty howard_asq_qm_qe_resume
1 marty howard_asq_qm_qe_resumeMarty Howard
 
1 marty howard_asq_qm_qe_resume
1 marty howard_asq_qm_qe_resume1 marty howard_asq_qm_qe_resume
1 marty howard_asq_qm_qe_resumeMarty Howard
 
1 marty howard_asq_qm_qe_resume
1 marty howard_asq_qm_qe_resume1 marty howard_asq_qm_qe_resume
1 marty howard_asq_qm_qe_resumeMarty Howard
 
Quality Management
Quality ManagementQuality Management
Quality ManagementJoanmaines
 
Costof quality
Costof qualityCostof quality
Costof qualityOmnex Inc.
 
Quality Management in production system
Quality Management in production systemQuality Management in production system
Quality Management in production systemAshek Farabi
 
Key Components of Pharmaceutical QbD, an Introduction
Key Components of Pharmaceutical QbD, an IntroductionKey Components of Pharmaceutical QbD, an Introduction
Key Components of Pharmaceutical QbD, an IntroductionSaurabh Arora
 
Tetrahedron Manufacturing Services training brochure
Tetrahedron Manufacturing Services training brochureTetrahedron Manufacturing Services training brochure
Tetrahedron Manufacturing Services training brochureNitin Kumar
 
Zero Defect Competition @ July 22.pptx
Zero Defect Competition  @ July 22.pptxZero Defect Competition  @ July 22.pptx
Zero Defect Competition @ July 22.pptxsonutyagi20
 

Semelhante a Quality Assurance Guide with Definitions and Acronyms (20)

Process Certification Implementation Presentation
Process Certification Implementation PresentationProcess Certification Implementation Presentation
Process Certification Implementation Presentation
 
Procon Engineering Private Limited
Procon Engineering Private LimitedProcon Engineering Private Limited
Procon Engineering Private Limited
 
Waste Elimination
Waste EliminationWaste Elimination
Waste Elimination
 
Quality Management
Quality ManagementQuality Management
Quality Management
 
1 marty howard_asq_qm_qe_resume
1 marty howard_asq_qm_qe_resume1 marty howard_asq_qm_qe_resume
1 marty howard_asq_qm_qe_resume
 
1 marty howard_asq_qm_qe_resume
1 marty howard_asq_qm_qe_resume1 marty howard_asq_qm_qe_resume
1 marty howard_asq_qm_qe_resume
 
5854579.ppt
5854579.ppt5854579.ppt
5854579.ppt
 
1 marty howard_asq_qm_qe_resume
1 marty howard_asq_qm_qe_resume1 marty howard_asq_qm_qe_resume
1 marty howard_asq_qm_qe_resume
 
Numan Fadel CV
Numan Fadel CV Numan Fadel CV
Numan Fadel CV
 
Pv roadmap
Pv roadmapPv roadmap
Pv roadmap
 
Quality Management
Quality ManagementQuality Management
Quality Management
 
Costof quality
Costof qualityCostof quality
Costof quality
 
Dennis Mulrane Skills
Dennis Mulrane SkillsDennis Mulrane Skills
Dennis Mulrane Skills
 
Ch8 total+qlty+mgt
Ch8 total+qlty+mgtCh8 total+qlty+mgt
Ch8 total+qlty+mgt
 
Quality Management in production system
Quality Management in production systemQuality Management in production system
Quality Management in production system
 
Opc pa
Opc paOpc pa
Opc pa
 
Key Components of Pharmaceutical QbD, an Introduction
Key Components of Pharmaceutical QbD, an IntroductionKey Components of Pharmaceutical QbD, an Introduction
Key Components of Pharmaceutical QbD, an Introduction
 
Q & QA design
Q & QA designQ & QA design
Q & QA design
 
Tetrahedron Manufacturing Services training brochure
Tetrahedron Manufacturing Services training brochureTetrahedron Manufacturing Services training brochure
Tetrahedron Manufacturing Services training brochure
 
Zero Defect Competition @ July 22.pptx
Zero Defect Competition  @ July 22.pptxZero Defect Competition  @ July 22.pptx
Zero Defect Competition @ July 22.pptx
 

Último

Microsoft 365 Copilot: How to boost your productivity with AI – Part one: Ado...
Microsoft 365 Copilot: How to boost your productivity with AI – Part one: Ado...Microsoft 365 Copilot: How to boost your productivity with AI – Part one: Ado...
Microsoft 365 Copilot: How to boost your productivity with AI – Part one: Ado...Nikki Chapple
 
Generative Artificial Intelligence: How generative AI works.pdf
Generative Artificial Intelligence: How generative AI works.pdfGenerative Artificial Intelligence: How generative AI works.pdf
Generative Artificial Intelligence: How generative AI works.pdfIngrid Airi González
 
Genislab builds better products and faster go-to-market with Lean project man...
Genislab builds better products and faster go-to-market with Lean project man...Genislab builds better products and faster go-to-market with Lean project man...
Genislab builds better products and faster go-to-market with Lean project man...Farhan Tariq
 
Digital Tools & AI in Career Development
Digital Tools & AI in Career DevelopmentDigital Tools & AI in Career Development
Digital Tools & AI in Career DevelopmentMahmoud Rabie
 
Varsha Sewlal- Cyber Attacks on Critical Critical Infrastructure
Varsha Sewlal- Cyber Attacks on Critical Critical InfrastructureVarsha Sewlal- Cyber Attacks on Critical Critical Infrastructure
Varsha Sewlal- Cyber Attacks on Critical Critical Infrastructureitnewsafrica
 
Generative AI - Gitex v1Generative AI - Gitex v1.pptx
Generative AI - Gitex v1Generative AI - Gitex v1.pptxGenerative AI - Gitex v1Generative AI - Gitex v1.pptx
Generative AI - Gitex v1Generative AI - Gitex v1.pptxfnnc6jmgwh
 
How to Effectively Monitor SD-WAN and SASE Environments with ThousandEyes
How to Effectively Monitor SD-WAN and SASE Environments with ThousandEyesHow to Effectively Monitor SD-WAN and SASE Environments with ThousandEyes
How to Effectively Monitor SD-WAN and SASE Environments with ThousandEyesThousandEyes
 
Landscape Catalogue 2024 Australia-1.pdf
Landscape Catalogue 2024 Australia-1.pdfLandscape Catalogue 2024 Australia-1.pdf
Landscape Catalogue 2024 Australia-1.pdfAarwolf Industries LLC
 
Transcript: New from BookNet Canada for 2024: BNC SalesData and LibraryData -...
Transcript: New from BookNet Canada for 2024: BNC SalesData and LibraryData -...Transcript: New from BookNet Canada for 2024: BNC SalesData and LibraryData -...
Transcript: New from BookNet Canada for 2024: BNC SalesData and LibraryData -...BookNet Canada
 
Microservices, Docker deploy and Microservices source code in C#
Microservices, Docker deploy and Microservices source code in C#Microservices, Docker deploy and Microservices source code in C#
Microservices, Docker deploy and Microservices source code in C#Karmanjay Verma
 
2024 April Patch Tuesday
2024 April Patch Tuesday2024 April Patch Tuesday
2024 April Patch TuesdayIvanti
 
Email Marketing Automation for Bonterra Impact Management (fka Social Solutio...
Email Marketing Automation for Bonterra Impact Management (fka Social Solutio...Email Marketing Automation for Bonterra Impact Management (fka Social Solutio...
Email Marketing Automation for Bonterra Impact Management (fka Social Solutio...Jeffrey Haguewood
 
Accelerating Enterprise Software Engineering with Platformless
Accelerating Enterprise Software Engineering with PlatformlessAccelerating Enterprise Software Engineering with Platformless
Accelerating Enterprise Software Engineering with PlatformlessWSO2
 
Unleashing Real-time Insights with ClickHouse_ Navigating the Landscape in 20...
Unleashing Real-time Insights with ClickHouse_ Navigating the Landscape in 20...Unleashing Real-time Insights with ClickHouse_ Navigating the Landscape in 20...
Unleashing Real-time Insights with ClickHouse_ Navigating the Landscape in 20...Alkin Tezuysal
 
UiPath Community: Communication Mining from Zero to Hero
UiPath Community: Communication Mining from Zero to HeroUiPath Community: Communication Mining from Zero to Hero
UiPath Community: Communication Mining from Zero to HeroUiPathCommunity
 
Long journey of Ruby standard library at RubyConf AU 2024
Long journey of Ruby standard library at RubyConf AU 2024Long journey of Ruby standard library at RubyConf AU 2024
Long journey of Ruby standard library at RubyConf AU 2024Hiroshi SHIBATA
 
QCon London: Mastering long-running processes in modern architectures
QCon London: Mastering long-running processes in modern architecturesQCon London: Mastering long-running processes in modern architectures
QCon London: Mastering long-running processes in modern architecturesBernd Ruecker
 
Bridging Between CAD & GIS: 6 Ways to Automate Your Data Integration
Bridging Between CAD & GIS:  6 Ways to Automate Your Data IntegrationBridging Between CAD & GIS:  6 Ways to Automate Your Data Integration
Bridging Between CAD & GIS: 6 Ways to Automate Your Data Integrationmarketing932765
 
Kuma Meshes Part I - The basics - A tutorial
Kuma Meshes Part I - The basics - A tutorialKuma Meshes Part I - The basics - A tutorial
Kuma Meshes Part I - The basics - A tutorialJoão Esperancinha
 
Microsoft 365 Copilot: How to boost your productivity with AI – Part two: Dat...
Microsoft 365 Copilot: How to boost your productivity with AI – Part two: Dat...Microsoft 365 Copilot: How to boost your productivity with AI – Part two: Dat...
Microsoft 365 Copilot: How to boost your productivity with AI – Part two: Dat...Nikki Chapple
 

Último (20)

Microsoft 365 Copilot: How to boost your productivity with AI – Part one: Ado...
Microsoft 365 Copilot: How to boost your productivity with AI – Part one: Ado...Microsoft 365 Copilot: How to boost your productivity with AI – Part one: Ado...
Microsoft 365 Copilot: How to boost your productivity with AI – Part one: Ado...
 
Generative Artificial Intelligence: How generative AI works.pdf
Generative Artificial Intelligence: How generative AI works.pdfGenerative Artificial Intelligence: How generative AI works.pdf
Generative Artificial Intelligence: How generative AI works.pdf
 
Genislab builds better products and faster go-to-market with Lean project man...
Genislab builds better products and faster go-to-market with Lean project man...Genislab builds better products and faster go-to-market with Lean project man...
Genislab builds better products and faster go-to-market with Lean project man...
 
Digital Tools & AI in Career Development
Digital Tools & AI in Career DevelopmentDigital Tools & AI in Career Development
Digital Tools & AI in Career Development
 
Varsha Sewlal- Cyber Attacks on Critical Critical Infrastructure
Varsha Sewlal- Cyber Attacks on Critical Critical InfrastructureVarsha Sewlal- Cyber Attacks on Critical Critical Infrastructure
Varsha Sewlal- Cyber Attacks on Critical Critical Infrastructure
 
Generative AI - Gitex v1Generative AI - Gitex v1.pptx
Generative AI - Gitex v1Generative AI - Gitex v1.pptxGenerative AI - Gitex v1Generative AI - Gitex v1.pptx
Generative AI - Gitex v1Generative AI - Gitex v1.pptx
 
How to Effectively Monitor SD-WAN and SASE Environments with ThousandEyes
How to Effectively Monitor SD-WAN and SASE Environments with ThousandEyesHow to Effectively Monitor SD-WAN and SASE Environments with ThousandEyes
How to Effectively Monitor SD-WAN and SASE Environments with ThousandEyes
 
Landscape Catalogue 2024 Australia-1.pdf
Landscape Catalogue 2024 Australia-1.pdfLandscape Catalogue 2024 Australia-1.pdf
Landscape Catalogue 2024 Australia-1.pdf
 
Transcript: New from BookNet Canada for 2024: BNC SalesData and LibraryData -...
Transcript: New from BookNet Canada for 2024: BNC SalesData and LibraryData -...Transcript: New from BookNet Canada for 2024: BNC SalesData and LibraryData -...
Transcript: New from BookNet Canada for 2024: BNC SalesData and LibraryData -...
 
Microservices, Docker deploy and Microservices source code in C#
Microservices, Docker deploy and Microservices source code in C#Microservices, Docker deploy and Microservices source code in C#
Microservices, Docker deploy and Microservices source code in C#
 
2024 April Patch Tuesday
2024 April Patch Tuesday2024 April Patch Tuesday
2024 April Patch Tuesday
 
Email Marketing Automation for Bonterra Impact Management (fka Social Solutio...
Email Marketing Automation for Bonterra Impact Management (fka Social Solutio...Email Marketing Automation for Bonterra Impact Management (fka Social Solutio...
Email Marketing Automation for Bonterra Impact Management (fka Social Solutio...
 
Accelerating Enterprise Software Engineering with Platformless
Accelerating Enterprise Software Engineering with PlatformlessAccelerating Enterprise Software Engineering with Platformless
Accelerating Enterprise Software Engineering with Platformless
 
Unleashing Real-time Insights with ClickHouse_ Navigating the Landscape in 20...
Unleashing Real-time Insights with ClickHouse_ Navigating the Landscape in 20...Unleashing Real-time Insights with ClickHouse_ Navigating the Landscape in 20...
Unleashing Real-time Insights with ClickHouse_ Navigating the Landscape in 20...
 
UiPath Community: Communication Mining from Zero to Hero
UiPath Community: Communication Mining from Zero to HeroUiPath Community: Communication Mining from Zero to Hero
UiPath Community: Communication Mining from Zero to Hero
 
Long journey of Ruby standard library at RubyConf AU 2024
Long journey of Ruby standard library at RubyConf AU 2024Long journey of Ruby standard library at RubyConf AU 2024
Long journey of Ruby standard library at RubyConf AU 2024
 
QCon London: Mastering long-running processes in modern architectures
QCon London: Mastering long-running processes in modern architecturesQCon London: Mastering long-running processes in modern architectures
QCon London: Mastering long-running processes in modern architectures
 
Bridging Between CAD & GIS: 6 Ways to Automate Your Data Integration
Bridging Between CAD & GIS:  6 Ways to Automate Your Data IntegrationBridging Between CAD & GIS:  6 Ways to Automate Your Data Integration
Bridging Between CAD & GIS: 6 Ways to Automate Your Data Integration
 
Kuma Meshes Part I - The basics - A tutorial
Kuma Meshes Part I - The basics - A tutorialKuma Meshes Part I - The basics - A tutorial
Kuma Meshes Part I - The basics - A tutorial
 
Microsoft 365 Copilot: How to boost your productivity with AI – Part two: Dat...
Microsoft 365 Copilot: How to boost your productivity with AI – Part two: Dat...Microsoft 365 Copilot: How to boost your productivity with AI – Part two: Dat...
Microsoft 365 Copilot: How to boost your productivity with AI – Part two: Dat...
 

Quality Assurance Guide with Definitions and Acronyms

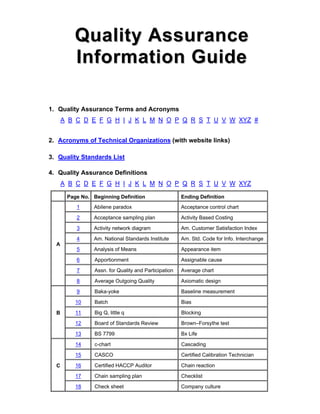
  • 1. QQuuaalliittyy AAssssuurraannccee IInnffoorrmmaattiioonn GGuuiiddee 1. Quality Assurance Terms and Acronyms A B C D E F G H I J K L M N O P Q R S T U V W XYZ # 2. Acronyms of Technical Organizations (with website links) 3. Quality Standards List 4. Quality Assurance Definitions A B C D E F G H I J K L M N O P Q R S T U V W XYZ Page No. Beginning Definition Ending Definition A 1 Abilene paradox Acceptance control chart 2 Acceptance sampling plan Activity Based Costing 3 Activity network diagram Am. Customer Satisfaction Index 4 Am. National Standards Institute Am. Std. Code for Info. Interchange 5 Analysis of Means Appearance item 6 Apportionment Assignable cause 7 Assn. for Quality and Participation Average chart 8 Average Outgoing Quality Axiomatic design B 9 Baka-yoke Baseline measurement 10 Batch Bias 11 Big Q, little q Blocking 12 Board of Standards Review Brown–Forsythe test 13 BS 7799 Bx Life C 14 c-chart Cascading 15 CASCO Certified Calibration Technician 16 Certified HACCP Auditor Chain reaction 17 Chain sampling plan Checklist 18 Check sheet Company culture
  • 2.   Page No. Beginning Definition Ending Definition C 19 Complaint tracking Conformity assessment 20 Confounding Consumer risk 21 Contingency table Control limits 22 Control plan Correlation 23 Cost of Poor Quality Cost of Quality 24 Count chart Critical Product Measurements 25 Cross functional Current Reality Tree 26 Customer Cycle Time D 27 Data Define, Measure, Analyze, Improve, Control 28 Define, Measure, Analyze, Design, Verify Deming prize 29 Deming's 14 points Dependent events 30 Deployment Design information checklist 31 Design of Experiment Design of Experiment 32 Design record Discrimination 33 Dissatisfiers Durability E 34 Effect Empowerment 35 EN 46000 Evaporating Cloud 36 Evolutionary Operation External Work F 37 F-tests Failure mode avoidance 38 Failure Mode and Effects Analysis First In, First Out 39 First Pass Yield Five S’s 40 Five whys Force field analysis 41 FSNP Future Reality Tree G 42 Gauge Repeatability and Reproducibility Genchi Genbutsu 43 Genjitsu Green Belt 44 Group dynamic Groupthink H 45 Hawthorne effect Histogram 46 Hooke's Law House of quality I 47 Imagineering Informative inspection 48 Indifference Quality Level Inspection, reduced 49 Inspection, tightened Internal work 50 Intra Class Correlation Inventory
  • 3. Page No. Beginning Definition Ending Definition I 51 Ishikawa Diagrams ISO/TS 16949 J 52 J.D. Power and Associates Just-In-Time Training K 53 Kaizen Key characteristics 54 Key Performance Indicators Kruskal-Wallis test L 55 Laboratory Lean manufacturing/production 56 Lean migration Listening post 57 Load-load Lower Control Limit M 58 Machine capability (Cmk) Manufacturing Resource Planning 59 Mapping symbols or icons Measurement 60 Measurement error Metrology 61 MIL-Q-9858A Moving range chart 62 Muda Myers-Briggs Type Indicator N 63 n Nonconformity 64 Non-Destructive Testing and Eval. Numerical Evaluation of Metrics O 65 Objective Operations 66 Original Equipment Manufacturer Ownership P 67 Packaging Part Submission Warrant 68 Paynter chart PICK chart 69 P.I.S.M.O.E.A error model Poka-yoke 70 Policy Probability 71 Probability density function Process analysis tools 72 Process average quality Process capability studies 73 Process capability studies (cont’d) Process kaizen 74 Process location Process potential index (Cp) 75 Process quality Production part app. submissions 76 Production smoothing Pull system Q 77 QEDS Standards Group Quality assurance/quality control 78 Quality assurance plan Quality Improvement 79 Quality Lever Quality management principle 80 Quality Management System Quality rate 81 Quality records Quincunx R 82 RABQSA International Random sampling 83 Rational subgroup Registrar 84 Registration Required waste 85 Requirements Risk management
  • 4. Page No. Beginning Definition Ending Definition R 86 Risk Priority Number Root Sum Squared Analysis 87 Run chart Runner S 88 SAE International Sampling, single 89 Sampling, unit s chart 90 Scorecard Severity 91 Shadow board Simultaneous engineering 92 Single-minute exchange of dies Special causes 93 Software quality assurance Stability 94 Stages of team growth Standard work 95 Standard work instructions Strategic planning 96 Stratification Supermarket 97 Supplier quality assurance Survey 98 Sustain System kaizen T 99 Taguchi methods Technical Report 100 Technical Specification Timing plan 101 TL 9000 Total Defects per Unit 102 Total productive maintenance Transition Tree 103 Tree diagram Type II errors U 104 u-chart Uptime V 105 Validation Value stream manager 106 Value Stream Map Virtual team 107 Vision Voluntary standard W 108 Waiver World-class quality XYZ 109 x Zero Defects 5. People in Quality Biographies 6. Addendums 7. Bibliography Definitions, Terms and Acronyms were taken from existing terminology standards with references. William L. Harbin Technical director BND TechSource – Kuching, Malaysia (last update 15MAR10) Bill Harbin Digitally signed by Bill Harbin DN: cn=Bill Harbin, o=BND TechSource, ou=BND TechSource, email=harbin_bill@yahoo.com, c=US Date: 2010.03.17 10:24:06 +08'00'
  • 5. Quality Acronyms – Page 1 (Return to Index) A2LA - American Association for Laboratory Accreditation (more) AAR - Appearance Approval Report (more) ABC - Activity Based Costing (more) ACSI - American Customer Satisfaction Index (more) AHP - Analytical Hierarchy Process (more) AIAG - Automotive Industry Action Group (more) AKC - Assembly Key Characteristics (more) ANOM - Analysis of Means (more) ANOVA - Analysis of Variance (more) ANSI - American National Standards Institute (more) ANSI-ASQ - American National Standards Institute-American Society for Quality (more) AOQ - Average Outgoing Quality (more) AOQL - Average Outgoing Quality Limit (more) APLAC - Asia Pacific Laboratory Accreditation Cooperation (more) APQP - Advanced Product Quality Planning (more) APQC - American Productivity & Quality Council AQIP - Academic Quality Improvement Project (more) AQL - Acceptable Quality Level or Average Quality Level (more) AQP - Assn. for Quality and Participation (more) ARL - Average Run Length (more) ASCII - American Standard Code for Information Interchange (more) ASN - Average Sample Number (more) ASNT - American Society for Nondestructive Testing (more) ASQ - American Society for Quality (more)
  • 6. Quality Acronyms – Page 2 (Return to Index) ASQC - American Society for Quality Control (more) ASTD - American Society for Training and Development (more) ASTM - American Society for Testing and Materials (more) ATI - Average Total Inspection (more)
  • 7. Quality Acronyms – Page 3 (Return to Index) BAT- Best Available Techniques BB - Black Belt (more) BCR - Blast Create Refine BIC (AP) - Best in Class (Action Plans) BIST - Built-In Self Test BKM - Best Known Methods BOK - Body of Knowledge (more) BOM - Bill Of Material (more) BPM - Business Process Management BPMS - Business Process Management System (more) BPO - Business Process Outsourcing BPR - Business Process Reengineering (more) BSR - Board of Standards Review (more); Buzz, Squeak, Rattle BTS - Build-To-Schedule Ratio (more)
  • 8. Quality Acronyms – Page 4 (Return to Index) CAB - Corrective Action Board; Competitive Analysis Benchmarking CAD - Computer Aided Design (more) CAE - Computer Aided Engineering (more) CAF - Common Assessment Framework CAM - Computer Aided Manufacturing (more) CAPA - Corrective And Preventive Action (more) CAPS - Computer-Assisted Problem Solving CAR - Corrective Action Report (Request, Recommendation) (more) CAIT - Computer-Aided Inspection and Testing CART - Classification and Regression Tree CAT - Complex Adaptive Thinking CBA - ASQ Certified Biomedical Auditor (more) CC - Critical Characteristic (more) C-chart - Count chart (more) CCT - ASQ Certified Calibration Technician (more) CE - Concurrent Engineering (more) CFT - Cross Functional Team CFA - Component Failure Analysis CFR - Constant Failure Rate CGMP - Current Good Manufacturing Practices (more) CHA - ASQ Certified HACCP Auditor (more) CHAID - Chi-square Automatic Interaction Detection (more) CI - Continuous Improvement (more) CIM - Computer Integrated Manufacturing CIP - Continuous Improvement Program CLCA - Closed-Loop Corrective Action (more) CLL - Cycle Line Layout (more) CMI - ASQ Certified Mechanical Inspector; superseded by CQI (more)
  • 9. Quality Acronyms – Page 5 (Return to Index) Cmk - Machine capability (more) CMM - Capability Maturity Model (more); Coordinate Measuring Machine (more) CMQ/OE - ASQ Certified Manager of Quality/Organizational Excellence (more) CMS - Coordinate Measuring System CMVSS - Canadian Motor Vehicle Safety Standards (per Transport Canada) COB - Close Of Business COP - Conformity of Production; Customer Ordered Production COPQ - Cost of Poor Quality (more) COQ - Cost of Quality (more) CoV - Coefficient of Variance Cp - Process potential index (more) CPIM - Certified in Production and Inventory Management CPIP - Current Product Improvement Team Cpk - Process capability index (more) CPM - Critical Path Method CQA - ASQ Certified Quality Auditor (more) CQE - ASQ Certified Quality Engineer (more) CQI - ASQ Certified Quality Inspector (more); Continuous Quality Improvement (more) CQIA - ASQ Certified Quality Improvement Associate (more) CQM - ASQ Certified Quality Manager; superseded by CMQ/OE (more) CQP - Critical Quality Problem CQPA - ASQ Certified Quality Process Analyst (more) CQT - ASQ Certified Quality Technician (more) CRD - Conflict Resolution Diagram (more) CRE - ASQ Certified Reliability Engineer (more) CRM - Customer Relationship Management (more) CRT - Current Reality Tree (more)
  • 10. Quality Acronyms – Page 6 (Return to Index) CSF - Critical Success Factors CSI – Customer Satisfaction Index (more) CSM - Customer-Supplier Model (more) C-Sketch - Collaborative Sketch (more) CSP - Continuous Sampling Plan CSQE - Certified Software Quality Engineer (more) CSSBB - ASQ Certified Six Sigma Black Belt (more) CSSGB - ASQ Certified Six Sigma Green Belt (more) CSU - Consistent Standard Units C/T – Cycle Time (more) CTC - Critical to Cost, Concept to Customer CTD - Critical to Delivery CTP - Critical to Process CTQ - Critical to Quality (more) CTQC - Critical to Quality Characteristic CTS - Critical to Satisfaction CUSUM - Cumulative Sum (more) CWQC - Company Wide Quality Control CWQI - Company Wide Quality Improvement CY - Calendar Year
  • 11. Quality Acronyms – Page 7 (Return to Index) D-chart – Demerit chart (more) DCOV - Define Characterize Optimize Verify (failure mode avoidance process) DCP - Dimensional Control Plan / Dynamic Control Plan DCT - Defect Control Tool DD - Defect Density DDMS - Defect Data Management System DFA - Design For Assembly DFC - Datum Flow Chain DFE - Design For Excellence DFMA - Design For Manufacturing and Assembly (more) DFMEA - Design Failure Mode Effects Analysis (more) DFMC - Design for Mass Customization DFSS - Design For Six Sigma (more) DFR - Design For Reliability DIF-DOF - Design In Function - Design Out Failure DM - Defect Management DMADV - Design Measure Analyze Design Verify (more) DMAIC (R) -Define, Measure, Analyze, Implement and Control (Realize) (more) DMEDI - Define, Measure, Explore, Develop, Implement DMR - Discrepant Material Report (SCAR) DOE - Design Of Experiments (more) DOPU - Defect Opportunities Per Unit DP - Dual Phase DPMO - Defects Per Million Opportunities DPO - Defects Per Opportunity DPR - Design Pre-Requisites DPU - Defects Per Unit DQR - Durability Quality Reliability
  • 12. Quality Acronyms – Page 8 (Return to Index) DRC - Design Rule Check DTD - Dock to Dock (more) DTR - Dimensional Test Report DVER - Design rule Verification (more) DVP&R - Design Verification Plan & Report (more)
  • 13. Quality Acronyms – Page 9 (Return to Index) E3 - Early Equipment Evaluation EA - European Cooperation for Accreditation (more) EAR - Engineering Action Request EAU - Estimated Annual Usage ECA - Engineering Capability Assessment ECN - Engineering Change Notification ECO - Engineering Change Order ECR - Engineering Change Request EDA - Exploratory Data Analysis EDI - Electric Data Interchange (more) EFR - Early Failure Rate (also ELF, IMF) EI - Employee Involvement (more) EIP - Equipment Improvement Program; Equipment Improvement Project ELF - Early Life Failure (also EFR, IMF) EWMA - Exponentially Weighted Moving Average EPLS - Economic Production Lot Size EPM - Equipment Performance Metrics EQA - European Quality Award ES - Engineering Specification ESC - Early Stage Control ESS - Environmental Stress Screening ETQR - External Total Quality and Reliability EVM - Earned Value Management EVOP - Evolutionary Operation (more) EWMA - Exponentially Weighted Moving Average
  • 14. Quality Acronyms – Page 10 (Return to Index) FA - Failure Analysis FAA - Function Attribute Analysis FACR - Findings, Analysis, Conclusions and Recommendations FAIT - First Article Inspection and Test FDC - Fault Detection and Classification FEA - Finite Element Analysis FEED – Front End Engineering and Design FIFO - First In, First Out (more) FIRTFT - Fix It Right The First Time FLD - Forming Limit Diagram FMA - Failure Mode Analysis (more) FMEA - Failure Mode and Effects Analysis (more) FMECA - Failure Mode Effects and Criticality Analysis (more) FMEM - Failure Mode and Effects Management FMS - Forms Management System; Facility Management System FMVSS - Federal Motor Vehicle Safety Standards (per NHTSA) FORM - First Order Reliability Method FPY - First Pass Yield (more) FRACAS - Failure Reporting Analysis, Corrective Action System FRC - First Run Capability (more) FRT - Future Reality Tree (more) FSNP - Forming Storming Norming Performing (in team problem solving efforts) (more) FTA - Fault Tree Analysis (more) FTC - First Time Capability FTQ - First Time Quality (more) FTT - First Time Through (more)
  • 15. Quality Acronyms – Page 11 (Return to Index) GB - Green Belt (more) GLP - Good Laboratory Practice GCA - Global Customer Audit GD&T – Geometric Dimensioning and Tolerancing (more) GLP - Good Laboratory Practices (more) GMP - Good Manufacturing Practices (more) GR&R - Gauge Repeatability & Reproducibility (more)
  • 16. Quality Acronyms – Page 12 (Return to Index) HACCP - Hazard Analysis and Critical Control Point (more) HALT - Highly Accelerated Life Test (more) HASA - Highly Accelerated Stress Audits (more) HASS - Highly Accelerated Stress Screening (more) HPEM - Harr's Point Estimation Method HRA - Human Reliability Analysis HSE – Health, Safety, Environmental
  • 17. Quality Acronyms – Page 13 (Return to Index) IAAC - Inter-American Accreditation Cooperation (more) IAR - International Accreditation Registry (more) IATF - International Automotive Task Force (more) ICC – Intra Class Correlation (more) ICIS - In Control and In Specification IDEA - Investigate, Design, Execute, Adjust IDOV - Identify, Design, Optimize, Verify ILAC - International Laboratory Accreditation Cooperation (more) IMF - Infant Mortality Failure (also EFR, ELF) I/MR - Individual/Moving Range (chart) (more) IPE - Interpret, Plan, Execute (a problem-solving methodology) IPO – Input(s), Process, Output(s) IQ - Installation Qualification IQL - Indifference Quality Level (more) ISIR - Initial Sample Inspection Report (now PSW) ISR - Initial Sample Report (now PSW) ISW - Initial Sample Warrant (now PSW)
  • 18. Quality Acronyms – Page 14 (Return to Index) JIT - Just in Time (more) JITT - Just in Time Training (more)
  • 19. Quality Acronyms – Page 15 (Return to Index) KCC - Key Control Characteristic KLT - Key Life Test KPA - Key Process Area KPC - Key Process (Product) Characteristic (more) KPI - Key Process (Product) Indicator (more) KPIV - Key Process Improvement Variable (more) KPOV - Key Process Output Variables (more) KQI - Key Quality Indicator
  • 20. Quality Acronyms – Page 16 (Return to Index) LAR - Lot Age Report LCA – Life Cycle Analysis, Life Cycle Assessment LCC - Life Cycle Cost LCL - Lower Control Limit (more) LDA - Linear Discriminant Analysis LFMEA - Logistics Failure Modes and Effects Analysis LHS - Latin Hypercube Simulation LOC - Level of Concern LSL - Lower Specification Limit (more) LTPD - Lot Tolerance Percentage Defective (more) LUTI - Learn Use Train Inspect
  • 21. Quality Acronyms – Page 17 (Return to Index) MANOVA - Multi-variant Analysis of Variances MAP - Manufacturing Automation Protocol MBB - Master Black Belt (more) M &TE - Measuring & Test Equipment MBNQA - Malcolm Baldrige National Quality Award (more) MBTI - Myers-Briggs Type Indicator (more) MCS - Monte Carlo Simulation (more) MCT - Machine Cycle Time MDO - Multidisciplinary Design Optimization MDR - Material Discrepancy Report (SCAR) MDT - Module Development Team MEOST - Multiple Environment Over Stress Test MEPEM - Materials Equipment People Environment Methods MKC - Manufacturing Key Characteristics (more) MRA - Mutual Recognition Agreement (more) MRP - Material Requirements Planning (more) MRP II - Manufacturing Resource Planning (more) MSA - Measurement System Analysis (more) MSE - Mean Squared Error; Measurement System Evaluation (more) MSDS - Material Safety Data Sheet MTBF - Mean Time Between Failures (more) MTQ - Motivation Teamwork Quality MTR - Material Test Report MTTA - Mean Time To Assist MTTC - Mean Time To Correct MTTCR - Mean Time To Correct and Recover MTTF - Mean Time To Failure MTTR - Mean Time To Repair
  • 22. Quality Acronyms – Page 18 (Return to Index) NBR - Negative Branch Reservations NCR - Non-Conformance Report NDE - Non-Destructive Evaluation (more) NDT - Non-Destructive Testing (more) NEM - Numerical Evaluation of Metrics (more) NFF - No Fault Found NGT - Nominal Group Technique (more) NIST - National Institute of Standards and Technology (more) NMR - Non-conformance Material Report NP chart - Number of affected units chart (more)
  • 23. Quality Acronyms – Page 19 (Return to Index) OCLP - Ongoing Process Control Plan OC - Operating Characteristic curve (more) OCT - Operator Cycle Time OEE - Overall Equipment Effectiveness (more) OEM - Original Equipment Manufacturer (more) OFAT - One Factor At a Time OIC - Observe, Infiltrate, Collaborate (ways to grasp the situation) OPT - Optimized Production Technology OQ - Operational Qualification OTED - One Touch Exchange of Dies (more) OVAT - One Variable At a Time
  • 24. Quality Acronyms – Page 20 (Return to Index) PAPA - Part and Process Audit PCA - Principal Component Analysis P-chart - Percent chart (more) PCP - Part Certification Process PCPA - Process Control Plan Audit PCR - Principle Component Regression PDCA (E. Deming) or PDSA (W. Shewhart) - Plan Do Check (Study) Act (more) PDF - Probability Density Function PDLA - Plant Design Layout & Analysis PDP - Product Development Planning PDPC - Process Decision Program Chart PDQ - Proactive Design for Quality PDM – Product Data Management PERT - Program Evaluation and Review Technique PFA - Product Family Architecture PFMEA - Process Failure Mode Effects Analysis (more) PICK - Possible, Implement, Challenge and Kill (more) PIP - Product Improvement Plan (more) P.I.S.M.O.E.A - Part, Instrument, Standard, Method, Operator, Environment, & Assumptions (more) PIST - Percent of Inspection points Satisfying Tolerance (more) PKC - Product Key Characteristics (more) PLEX - Plant Experiments PLM - Product Lifecycle Management PM - Preventive Maintenance PMAP - Process Map (more)
  • 25. Quality Acronyms – Page 21 (Return to Index) PMT - Program Management Team P/N - Part Number PO - Purchase Order POM - Production & Operations Management PONC - Price of Non-Conformance PPAP - Production Parts Approval Process (more) PPC - Pre-Product Clinic Ppk - Process performance index (more) PPM - Parts Per Million - defects per one million parts (more) PQ - Performance Qualification PQP - Purchasing Quality Procedure PRA - Probabilistic Risk Assessment PRT - Pre-requisite Tree (more) PSW - Product Sample Warrant (more) PTR - Performance Test Report; Product Technical Requirements PTQ - Partnering for Total Quality PVP&R - Process Validation Plan & Report
  • 26. Quality Acronyms – Page 22 (Return to Index) QA - Quality Assurance (more) QADF - Quality Assurance Document File QC - Quality Control (more) QCD - Quality Cost Delivery Q chart - Quality score chart (more) QCIR - Quality Control Inspection Record QFD - Quality Function Deployment (more) QFS - Qualified for Sourcing QITD - Quality is In The Detail QIS - Quality Information System QM - Quality Management (more) QMS - Quality Management System (more) QOO - Quality of Operations QOS - Quality Operating System QP - Quality Procedure QPR - Quality Problem Report QS-9000 - Quality System 9000 (superseded by ISO/TS 16949:2002) QSA - Quality System Assessment (or Audit) QSER - Questioning, Solving, Experimenting, Reflecting QSIT - Quality System Inspection Technique (US Food & Drug Administration) QSR - Quality System Requirements QTAT - Quick Turn Around Time QWL - Quality of Working Life
  • 27. Quality Acronyms – Page 23 (Return to Index) RAM - Reliability, Availability, and Maintainability R Chart – Range Chart (more) RCA - Request for Corrective Action; Root Cause Analysis (more) RBDO - Reliability Based Design Optimization RFP - Request For Proposal RFQ - Request For Quotation RIMCY - Residuals, Interactions, Main, Cube, Y = c + mx (response optimization) RMSEP - Root Mean Square Error of Prediction ROCOF - Rate of Change of Failure RPEM - Rosenblueth's Point Estimation Method RPM - Recurrence Prevention Meeting RPN - Risk Priority Number (ref: FMEA) (more) RSM - Response Surface Method RSS - Root Sum Square (more) RSS Analysis - Root Sum Square Analysis (more) RTY - Rolled Throughput Yield (more) R&M - Reliability & Maintainability
  • 28. Quality Acronyms – Page 24 (Return to Index) SARA - Scan, Analyze, Respond, Assess SC - Significant Characteristic SCAMPER - Substitute, Combine, Adapt, Modify, Put (to other uses), Eliminate, Reverse (more) SCAR - Supplier Corrective Action Report SCOR - Supply Chain Operations Reference (more) SCORE - Supplier Cost Reduction Effort (Chrysler) SCP - Systematic Creativity Process SDE - Supplier Development Engineer SDS - System Design Specification SDWT - Self Directed Work Teams (more) SET - Simultaneous Engineering Team SFDC - Shop Floor Data Collection SFMEA - System Failure Mode and Effects Analysis SIC - Standard Industrial Classification SIPOC - Suppliers-Inputs-Process-Outputs-Customers (process thinking-helps with deriving the process map) (more) SIT - Structured Inventive Thinking SMART - Specific Measurable Achievable Relevant Time Bound SMED - Single Minute Exchange of Dies (more) S/N - Signal to Noise ratio (more) SNN - Supplier Non-conformance Notice SNR - Signal to Noise Ratio SOFM - Self Organizing Feature Map
  • 29. Quality Acronyms – Page 17 (Return to Index) SOP - Standard Operating Procedure (more); Start of Production SORM - Second Order Reliability Method SOW - Statement of Work SP - System Procedure SPC - Statistical Process Control (more) SPIT - Single Point in Time SPS - Statistical Problem Solving SPSM - Structured Problem Solving Methodologies SQA - Software Quality Assurance (more); Supplier Quality Assistance (more) SQC - Statistical Quality Control (more) SQE - Supplier Quality Engineering SQTF - Supplier Quality Task Force SSDD - Six Sigma for Design and Development SSI - Sales Satisfaction Index (JD Power) STAC - Statistical Test Acceptance Criteria STAP - Short-Term Action Program STCA - Space and Time Characteristics Analysis STEP - Standard for the Exchange of Product Model Data SWIMTOO - Scrap-rework, Waiting, Inventory, Motion, Transportation, Over-processing, Over-production (See 7 wastes) SWOT - Strengths, Weaknesses, Opportunities, Threats (more)
  • 30. Quality Acronyms – Page 25 (Return to Index) T&E - Tooling & Equipment TBD - To Be Determined TDU - Total Defects per Unit (more) TGR – Things Gone Right TGW – Things Gone Wrong TRIZ - Theory of Inventive Problem Solving; (Teoriya Resheniya Izobreatatelskikh Zadatch) (more) TMAP or TMP - Thought Process Map (more) TOC - Theory of Constraints (more) TOPS - Team Oriented Problem Solving TPM - Total Productive Maintenance (more) TPS - Toyota Production System (more) TQC - Total Quality Control (more) TQM - Total Quality Management (more) TR - Technical Report (more) TRT - Transition Tree (more) TS - Technical Specification (more)
  • 31. Quality Acronyms – Page 26 (Return to Index) UCL - Upper Control Limit (more) UDE - Undesired Effects USL - Upper Specification Limit (more) V4L - Variety, Velocity, Variability, Visibility & Learning VA / VE - Value Analysis / Value Engineering (more) VLQ - Vehicle Line Quality VOC - Voice of the Customer (more) VOP - Voice of Process (more) VPDQ - Vehicle Product Data Quality VRT - Variability Reduction Team VSA – Variation Simulation Analysis (i.e. Vis VSA) VSM - Value Stream Mapping (more) WFM - Work Flow Measurement (Management) WI - Work Instructions WIIFM - What's in it for me WYSIWYG – What you see is what you get YTD - Year To Date
  • 32. Quality Acronyms – Page 19 (Return to Index) 3D’s – Dirty, Dangerous, and Demeaning. 3 K’s - kiken (dangerous), kitanai (dirty), kitsui (stressful) - Japanese words referring to hazards of the conventional work place. 3 M’s - muda (waste), mura (irregular, uneven or inconsistent), muri (unreasonable or excessive strain). 3 R’s - The three fundamental steps of recording, recalling and reconstructing which most innovators go through when generating new product ideas. 4 S’s - Arrangement, Organization, Cleanliness, Act of cleaning 5 P’s - Plant, Product, People, Policies, Procedures (can be used in a for fishbone) 5 S’s - Sort, Simplify, Sanitize, Standardize, Sustain (more) Ordered actions used to achieve a clean, well-organized workplace. 5W2H - Who, What, When, Where, Why & How and How Many (root cause analysis) 6 M’s - Man, Method, Material, Measurement, Mother Nature, Machine Categories representing the sources of variation. 7 P’s - Proper Prior Planning Prevents Pitifully Poor Performance 8 Wastes – Defects (Scrap-rework), Waiting, Inventory/Storage, Unnecessary Movement (Motion), Transportation, Over-Processing, Over-Production, Under- Utilization (of employees’ skills) (more) 8D - Eight Discipline Problem Solving Method and Report
  • 33. Acronyms of Technical Organizations – Page 1 (Return to Index) AALA or A2LA - American Association for Laboratory Accreditation (http://www.a2la.org/) AIAG - Automotive Industry Action Group (http://www.aiag.org/) ANSI - American National Standards Institute (http://www.ansi.org/) ASQ - American Society for Quality (http://www.asq.org/) ASTM - American Society for Testing and Materials (http://www.astm.org/) CSA - Canadian Standards Association (http://www.csa.ca/cm/ca/en/home) DIN - Deutsches Institut für Normung e.V. (DIN; in English, the German Institute for Standardization) (http://www.din.de/cmd?level=tpl-home&languageid=en) EFQM - European Foundation for Quality Management (http://ww1.efqm.org/en/) IAOB - International Automotive Oversight Bureau (http://www.iaob.org/) IAQG - International Aerospace Quality Group (http://www.iaqg.sae.org/iaqg/) IATF - International Automotive Task Force (http://www.iatfglobaloversight.org/) ISO - International Standards Organization (http://www.iso.org/) NHTSA - National Highway Traffic Safety Administration (http://www.nhtsa.dot.gov/) SAE – Society of Automotive Engineers (http://www.sae.org/) SCC - Standards Council of Canada (http://www.scc.ca/en/) SME – Society of Manufacturing Engineers (http://www.sme.org/) TC - Transport Canada (http://www.tc.gc.ca/eng/acts-regulations/regulations-crc- c1038.htm) TÜV - Technischer Überwachungs-Verein, (Technical Inspection Association in English) (http://www.tuv.com/global/en/index.html) UNECE - United Nations Economic Commission for Europe - Translation of UNECE regulations in the area of vehicle approval (http://ec.europa.eu/enterprise/sectors/automotive/documents/unece/table/index_en.htm )
  • 34. Quality Standards List – Page 1 (Return to Index) AS9100 - Quality Management System Requirements for Design and/or Manufacture of Aerospace Products AS9110 - Quality Management System Requirements for Maintenance Organizations AS9120 - Quality Management System Requirements for Stock list Distributors AS9003 - Inspection & Testing (USA only) AS9006 - Aerospace Deliverable Software Supplement to AS9100 standards (USA only) ISO-9000 (series of standards) - Quality standard for evaluating Quality Management Systems (QMS) ISO-14001 - Standard that sets out how you can go about putting in place an effective Environmental Management System (EMS) ISO/IEC 27001 - Formally specifies a management system that is intended to bring information security under explicit management control ISO/TS 16949 - An ISO technical specification which aligns existing US, German, French and Italian automotive quality system standards within the global automotive industry
  • 35. Quality Definitions – Page 1 (Return to Index) Abilene paradox A paradox in which a group of people collectively decide on a course of action that is counter to the preferences of any of the individuals in the group. It involves a common breakdown of group communication in which each member mistakenly believes that their own preferences are counter to the group's, and therefore, does not raise objections. A common phrase relating to the Abilene paradox is "rocking the boat". Academic Quality Improvement Project (AQIP) A forum for higher education institutions to review one another’s action projects. Accelerated test Test in which the applied stress level is chosen to exceed that stated in the reference conditions in order to shorten the time required to observe the stress response of the item, or to magnify the response in a given duration. To be valid, an accelerated test must not alter the basic modes and/or mechanisms of failure. Acceptance quality limit In a continuing series of lots, a quality level that, for the purpose of sampling inspection, is the limit of a satisfactory process average. Acceptance criteria Specification criteria for acceptance of individual product or service characteristics. Sometimes, as in acceptance sampling, the term "acceptance criteria" is used for a set of several characteristics rather than an individual characteristic. Acceptance inspection Inspection to determine whether an item or lot delivered or offered for delivery is acceptable. Acceptance number The maximum number of defects or defectives allowable in a sampling lot for the lot to be acceptable. Acceptance sampling Sampling inspection in which decisions are made to accept or not to accept a lot (or other grouping of product, material, or service) based on the results of a sample or samples selected from that lot. Acceptance control chart A graphical method for the dual purposes of evaluating a process in terms of: (a) whether or not it can be expected to satisfy product or service requirements for the characteristic(s) being measured, and (b) whether or not it is in a "state of statistical control" with respect to within-sample or sub-group variability. Also see “Acceptance Control Chart Example”.
  • 36. Quality Definitions – Page 2 (Return to Index) Acceptance sampling plan A specific plan that indicates the sampling sizes and associated acceptance or nonacceptance criteria to be used. Accreditation Certification by a recognized body of the facilities, capability, objectivity, competence and integrity of an agency, service or operational group or individual to provide the specific service or operation needed. Accreditation body An organization with authority to accredit other organizations to perform services such as quality system certification. Accredited registrars Accredited Registrars are qualified organizations certified by a national body to perform audits to the QS9000 standard and to register the audited facility as meeting these requirements for a given commodity. Acceptable Quality Level (AQL) AQL is limit of a satisfactory process average at a particular quality level when a continuing series of lots is considered. Also called “average quality level”. Accuracy The closeness of agreement between an observed value and an accepted reference value. Also see “precision”. ACLASS Accreditation Services An ANSI-ASQ National Accreditation Board company that provides accreditation services for: testing and calibration laboratories in accordance with ISO/IEC 17025; reference material producers in accordance with ISO Guide 34; and inspection bodies in accordance with ISO/IEC 17020. Activity Based Costing (ABC) A system for making business decisions based on cost information of fundamental business activities as tasks related to product design, development, quality, manufacturing, distribution, customer acquisition, service and support. ABC is sometimes considered a form of business process re-engineering as it insists on surfacing a manageable number of cost drivers that can be used to trace variable business costs to customer, products and processes.
  • 37. Quality Definitions – Page 3 (Return to Index) Activity network diagram An arrow diagram used in planning. Also see “Activity Network Diagram Example”. Advanced Product Quality Planning (APQP) A structured method of defining the steps necessary to ensure that a product satisfies the customer. In the automotive industry, APQP is a systematic product introduction process that aims to facilitate supply chain communication and ensure quality throughout the vehicle development process. It is used during the design and development of new vehicles and component systems to reduce the risk of unexpected failure due to errors in design and manufacture. This is a structured method of defining and establishing the steps necessary to assure that a product satisfies the customer. Also see “PPAP”. Adverse event Healthcare term for any event that is not consistent with the desired, normal or usual operation of the organization; also known as a sentinel event. Affinity diagram A way to organize facts, opinions, ideas and issues into natural groupings as an aid to diagnosis on a complex problem. A large number of ideas are generated and then organized into groupings to reveal major themes. Agile manufacturing Tools, techniques, and initiatives that enable a plant or company to thrive under conditions of unpredictable change. Agile manufacturing not only enables a plant to achieve rapid response to customer needs, but also includes the ability to quickly reconfigure operations and strategic alliances to respond rapidly to unforeseen shifts in the marketplace. Alignment Actions to ensure that a process or activity supports the organization’s strategy, goals and objectives. American Association for Laboratory Accreditation (A2LA) An organization that formally recognizes another organization’s competency to perform specific tests, types of tests or calibrations. American Customer Satisfaction Index (ACSI) Released for the first time in October 1994, an economic indicator and cross industry measure of the satisfaction of U.S. household customers with the quality of the goods and services available to them. This includes goods and services produced in the United States and imports from foreign firms that have substantial market shares or dollar sales. ASQ is a founding sponsor of the ACSI, along with the University of Michigan Business School and the CFI Group.
  • 38. Quality Definitions – Page 4 (Return to Index) American National Standards Institute (ANSI) A private, nonprofit organization that administers and coordinates the U.S. voluntary standardization and conformity assessment system. It is the U.S. member body in the International Organization for Standardization, known as ISO. American National Standards Institute-American Society for Quality (ANSI-ASQ) Organization that accredits certification bodies for ISO 9001 quality management systems, ISO 14001 environmental management systems and other industry specific requirements. American Society for Nondestructive Testing (ASNT) A technical society for non-destructive testing (NDT) professionals. American Society for Quality (ASQ) A professional, non-profit association that develops, promotes and applies quality related information and technology for the private sector, government and academia. ASQ serves more than 108,000 individuals and 1,100 corporate members in the United States and 108 other countries. American Society for Quality Control (ASQC) Name of ASQ from 1946 through the middle of 1997, when the name was changed to ASQ. American Society for Testing and Materials (ASTM) Non-profit organization that provides a forum for the development and publication of voluntary consensus standards for materials, products, systems and services. American Society for Testing and Materials (ASTM) International International non-profit organization that provides a forum for the development and publication of voluntary consensus standards for materials, products, systems and services. American Society for Training and Development (ASTD) A membership organization providing materials, education and support related to workplace learning and performance. American Standard Code for Information Interchange (ASCII) Basic computer characters accepted by all American machines and many foreign ones.
  • 39. Quality Definitions – Page 5 (Return to Index) Analysis of Means (ANOM) A statistical procedure for troubleshooting industrial processes and analyzing the results of experimental designs with factors at fixed levels. It provides a graphical display of data. Ellis R. Ott developed the procedure in 1967 because he observed that nonstatisticians had difficulty understanding analysis of variance. Analysis of means is easier for quality practitioners to use because it is an extension of the control chart. In 1973, Edward G. Schilling further extended the concept, enabling analysis of means to be used with non-normal distributions and attributes data in which the normal approximation to the binomial distribution does not apply. This is referred to as analysis of means for treatment effects. Also see “Analysis of Means (ANOM) Chart Example”. Analysis of Variance (ANOVA) A basic statistical technique for determining the proportion of influence a factor or set of factors has on total variation. It subdivides the total variation of a data set into meaningful component parts associated with specific sources of variation to test a hypothesis on the parameters of the model or to estimate variance components. There are three models: fixed, random and mixed. Analytical Hierarchy Process (AHP) Developed by Thomas Saaty, AHP provides a proven, effective means to deal with complex decision making and can assist with identifying and weighting selection criteria, analyzing the data collected for the criteria and expediting the decision-making process. Andon board A production area visual control device, such as a lighted overhead display. It communicates the status of the production system and alerts team members to emerging problems (from andon, a Japanese word meaning “light”). It is one of the main tools of Jidohka. An example of visual management or visual control. ANOVA Gauge Repeatability & Reproducibility Is a Measurement Systems Analysis technique which uses Analysis of Variance (ANOVA) random effects model to assess a measurement system. Also see “gauge R&R”. ANSI ACS X12 Transaction standards for electronic communication and shipping notification. Appearance Approval Report (AAR) A standard report form, to communicate information on product / part appearance. Appearance item A product that is visible once the vehicle is complete. Certain customers will identify appearance items on the engineering drawings. In these cases, special approval for appearance (color, grain, texture, etc.) is required prior to production part submissions.
  • 40. Quality Definitions – Page 6 (Return to Index) Apportionment Synonymous with the term Reliability Apportionment, which is the assignment of reliability goals from system to subsystem in such a way that the whole system will have the required reliability. Appraisal cost The cost of ensuring an organization is continually striving to conform to customers’ quality requirements. Approved drawing Is an engineering drawing signed by the engineer and released through the customer's system. Approved material Approved Materials are materials governed either by industry standard specifications (e.g., SAE, ASTM, DIN, ISO, etc.) or by customer specifications. Arrow diagram A planning tool to diagram a sequence of events or activities (nodes) and their interconnectivity. It is used for scheduling and especially for determining the critical path through nodes. Also see “ Arrow Diagram Example”. AS9100 An international quality management standard for the aerospace industry published by the Society of Automotive Engineers and other organizations worldwide. It is known as EN9100 in Europe and JIS Q 9100 in Japan. The standard is controlled by the International Aerospace Quality Group. Also see “JIS Q 9100”. Asia Pacific Laboratory Accreditation Cooperation (APLAC) A cooperative of laboratory accreditation bodies. Assessment A systematic evaluation procedure of collecting and analyzing data to determine the current, historical or projected compliance of an organization to a standard. This process includes a document review, an on-site audit, and an analysis and report. Customers may also include a self-assessment, internal audit results and other materials in the assessment. Assignable cause A name for the source of variation in a process that is not due to chance and therefore can be identified and eliminated. Also called “special cause”.
  • 41. Quality Definitions – Page 7 (Return to Index) Assn. for Quality and Participation (AQP) It was an independent organization until 2004, when it became an affiliate organization of ASQ. Continues today as ASQ’s Team and Workplace Excellence Forum. Attribute The property a unit has of being either bad or good. That is, the quality characteristic of a unit is either within the specified requirements or it is not. Attribute data Attributes data are qualitative data that can be counted for recording and analysis. Examples include the presence or absence of a required label, the installation of all required fasteners. Attributes data are not acceptable for production part submissions unless variables data cannot be obtained. The control charts based on attribute data are percent chart, number of affected units chart, count chart, count-per-unit chart, quality score chart, and demerit chart. Audit The on-site verification activity, such as inspection or examination, of a process or quality system, to ensure compliance to requirements. An audit can apply to an entire organization or might be specific to a function, process or production step. Automotive Industry Action Group (AIAG) A global automotive trade association with about 1,600 member companies that focuses on common business procedures, implementation guidelines, education and training. Autonomation A form of automation in which machinery automatically inspects each item after producing it and ceases production and notifies humans if a defect is detected. Toyota expanded the meaning of jidohka to include the responsibility of all workers to function similarly—to check every item produced and, if a defect is detected, make no more until the cause of the defect has been identified and corrected. Also see “jidohka”. Availability The ability of a product to be in a state to perform its designated function under stated conditions at a given time. Average amount of inspection In a given sampling scheme, the number of items expected to be inspected per lot in order to reach a decision for a certain average batch quality level. Average chart A control chart in which the subgroup average, X-bar, is used to evaluate the stability of the process level. Also see “Control Chart Examples”.
  • 42. Quality Definitions – Page 8 (Return to Index) Average Outgoing Quality (AOQ) The expected average quality level of outgoing product for a given value of incoming product quality. Average Outgoing Quality Limit (AOQL) The maximum average outgoing quality over all possible levels of incoming quality for a given acceptance sampling plan and disposal specification. Average Run Lengths (ARL) On a control chart, the number of subgroups expected to be inspected before a shift in magnitude takes place. Average Sample Number (ASN) The average number of sample units inspected per lot when reaching decisions to accept or reject. Average Total Inspection (ATI) The average number of units inspected per lot, including all units in rejected lots (applicable when the procedure calls for 100% inspection of rejected lots). A3 report The A3 report is a tool used for problem solving in the course of work. The name "A3" describes the size of paper on which the report is written. The steps of the report include identifying a problem, understanding the current condition, determining the root cause, developing a target condition, implementation plan, and follow-up plan. These steps are all written and drawn (not typed) out on a single piece of A3 paper. Axiomatic design A systems design methodology using matrix methods to systematically analyze the transformation of customer needs into functional requirements, design parameters, and process variables.
  • 43. Quality Definitions – Page 9 (Return to Index) Baka-yoke A Japanese term for a manufacturing technique for preventing mistakes by designing the manufacturing process, equipment and tools so an operation literally cannot be performed incorrectly. In addition to preventing incorrect operation, the technique usually provides a warning signal of some sort for incorrect performance. Also see “poka-yoke”. Balanced array In an experiment the array of factors and levels must be balanced. To satisfy this there must be: 1. Equal numbers of levels in each column. 2. The Sum Product of each pair of columns equals zero (taking levels as '+' and '-'). Balanced plant A plant in which the capacity of all resources is balanced exactly with market demand. Balanced scorecard A framework which translates a company's vision and strategy into a coherent set of performance measures. A balanced business scorecard helps businesses evaluate how well they meet their strategic objectives. It typically has four to six components, each with a series of sub-measures. Each component highlights one aspect of the business. The balanced scorecard includes measures of performance that are lagging (return on capital, profit), medium-term indicators (like customer satisfaction indices) and leading indicators (such as adoption rates for, or revenue from, new products). Balancing the line The process of evenly distributing both the quantity and variety of work across available work time, avoiding overburden and underuse of resources. This eliminates bottlenecks and downtime, which translates into shorter flow time. Baldrige award See “Malcolm Baldrige National Quality Award”. Bartlett test A form of F-test for more than 2 samples of data. Used for showing equal variances for normal data. Bartlett's test is sensitive to departures from normality. That is, if your samples come from non-normal distributions, then Bartlett's test may simply be testing for non-normality. The Levene test and Brown-Forsythe test are alternatives to the Bartlett test that are less sensitive to departures from normality. Baseline measurement The beginning point, based on an evaluation of output over a period of time, used to determine the process parameters prior to any improvement effort; the basis against which change is measured.
  • 44. Quality Definitions – Page 10 (Return to Index) Batch A definite quantity of some product or material produced under conditions that are considered uniform. Batch and queue Producing more than one piece and then moving the pieces to the next operation before they are needed. Bathtub curve The sum of all reliability failures over time. Consists of the effects of early life failures, useful life failures and wear out failures. Bayes’ theorem A formula to calculate conditional probabilities by relating the conditional and marginal probability distributions of random variables. Bayesian inference A numerical estimate of the degree of belief in a hypothesis before and after evidence has been observed. Benchmarking A technique in which a company measures its performance against that of best in class companies, determines how those companies achieved their performance levels and uses the information to improve its own performance. Subjects that can be benchmarked include strategies, operations and processes. Benchmark data The results of an investigation to determine how competitors and/or best-in-class companies achieve their level of performance. Benefit-cost analysis An examination of the relationship between the monetary cost of implementing an improvement and the monetary value of the benefits achieved by the improvement, both within the same time period. Best practices A superior method or innovative practice that contributes to the improved performance of an organization, usually recognized as best by other peer organizations. Bias A systematic error which contributes to the difference between a population mean of measurements or test results and an accepted reference value. It is the difference between the observed range of measurements and a reference (known) value.
  • 45. Quality Definitions – Page 11 (Return to Index) Big Q, little q A term used to contrast the difference between managing for quality in all business processes and products (big Q) and managing for quality in a limited capacity— traditionally only in factory products and processes (little q). Bimodal distribution A statistical distribution having two modes - indicating a mixing of two populations such as different shifts, machines, workers, etc. Binomial distribution The distribution of a binomial response variable, one which has two possible outcomes - yes, no; pass, fail, etc. Bill of Material (BOM) Total list of all components/materials required to manufacture the product. Black Belt (BB) A leadership structure for Six-sigma process improvement teams. Black Belts are highly-regarded, technically-oriented product or line personnel who have an ability to lead teams as well as to advise management. Full-time team leader responsible for implementing process improvement projects—define, measure, analyze, improve and control (DMAIC) or define, measure, analyze, design and verify (DMADV)—within a business to drive up customer satisfaction and productivity levels. Blemish An imperfection severe enough to be noticed but that should not cause any real impairment with respect to intended normal or reasonably foreseeable use. Also see “defect”, “imperfection” and “nonconformity”. Block diagram A diagram that shows the operation, interrelationships and interdependencies of components in a system. Boxes, or blocks (hence the name), represent the components; connecting lines between the blocks represent interfaces. There are two types of block diagrams: 1. A functional block diagram, which shows a system’s subsystems and lower level products and their interrelationships and which interfaces with other systems. 2. A reliability block diagram, which is similar to the functional block diagram but is modified to emphasize those aspects influencing reliability. They are heavily used in the engineering world in hardware design, software design, and process flow diagrams. Also see “Block Diagram Example”. Blocking A technique used in classical DOE to remove the effects of unwanted noise or variability from the experimental response so that only the effects from the control factors are present in the response data.
  • 46. Quality Definitions – Page 12 (Return to Index) Board of Standards Review (BSR) An American National Standards Institute board responsible for the approval and withdrawal of American National Standards. Body of Knowledge (BOK) The prescribed aggregation of knowledge in a particular area an individual is expected to have mastered to be considered or certified as a practitioner. Bottleneck Any resource whose capacity is equal to or less than the demand placed on it. Bottom line The essential or salient point; the primary or most important consideration. Also, the line at the bottom of a financial report that shows the net profit or loss. Boundary diagram Graphical illustration of a process or product and its interfaces to other parts, processes, sub-systems and systems. Also see “Boundary Diagram Example.” Box plot A box plot, also known as a box and whisker diagram, is a basic graphing tool that displays centering, spread, and distribution of a continuous data set. Also see “Box and Whisker Plot Analysis”. Box Score reporting Box Scores are used widely within lean accounting. The standard format of the box score shows a 3-dimensional view of value stream performance; operational performance measurements, financial performance, and how the value stream capacity is being used. The capacity information shows how much of the capacity within the value stream is used productively, how much is used to do non-productive activities, and how much value stream capacity is available for use. The box score shows the value stream performance on a single sheet of paper and using a simple and accessible format. Also see “Box Score Reporting Example” and “Decision-Making using Box Scores”. Brainstorming A method to get ideas from persons who are potential contributors. No criticism or discussion of ideas is allowed until all the ideas are recorded. The ideas are critically reviewed after the brainstorming session. Breakthrough improvement A dynamic, decisive movement to a new, higher level of performance. Brown–Forsythe test The Brown and Forsyth test statistic is the F statistic resulting from an ordinary one-way analysis of variance on the absolute deviations from the median.
  • 47.
  • 48. Quality Definitions – Page 13 (Return to Index) BS 7799 A standard written by British commerce, government and industry stakeholders to address information security management issues, including fraud, industrial espionage and physical disaster. Might become an International Organization for Standardization standard. Build-To-Schedule Ratio (BTS) A metric that measures how well a plant executes plans to produce precisely what customers, in the proper sequence and mix. Bulk materials Products that do not have the characteristics of formed parts when received, but become part of the product during the manufacturing process. Business process Series of logically related activities or tasks (such as planning, production, sales) performed together to produce a defined set of results. Also called “business function”.   Business process mapping Refers to activities involved in defining exactly what a business entity does, who is responsible, to what standard a process should be completed and how the success of a business process can be determined. Business Process Management System (BPMS) A nine step model enables companies to model, deploy and manage mission-critical business processes, that span multiple enterprise applications, corporate departments. BPMS is usually used for lesser mature processes to make them Repeatable & Reliable. The nine step approach includes: 1. Create Process Mission. 2. Document Process. 3. Document Customer & Process requirements. 4. Identify Output & Process Measures. 5. Build process management system. 6. Establish data collection plan. 7. Process performance monitoring. 8. Develop dashboards with spec limits & targets. 9. Identify improvement opportunities. Business Process Reengineering (BPR) The concentration on improving a business' process(es) to deliver output(s) that will achieve results meeting the firm’s objectives, priorities and mission. Bx Life The time at which x% of parts are expected to have failed. For example, B5 Life = time at which 5% of parts have failed.
  • 49. Quality Definitions – Page 14 (Return to Index) c-chart See “count chart”. Calibration The comparison of a measurement instrument or system of unverified accuracy to a measurement instrument or system of known accuracy to detect any variation from the required performance specification. Capability The total range of inherent variation in a stable process determined by using data from control charts. Capability index The ratio of tolerance to 6 sigma, or the upper specification limit (USL) minus the lower specification limit (LSL) divided by 6 sigma. It is sometimes referred to as the engineering tolerance divided by the natural tolerance and is only a measure of dispersion. Measures of the capability of a manufacturing process to produce parts within given upper and lower variability limits (tolerances). In a process that is in statistical control (has only common causes of variation), as the Cp increases so does the difference between what the process is capable of producing and what it is required to produce. A Cp of 1 indicates 0.3 percent rejects or 3000 rejected parts per million (PPM), and is called the condition of Three Sigma. A Cp of 2 indicates 0.0007 percent rejects or 7 rejected ppm, a condition of six sigma. Also called process capability index, production capability index, or production capability ratio. Formula: (Upper variability limit - Lower variability limit) ÷ 6 x Standard deviation of the spread of variation. Capability Maturity Model (CMM) A framework that describes the key elements of an effective software process. It’s an evolutionary improvement path from an immature process to a mature, disciplined process. The CMM covers practices for planning, engineering and managing software development and maintenance to improve the ability of organizations to meet goals for cost, schedule, functionality and product quality. Capacity constraint resources A series of non-bottlenecks (based on the sequence in which jobs are performed) that can act as a constraint. Cascading The continuing flow of the quality message down to, not through, the next level of supervision until it reaches all workers. Also see “deployment”.
  • 50. Quality Definitions – Page 15 (Return to Index) CASCO An International Organization for Standardization policy development committee for conformity assessment. Cause An identified reason for the presence of a defect or problem. Cause and effect diagrams A tool for analyzing process dispersion. Also see Fishbone or Ishikawa Diagrams. One of the 7 Basic Tools of Quality Control. Also see “Ishikawa Diagram Example”. Cell An arrangement of people, machines, materials and equipment in which the production (processing) steps are placed next to each other in sequential order and through which parts are produced (processed) in a continuous flow. The most common cell layout is a U shape. Cellular manufacturing Arranging machines in the correct production (processing) sequence, with operators remaining within the cell and materials presented to them from outside. CE mark A mandatory conformity mark on many products placed on the single market in the European Economic Area (EEA). The CE marking certifies that a product has met EU consumer safety, health or environmental requirements. CE stands for Conformité Européenne, "European conformity" in French. Centerline A line on a graph that represents the overall average (mean) operating level of the process. Central tendency The tendency of data gathered from a process to cluster toward a middle value somewhere between the high and low values of measurement. Certification The result of a person meeting the established criteria set by a certificate granting organization. Certified Biomedical Auditor (CBA) An ASQ certification. Certified Calibration Technician (CCT) An ASQ certification.
  • 51. Quality Definitions – Page 16 (Return to Index) Certified HACCP Auditor (CHA) An ASQ certification. Certified Manager of Quality/Organizational Excellence (CMQ/OE) An ASQ certification; formerly certified quality manager (CQM). Certified Quality Auditor (CQA) An ASQ certification. Certified Quality Engineer (CQE) An ASQ certification. Certified Quality Improvement Associate (CQIA) An ASQ certification. Certified Quality Inspector (CQI) An ASQ certification; formerly certified mechanical inspector (CMI). Certified Quality Process Analyst (CQPA) An ASQ certification. Certified Quality Technician (CQT) An ASQ certification. Certified Reliability Engineer (CRE) An ASQ certification. Certified Six Sigma Black Belt (CSSBB) An ASQ certification. Certified Six Sigma Green Belt (CSSGB) An ASQ certification. Certified Software Quality Engineer (CSQE) An ASQ certification. Chain reaction A chain of events described by W. Edwards Deming: improve quality, decrease costs, improve productivity, increase market with better quality and lower price, stay in business, provide jobs and provide more jobs.
  • 52. Quality Definitions – Page 17 (Return to Index) Chain sampling plan In acceptance sampling, a plan in which the criteria for acceptance and rejection apply to the cumulative sampling results for the current lot and one or more immediately preceding lots. Champion A business leader or senior manager who ensures resources will be available for training and projects, and who is involved in periodic project reviews; also an executive who supports and addresses Six Sigma organizational issues. Change agent An individual from within or outside an organization who facilitates change in the organization; might be the initiator of the change effort, but not necessarily. Changeover A process in which a production device is assigned to perform a different operation or a machine is set up to make a different part—for example, a new plastic resin and new mold in an injection molding machine. Changeover time The time required to modify a system or workstation, usually including both teardown time for the existing condition and setup time for the new condition. Characteristic The factors, elements or measures that define and differentiate a process, function, product, service or other entity. Characteristic matrix An analytical technique for displaying the relationship between process parameters and manufacturing stations. Chart A tool for organizing, summarizing and depicting data in graphic form. Charter A written commitment approved by management stating the scope of authority for an improvement project or team. Checklist A tool for ensuring that all the important steps or actions in an operation have been taken. Checklists contain items important or relevant to an issue or situation. Checklists are often confused with check sheets.
  • 53. Quality Definitions – Page 18 (Return to Index) Check sheet A simple document that is used for collecting data in real-time and at the location where the data is generated. The document is typically a blank form that is devised for the quick, easy, and efficient recording of the desired information, which can be either quantitative or qualitative. When the information is quantitative, the check sheet is sometimes called a tally sheet. One of the 7 Basic Tools of Quality Control. Chi-square Automatic Interaction Detection (CHAID) A statistical technique used to segment customers on the basis of multiple alternative variables. The analysis creates a segmentation tree and continues to add different variables (branches), to the tree as long as it is statistically significant. Classification of defects The listing of possible defects of a unit, classified according to their seriousness. Note: Commonly used classifications: class A, class B, class C, class D; or critical, major, minor and incidental; or critical, major and minor. Definitions of these classifications require careful preparation and tailoring to the product(s) being sampled to ensure accurate assignment of a defect to the proper classification. A separate acceptance sampling plan is generally applied to each class of defects. Closed-Loop Corrective Action (CLCA) A sophisticated engineering system to document, verify and diagnose failures, recommend and initiate corrective action, provide follow-up and maintain comprehensive statistical records. Code of conduct: Expectations of behavior are mutually agreed upon by the team members. Collaborative Sketch (C-Sketch) Similar to Method 635, except that its starting point is the initial presentation of a single design concept, as a sketch, by each of the team members. Combinatorial optimization The efficient allocation of limited resources to yield the best solution to meet the objectives when the values of some or all of the variables must be integers and there are many possible combinations. Common causes Used to refer to variation that happens in the same way from worker to worker, hour to hour, lot to lot, etc. On a control chart, common causes by definition always fall within control limits. Also see “special causes”. Company culture A system of values, beliefs and behaviors inherent in a company. To optimize business performance, top management must define and create the necessary culture.
  • 54. Quality Definitions – Page 19 (Return to Index) Complaint tracking Collecting data, disseminating them to appropriate persons for resolution, monitoring complaint resolution progress and communicating results. Compliance The state of an organization that meets prescribed specifications, contract terms, regulations or standards. Computer Aided Design (CAD) A type of software used by architects, engineers, drafters and artists to create precision drawings or technical illustrations of their designs. CAD software can be used to create 2-D drawings or 3-D models. Computer Aided Engineering (CAE) A broad term used by the electronic design automation industry for the use of computers to design, analyze and manufacture products and processes. CAE includes CAD and computer aided manufacturing (CAM), which is the use of computers for managing manufacturing processes. Computer-aided manufacturing (CAM) The use of computer software to control machine tools and related machinery in the manufacturing of work pieces. CAM may also refer to the use of a computer to assist in all operations of a manufacturing plant, including planning, management, transportation and storage. Concurrent Engineering (CE) A way to reduce cost, improve quality and shrink cycle time by simplifying a product’s system of life cycle tasks during the early concept stages. Conflict resolution The management of a conflict situation to arrive at a resolution satisfactory to all parties. Conflict Resolution Diagram (CRD) See “evaporating cloud”. (Part of the Theory of Constraints Thinking Process). Also see “Conflict Resolution Diagram Example”. Conformance An affirmative indication or judgment that a product or service has met the requirements of a relevant specification, contract or regulation. Conformity assessment All activities concerned with determining that relevant requirements in standards or regulations are fulfilled, including sampling, testing, inspection, certification, management system assessment and registration, accreditation of the competence of those activities and recognition of an accreditation program’s capability. .
  • 55. Quality Definitions – Page 20 (Return to Index) Confounding Allowing two or more variables to vary together so that it is impossible to separate their unique effects. If an experiment does not vary x and y separately then the effects of the two factors cannot be distinguished. Blocking may be used to separate these effects where one is expected to be a critical x and one appears to be noise. The main effects and interactions can be confounded in order to reduce the number of runs in a fractional factorial design of experiments. Conjoint analysis Involves measurement of psychological judgments (such as one's preferences) or perceived similarities or differences between alternatives (for example - which factors - price, quality, dealer location - are most important to customers when buying a new car). Conjoint measurement The difference from conjoint analysis is that it permits the use of rating when evaluating pairs of attributes or attribute profiles. Consensus A state in which all the members of a group support an action or decision, even if some of them don’t fully agree with it. Constraint Anything that limits a system from achieving higher performance or throughput; also, the bottleneck that most severely limits the organization’s ability to achieve higher performance relative to its purpose or goal. Constraint analysis The use of one or more constraint satisfaction algorithms to specify the set of feasible solutions. Constraints are programmed in rules or procedures that produce solutions to particular configuration and design problems using one or more constraint satisfaction algorithms. Constraints management See “theory of constraints”. Consultant An individual who has experience and expertise in applying tools and techniques to resolve process problems and who can advise and facilitate an organization’s improvement efforts. Consumer The external customer to whom a product or service is ultimately delivered; also called end user. Consumer risk Pertains to sampling and the potential risk that bad products will be accepted and shipped to the consumer.
  • 56. Quality Definitions – Page 21 (Return to Index) Contingency table A two-dimensional table constructed for classifying count data, the purpose of which is to determine whether two variables are dependent (or contingent) on each other. Continuous flow processing A method in which items are produced and moved from one production (processing) step to the next, one piece at a time. Each stage (process) makes only the one piece that the next stage (process) needs, and the transfer batch size is one. Also referred to as one-piece flow and single-piece flow. Continuous Improvement (CI) Process An ongoing effort to improve products, services or processes. These efforts can seek "incremental" improvement over time or "breakthrough" improvement all at once. Delivery (customer valued) processes are constantly evaluated and improved in the light of their efficiency, effectiveness and flexibility. Continuous Quality Improvement (CQI) A philosophy and attitude for analyzing capabilities and processes and improving them repeatedly to achieve customer satisfaction. Continuous sampling plan In acceptance sampling, a plan, intended for application to a continuous flow of individual units of product, which involves acceptance and rejection on a unit-by-unit basis and employs alternate periods of 100% inspection and sampling. The relative amount of 100% inspection depends on the quality of submitted product. Continuous sampling plans usually require that each t period of 100% inspection be continued until a specified number, i, of consecutively inspected units are found clear of defects. Note: For single level continuous sampling plans, a single d sampling rate (for example, inspect one unit in five or one unit in 10) is used during sampling. For multilevel continuous sampling plans, two or more sampling rates can be used. The rate at any time depends on the quality of submitted product. Control chart Based on the statistical variation of any process - control charts help focus on stability of a process. A graphical tool for monitoring a process and/or for determining where variation lies; control charts show results over time, with +/- 3σ boundaries representing the upper and lower control limits (UCL/LCLs). The chart frequently shows a central line to help detect a trend of plotted values toward either control limit. One of the 7 Basic Tools of Quality Control. Also see “Control Chart Examples”. Control limits The natural boundaries of a process within specified confidence levels, expressed as the upper control limit (UCL) and the lower control limit (LCL).
  • 57. Quality Definitions – Page 22 (Return to Index) Control plan Written descriptions of the systems for controlling part and process quality by addressing the key characteristics and engineering requirements. They are written by suppliers to address the important characteristics and engineering requirements of the product. Each part shall have a Control Plan, but in many cases, "family" Control Plans can cover a number of parts produced using a common process. Customer approval of Control Plans may be required prior to production part submission. Control methods Standard methods implemented during the “control” phase of the DMAIC process include: fix, minimize, standardize, measure and monitor, communicate and audit. Controllable input(s) Input variables (x’s) that can be changed to see the effect on process output variables (y’s); sometimes called “Knob” variables. Coordinate Measuring Machine (CMM) A device that dimensionally measures 3-D products, tools and components with an accuracy approaching 0.0001 inches (0.0025mm). Corrective action A solution meant to reduce or eliminate an identified problem. Corrective Action Report (CAR) The full cycle corrective action tool that offers ease and simplicity for employee involvement in the corrective action/process improvement cycle. Corrective and Preventive Action (CAPA) CAPA focuses on the systematic investigation of discrepancies (failures and/or deviations) in an attempt to prevent their recurrence (for corrective action) or prevent from occurrence (for preventive action). To ensure that corrective and preventive actions are effective, the systematic investigation of the failure incidence is pivotal in identifying the corrective and preventive actions undertaken. CAPA is part of the overall quality management system (QMS). Correlation (statistical) A measure of the relationship between two data sets of variables.
  • 58. Quality Definitions – Page 23 (Return to Index) Cost of Poor Quality (COPQ) The costs associated with providing poor quality products or services. There are four categories: internal failure costs (costs associated with defects found before the customer receives the product or service), external failure costs (costs associated with defects found after the customer receives the product or service), appraisal costs (costs incurred to determine the degree of conformance to quality requirements) and prevention costs (costs incurred to keep failure and appraisal costs to a minimum). Cost of Quality (COQ) The price of nonconformance (Philip B. Crosby) or the cost of poor quality (Joseph M. Juran), the term 'Cost of Quality', refers to the costs associated with providing poor quality product or service. Quality processes cannot be justified simply because "everyone else is doing them" - but return on quality (ROQ) has dramatic impacts as companies mature. Research shows that the costs of poor quality can range from 15%-40% of business costs (e.g., rework, returns or complaints, reduced service levels, lost revenue). Most businesses do not know what their quality costs are because they do not keep reliable statistics. Finding and correcting mistakes consumes an inordinately large portion resource. Typically, the cost to eliminate a failure in the customer phase is five times greater than it is at the development or manufacturing phase. Effective quality management decreases production costs because the sooner an error is found and corrected, the less costly it will be. Cost of quality comprises of four elements: 1 External Failure Cost Cost associated with defects found after the customer receives the product or service ex: processing customer complaints, customer returns, warranty claims, product recalls. 2 Internal Failure Cost Cost associated with defects found before the customer receives the product or service ex: scrap, rework, re-inspection, re-testing, material review, material downgrades. 3 Inspection (appraisal) Cost Cost incurred to determine the degree of conformance to quality requirements (measuring, evaluating or auditing) ex: inspection, testing, process or service audits, calibration of measuring and test equipment. 4 Prevention Cost Cost incurred to prevent (keep failure and appraisal cost to a minimum) poor quality ex: new product review, quality planning, supplier surveys, process reviews, quality improvement teams, education and training.
  • 59. Quality Definitions – Page 24 (Return to Index) Count chart (c-chart) A type of control chart used to monitor "count"-type data, typically total number of nonconformities per unit. It is also occasionally used to monitor the total number of events occurring in a given unit of time. The c-chart differs from the p-chart in that it accounts for the possibility of more than one nonconformity per inspection unit. Also see “Control Chart Examples”. Count per unit chart A control chart for evaluating the stability of a process in terms of the average count of events of a given classification per unit occurring in a sample. Also see “Control Chart Examples”. Cpk index Equals the lesser of the USL minus the mean divided by 3 sigma (or the mean) minus the LSL divided by 3 sigma. The greater the Cpk value, the better. Also see “differentiating Cpk and Ppk values”. Critical to Quality (CTQ) tree Used to decompose broad customer requirements into more easily quantified requirements. CTQs are what the customer expects of a product. The spoken needs of the customer. These needs would then be converted to measurable terms using tools such as DFMEA, etc. Critical Characteristics (CC) (in FMEA) Critical Characteristics are those product requirements (dimensions, performance tests) or process parameters that can affect compliance with government regulations of safe vehicle/product function and which require specific supplier, assembly, shipping, or monitoring and inclusion on Control Plans. Critical characteristics are identified with the inverted delta symbol. Critical input(s) x’s input for the tools (FMEA, DOE, SPC, etc.) and significant process knowledge have proved to have a major impact on the variability of the y’s. Critical process(es) Process(es) that present serious potential dangers to human life, health and the environment or that risk the loss of significant sums of money or customers. Critical product measurements Statistical measurements of the process capability in terms of its design specifications (limits) and performance (variability). Used in quality control, Cpk takes into account both accuracy (centering) and precision (dispersion) and helps determine the cause of failures and the need for changes in the product design, tooling, or the manufacturing process. Higher the Cpk value, greater the indication that the process is consistently under control (is within limits). A Cpk value of 1.33 is considered the minimum and, as it nears 2.0, the process approaches six sigma value meaning there are only 3.4 defective units out of one million produced. Also see “process capability”.
  • 60. Quality Definitions – Page 25 (Return to Index) Cross functional A term used to describe a process or an activity that crosses the boundary between functions. A cross functional team consists of individuals from more than one organizational unit or function. Cross pilot See “scatter diagram”. Cultural resistance A form of resistance based on opposition to the possible social and organizational consequences associated with change. Culture change A major shift in the attitudes, norms, sentiments, beliefs, values, operating principles and behavior of an organization. Culture, organizational A common set of values, beliefs, attitudes, perceptions and accepted behaviors shared by individuals within an organization. Cumulative Sum control charts (CUSUM) A control chart on which the plotted value is the cumulative sum of deviations of successive samples from a target value. The ordinate of each plotted point represents the algebraic sum of the previous ordinate and the most recent deviations from the target. The CUSUM approach uses the current and recent past process data to detect small to moderate shifts in the process average or variability. CUSUM stands for "cumulative sum" of deviations from the target and puts equal weight on the current and recent past data. Also see “Cumulative Sum Control Chart Example”. Current controls (in FMEA) The mechanisms (for both design and process) which prevent the cause of the failure mode from occurring, or detect the failure mode, should it occur, before the product reaches your customer. For example, current controls include SPC, inspections, written procedures, training, preventive maintenance and all other activities that ensure a smooth running process. Current Good Manufacturing Practices (CGMP) Regulations enforced by the U.S. Food and Drug Administration for food and chemical manufacturers and packagers. Current Reality Tree (CRT) A way of analyzing many system or organizational problems at once. By identifying root causes common to most or all of the problems, the CRT can greatly aid focused improvement of the system. (Part of the Theory of Constraints Thinking Process) Also see “Current Reality Tree Example”.
  • 61. Quality Definitions – Page 26 (Return to Index) Customer See “external customer” and “internal customer”. Customer delight The result of delivering a product or service that exceeds customer expectations. Customer Relationship Management (CRM) A strategy for learning more about customers’ needs and behaviors to develop stronger relationships with them. It brings together information about customers, sales, marketing, effectiveness, responsiveness, and market trends. It helps businesses use technology and human resources to gain insight into the behavior of customers and the value of those customers. Customer satisfaction The result of delivering a product or service that meets customer requirements. Customer Satisfaction Index (CSI) Introduced in 1994 by University of Michigan's Ross School of Business - CSI measures customer satisfaction at national level. Customer-Supplier Model (CSM) A model depicting Inputs flowing into a work process that, in turn, add value and produce Outputs delivered to a customer. Also called “customer-supplier methodology”. Customer-supplier partnership A long-term relationship between a buyer and supplier characterized by teamwork and mutual confidence. The supplier is considered an extension of the buyer’s organization. The partnership is based on several commitments. The buyer provides long-term contracts and uses fewer suppliers. The supplier implements quality assurance processes so incoming inspection can be minimized. The supplier also helps the buyer reduce costs and improve product and process designs. Cycle A sequence of operations repeated regularly. Cycle Line Layout (CLL) CLL provides a visual overview (to depict opportunities to eliminate waste, which enables process optimization) of a manufacturing process including - Operator Type (Direct/Indirect) and Percentage Utilization of Direct Labor, Operator Density by Workstation, Station Pitch, Line Side Layout including stock & stock storage methods & Identification of main fixed facilities. Cycle Time (C/T) Time that elapses between one product exiting the process to the next product coming out or the time it takes to complete a process step; typically the value-added time. If cycle time for every operation in a complete process can be reduced to equal takt time, products can be made in single-piece flow. Also see “takt time”.
  • 62. Quality Definitions – Page 27 (Return to Index) Data A set of collected facts. There are two basic kinds of numerical data: measured or variable data, such as “16 ounces,” “4 miles” and “0.75 inches;” and counted or attribute data, such as “162 defects.” Data analysis Breaking down the data to draw significant insights. Steps involved in data analysis - validate (make sure that the data is good), summarize (compute central tendency and dispersion), assess (histograms, etc) search for structure (relationship between variables with scatter plots, correlation, regression, etc), compare (mean, standard deviation, etc) and present results and draw conclusions. Decision matrix A matrix teams use to evaluate problems or possible solutions. For example, a team might draw a matrix to evaluate possible solutions, listing them in the far left vertical column. Next, the team selects criteria to rate the possible solutions, writing them across the top row. Then, each possible solution is rated on a scale of 1 to 5 for each criterion, and the rating is recorded in the corresponding grid. Finally, the ratings of all the criteria for each possible solution are added to determine its total score. The total score is then used to help decide which solution deserves the most attention. Defect An event of nonconformance to specification. Occurrence is measured in DPU (Defects Per Unit), DPO (Defects Per Opportunity), DPMO (Defects Per Million Opportunities) or Sigma Level. A given unit may have any number of defects - based on the number of opportunities. A unit with one or more defects is defective. Defects are caused by errors and measured using c-chart or u-chart. A binomial distribution characterizes defectives. There are four classes of defects: class 1, very serious, leads directly to severe injury or catastrophic economic loss; class 2, serious, leads directly to significant injury or significant economic loss; class 3, major, is related to major problems with respect to intended normal or reasonably foreseeable use; and class 4, minor, is related to minor problems with respect to intended normal or reasonably foreseeable use. Also see “blemish”, “imperfection” and “nonconformity”. Defective A defective unit; a unit of product that contains one or more defects with respect to the quality characteristic(s) under consideration. Define, Measure, Analyze, Improve, Control (DMAIC) An improvement system for existing processes which fall below specifications and need to be improved incrementally.
  • 63. Quality Definitions – Page 28 (Return to Index) Define, Measure, Analyze, Design, Verify (DMADV) An improvement system intended to develop new processes and/ or products at Six Sigma quality levels. Delighter A feature of a product or service that a customer does not expect to receive but that gives pleasure to the customer when received. Also called an “exciter”. Delphi method A systematic, interactive forecasting method which relies on a panel of experts. The experts answer questionnaires in two or more rounds. After each round, a facilitator provides an anonymous summary of the experts’ forecasts from the previous round as well as the reasons they provided for their judgments. Thus, experts are encouraged to revise their earlier answers in light of the replies of other members of their panel. Since its creation, the method has been used frequently to make predictions, seek consensus and generate ideas. The technique recognizes human judgment as legitimate and useful contribution and allows experts to generate ideas systematically for a complex problem. 1. Form the team 2. Selection of experts - most studies use a 15-35 member panel 3. Develop the first set of question or issues for idea generation 4. Transmission of the first set of questions to experts 5. Analysis of the first round of responses and feedback 6. Preparation and transmission of the second set of questions 7. Analysis of the second round of responses 8. Resolution Demerit chart (d-chart) A control chart for evaluating a process in terms of a demerit (or quality score); in other words, a weighted sum of counts of various classified nonconformities. Also see “Control Chart Examples”. Deming cycle Another term for the plan-do-study-act cycle. Walter Shewhart created it (calling it the plan-do-check-act cycle), but W. Edwards Deming popularized it, calling it plan-do- study-act. Also see “plan-do-check-act cycle. Deming prize Award given annually to organizations that, according to the award guidelines, have successfully applied companywide quality control based on statistical quality control and will continue to do so. Although the award is named in honor of W. Edwards Deming, its criteria are not specifically related to Deming’s teachings. There are three separate divisions for the award: the Deming Application Prize, the Deming Prize for Individuals and the Deming Prize for Overseas Companies. The award process is overseen by the Deming Prize Committee of the Union of Japanese Scientists and Engineers in Tokyo.
  • 64. Quality Definitions – Page 29 (Return to Index) Deming's 14 points 1. Establish Constancy of Purpose: plan and manage to the plan; detect and correct deviations. 2. Improve constantly and forever every system of production and service: small continuous improvement is better than infrequent quantum leaps. 3. Eliminate numerical goals and quotas, including management by objective: unsupported arbitrary objectives can be both restrictive & demoralizing. 4. Eliminate fear so that everyone may work effectively for the Company: mistakes happen and fear of disclosure impedes correction. 5. Institute leadership: managers must not be cops or directors but rather coaches of the creative team. 6. End the practice of awarding business largely on the basis of price: product quality, product improvement and reliability of supply are important. 7. Break down the barriers between departments: encourage communication and cooperation - eliminate chimneys and silos. 8. Institute training on the job: as product and process content grows, not all employees come equally prepared. 9. Eliminate the annual rating or merit system: performance is subject to variation whereas shared reward develops teamwork. 10.Institute a vigorous program of education and self-improvement: as employees promote the company, the company must develop its employees. 11.Eliminate slogans and exhortations: management, not an individual worker, is responsible for system performance. 12.Cease dependence on mass inspection: it is impractical to sort quality into a system that produces bad product. 13.Adopt the new philosophy: every department of the company can quantitatively measure its productivity. 14.Create a structure in top management to accomplish the transformation: successful systems can only be introduced and maintained by top management. Density function The function which yields the probability that a particular random variable takes on any one of its possible values. Dependability The degree to which a product is operable and capable of performing its required function at any randomly chosen time during its specified operating time, provided that the product is available at the start of that period. (Non-operation related influences are not included.) Dependability can be expressed by the ratio: time available divided by (time available + time required). Dependent events Events that occur only after a previous event.
  • 65. Quality Definitions – Page 30 (Return to Index) Deployment Dispersion, dissemination, broadcasting or spreading communication throughout an organization, downward and laterally. Also see “cascading”. Detection (in FMEA) An assessment of the likelihood that the current controls (design and process) will detect the cause (process weakness) of the failure mode, should it occur, thus preventing it from reaching your customer; the customer in this case could be the next operation, subsequent operations, or the end user. Design The planning that lays the basis for the making of every object or system. Most commonly linked with engineering. It can be used both as a noun and as a verb. • As a verb, "to design" refers to the process of originating and developing a plan for a product, structure, system, or component with intention. • As a noun, "a design" is used for either the final (solution) plan (e.g. proposal, drawing, model, description) or the result of implementing that plan in the form of the final product of a design process. Design Failure Mode Effects Analysis (DFMEA) The application of the Failure Mode and Effects Analysis method specifically to product design. It is a paper-and-pencil analysis method used in engineering to document and explore ways that a product design might fail in real-world use. A DFMEA documents the key functions of a design, the primary potential failure modes relative to each function and the potential causes of each failure mode. The DFMEA method allows the design team to document what they know and suspect about a product's failure modes prior to completing the design, and then use this information to design out or mitigate the causes of failure. See also FMEA. Design for Manufacturability and Assembly (DFMA) A simultaneous engineering method designed to optimize the relationship between design function, manufacturability, and ease of assembly. Design for Six Sigma (DFSS) A separate and emerging business process management methodology related to traditional Six Sigma. While the tools and order used in Six Sigma require a process to be in place and functioning, DFSS has the objective of determining the needs of customers and the business, and driving those needs into the product solution so created. DFSS is relevant to the complex system/product synthesis phase, especially in the context of unprecedented system development. It is process generation in contrast with process improvement. Design information checklist A mistake proofing checklist designed to assure that all important items were considered in establishing design requirements.
  • 66. Quality Definitions – Page 31 (Return to Index) Design of Experiment (DOE) DOE is a systematic approach to investigation of a system or process. A series of structured tests are created in which planned changes are made to the input variables of a process or system. The effects of these changes on a pre-defined output are then assessed. 'One change at a time' testing always carries the risk that the experimenter may find one input variable to have a significant effect on the response (output) while failing to discover that changing another variable may alter the effect of the first (i.e. some kind of dependency or interaction). This is because the temptation is to stop the test when this first significant effect has been found. In order to reveal an interaction or dependency, 'one change at a time' testing relies on the experimenter carrying the tests in the appropriate direction. In terms of resource the exact length and size of the experiment are set by the design (i.e. before testing begins). DOE is important as a formal way of maximizing information gained while resources required. It has more to offer than 'one change at a time' experimental methods, because it allows a judgment on the significance to the output of input variables acting alone, as well input variables acting in combination with one another. DOE can be used to find answers in situations such as "what is the main contributing factor to a problem?", "how well does the system/process perform in the presence of noise?", "what is the best configuration of factor values to minimize variation in a response?" etc. In general, these questions are given labels as particular types of study. In the examples given above, these are problem solving, parameter design and robustness study. In each case, DOE is used to find the answer; the only thing that marks them different is which factors would be used in the experiment. The order of tasks to using this tool starts with identifying the input variables and the response (output) that is to be measured. For each input variable, a number of levels are defined that represent the range for which the effect of that variable is desired to be known. An experimental plan is produced which tells the experimenter where to set each test parameter for each run of the test. The response is then measured for each run. The method of analysis is to look for differences between response (output) readings for different groups of the input changes. These differences are then attributed to the input variables acting alone (called a single effect) or in combination with another input variable (called an interaction). DOE is team oriented with a variety backgrounds (e.g. design, manufacturing, statistics etc.) should be involved when identifying factors and levels and developing the matrix as this is the most skilled part. Moreover, as this tool is used to answer specific questions, the team should have a clear understanding of the difference between control and noise factors. In order to draw the maximum amount of information a full matrix is needed which contains all possible combinations of factors and levels. If this requires too many experimental runs to be practical, fractions of the matrix can be taken dependent on which effects are of particular interest. The fewer the runs in the experiment the less information is available.
  • 67. Quality Definitions – Page 32 (Return to Index) Design record Engineering requirements typically contained in various formats; examples include engineering drawings, math data and referenced specifications. Designing in quality versus inspecting in quality. Also see “prevention versus detection”. Design reviews A proactive procedure to prevent problems and misunderstandings during the design and development of a product or process. Design validation Testing to ensure that product conforms to defined user needs and/or requirements. Design validation follows successful design verification and is normally performed on the final product under defined, operating conditions. Multiple validations may be performed if there are different intended uses. Design Verification (DVER) Testing to ensure that all design output(s) meet design input requirements. Design verification may include activities such as: Design Review, Performing Alternate Calculations, Understanding Tests & Demonstrations and Review of Design Stage Documents before Release. Design Verification Plan and Report (DVP&R) Summary form which lists each individual test, when it was performed, the specification, results and the assessment pass/fail. Part of PPAP. Deviation In numerical data sets, the difference or distance of an individual observation or data value from the center point (often the mean) of the set distribution. Diagnosis The activity of discovering the cause(s) of quality deficiencies; the practice of investigating symptoms, collecting and analyzing data, and conducting experiments to test theories to determine the root cause(s) of deficiencies. Diagnostic journey and remedial journey A two-phase investigation used by teams to solve chronic quality problems. In the first phase, the diagnostic journey, the team journeys from the symptom of a chronic problem to its cause. In the second phase, the remedial journey, the team journeys from the cause to its remedy. Discrimination (in MSE) The technological ability of the measurement system to adequately differentiate between measured values for a selected parameter.