SlideShare uma empresa Scribd logo
1 de 23
Stem and Leaf Plots

Key : 5 | 6 = 56 hours


STEM LEAF
   0 4 5 5 7
   1    0 4 5 5 7
   2    0 2 3 6 7
   3    2 4 6
   4
   5    6
   6
   7     5
                          Camera and Battery Images from Google Images
Camera Battery Life Testing

A magazine did some testing to see how long camera
  batteries lasted before they needed recharging.
  (Several cameras and test conditions were used).

The results, measured in number of hours until a
  camera’s battery was flat, were as follows:

       26, 32, 14, 10, 5, 34, 4, 7, 15, 17, 15,
       22, 27, 20, 23, 36, 5, 56, 75
Organising Battery Life Test Results

Our first step in analysing this data is to construct a Frequency
  Table of the results.

26, 32, 14, 10, 5, 34, 4, 7, 15, 17, 15, 22, 27, 20, 23, 36, 5, 56, 75

The Highest value is 75, and the lowest value is 4.

This gives a Range of 75 - 4 = 71.

Size of Class Intervals = Range / 10 = 71 divided by 10 = 7.1 = 7

Seven is not the easiest of numbers to work with, and so we have
  decided to group our data into Groups of 10.
Frequency Table for Battery Life

Battery Life   FREQUENCY Actual Values
                                         Here is the Frequency
    0-9            4      4, 5, 5, 7
                                         Table for our camera
   10-19           5      10, 14, 15,
                          15, 17         battery test results:
   20-29           5      20, 22, 23,
                          26, 27
   30-39           3      32, 34, 36     26, 32, 14, 10, 5, 34,
   40-49           0                     4, 7, 15, 17, 15, 22,
   50-59           1      56
                                         27, 20, 23, 36, 5,
   60-69           0
                                         56, 75
   70-79           1      75
Bar Graph for Battery Life
Battery Life   FREQUENCY

0-9                4
10-19              5
20-29              5
30-39              3
40-49              0
50-59              1
60-69              0
70-79              1


(The Horizontal Bar Chart for our   results, made using “Chart Go”.)
Stem and Leaf Diagram to show camera
                             battery life under various conditions

                                                Key : 5 | 6 = 56 hours


Battery Life   Actual Values                     STEM LEAF
0-9            4, 5, 5, 7             Ones          0    4 5 5 7
10-19          10, 14, 15, 15, 17    Tens           1    0 4 5 5 7
20-29          20, 22, 23, 26, 27   Twenties        2    0 2 3 6 7
30-39          32, 34, 36           Thirties        3    2 4 6
40-49                                Fourties       4
50-59          56                     Fifties       5    6
60-69                                Sixties        6
70-79          75                   Seventies       7     5
The Structure and Values for a
                                         Stem and Leaf Diagram
In a Stem and Leaf
Plot, the data
values are put in                                      Key : 5 | 6 = 56 hours
order from the
Lowest to Highest.
   Battery Life    Data Values                         STEM LEAF
We then group
   0-9
them into :        4, 5, 5, 7               Ones           0    4 5 5 7
   10-19             10, 14, 15, 15, 17    Tens            1    0 4 5 5 7
Ones = 0 to 9
   20-29
Tens = 10 to 19      20, 22, 23, 26, 27   Twenties         2    0 2 3 6 7
and so on. These                                           3    2 4 6
   30-39             32, 34, 36           Thirties
groups are called
the40-49
    “Stems”.                               Fourties        4
   50-59             56                     Fifties        5    6
The “Leaf” is the
    60-69
last digit on each                         Sixties         6
of the original                                            7     5
    70-79            75                   Seventies
data values.
Bar Chart and Stem & Leaf Diagram for
                   Camera Battery Life Testing


Notice how the Bar Chart and the S&L
Diagram have the same overall shape.
                                             Key : 5 | 6 = 56 hours


                                              STEM LEAF
                                                 0    4 5 5 7
                                                 1    0 4 5 5 7
                                                 2    0 2 3 6 7
                                                 3    2 4 6
                                                 4
                                                 5    6
                                                 6
                                                 7     5
Stem and Leaf Plot Values and Shape

Key : 5 | 6 = 56 hours


 STEM    LEAF
    0    4 5 5 7
    1    0 4 5 5 7
    2    0 2 3 6 7
    3    2 4 6
                         A Stem and Leaf Plot puts all of the
                         data values into order, and places
    4                    them in groups. It also has the same
    5    6               shape as a Bar Chart of the data.
    6
    7     5
                         It is like a Bar Chart, but with the
                         data values written onto it, instead
                         of having coloured bars.
Reading Stem and Leaf Plots


STEM     LEAF
   0     4 5 5 7            Ones       0|5 = 5
   1     0 4 5 5 7
   2     0 2 3 6 7        Twenties
                                     2|6 = 26 (Not 6)
   3     2 4 6
   4
   5     6                 Fifties   5|6 = 56 (Not 6)
   6
   7      5

 Key : 5 | 6 = 56 hours
Stem and Leaf – Maximum and Minimum

                          The Minimum value is always
STEM     LEAF             at the start of the S&L Plot:
   0     4 5 5 7          0|4 = 4
   1     0 4 5 5 7
                          The Maximum value is
   2     0 2 3 6 7        always at the end of the S&L
   3     2 4 6            plot: 7|5 = 75
   4
   5     6                The S&L contains 19 values,
                          (not 27 values).
   6
   7      5               Eg. Only count how many
                          Leaves there are.
 Key : 5 | 6 = 56 hours
Stem and Leaf – Median Average


STEM     LEAF              Because the data values
   0     4 5 5 7          are in order, (from lowest
   1     0 4 5 5 7        to highest), we can easily
   2     0 2 3 6 7        find the middle “Median”
   3     2 4 6            by crossing off values from
   4                      each end, until we reach
   5     6                the middle value.
   6
   7      5
                           Median = 20 hours
 Key : 5 | 6 = 56 hours
Stem and Leaf – Double Medians

                          For our Camera Battery Life
STEM     LEAF             results, we had 19 results
                          contained in the leaves.
   0     4 5 5 7
   1     0 4 5 5 7        Whenever we have an ODD
                          number of items like this, there
   2     0 2 3 6 7        is always only one middle
   3     2 4 6            number which is the “Median”.
   4                      The next example shows an
   5     6                EVEN number of items.
   6                      For an EVEN number of
   7      5               items, we will always have two
                          middle numbers.
 Key : 5 | 6 = 56 hours
Stem and Leaf – Double Medians
                          Here is a different set of Battery
STEM     LEAF             Life results, where we have 22
   0     4 5 5 7
                          results contained in the leaves.
   1     0 4 5 5 7        Whenever we have an EVEN
   2     0 2 3 6 7        number of items like this, there
   3     2 4 6            are always two middle numbers.
   4
                          We find the midpoint of these
   5     6 6 9            two numbers by adding them
   6                      together and dividing by 2.
   7      5 8
                          Median = ( 22 + 23 ) / 2
 Key : 5 | 6 = 56 hours   Median = 22.5 hours.
Making a Stem and Leaf Plot

Our original Battery Testing results were as follows:

26, 32, 14, 10, 5, 34, 4, 7, 15, 17, 15, 22, 27, 20, 23, 36, 5, 56, 75

We need to separate out these results into Groups of 10.

  Ones           5, 4, 7, 5
  Tens           14, 10, 15, 17, 15
  Twenties       26, 22, 27, 20, 23           Next we need to set up
  Thirties       32, 34, 36                   stems for the ones
  Fifties        56                           through to the seventies.
  Seventies      75                           (See next slide)
Making a Stem and Leaf Plot

Ones 5, 4, 7, 5                                    STEM LEAF
Tens 14, 10, 15, 17, 15                                0
                                                       1
Twenties 26, 22, 27, 20, 23
                                                       2
Thirties 32, 34, 36                                    3
Fourties                                               4
                                                       5
Fifties 56
                                                       6
Sixties
                                                       7
Seventies 75

Next we need to set up Leaves for all of the original values. (See next slide)
Making a Stem and Leaf Plot

Ones 5, 4, 7, 5                                  STEM LEAF
Tens 14, 10, 15, 17, 15                              0   5    4   7 5
                                                     1   4    0   5 7 5
Twenties 26, 22, 27, 20, 23
                                                     2   6    2   7 0 3
Thirties 32, 34, 36                                  3   2    4   6
Fourties                                             4
                                                     5   6
Fifties 56
                                                     6
Sixties
                                                     7    5
Seventies 75

We only take the last digit of each data value when making the leaves.
Unordered Stem and Leaf Plot

STEM LEAF
                         Our Stem and Leaf Plot
   0    5   4   7 5      does not have our data
   1    4   0   5 7 5    placed into order from
   2    6   2   7 0 3    lowest to highest.
   3    2   4   6
   4
   5    6
                         We call this plot an
   6                     “Unordered Stem and
   7    5                Leaf Plot”.

Key : 5 | 6 = 56 hours
Ordered Stem and Leaf Plot

    STEM LEAF                              STEM LEAF
       0    5   4   7 5                       0    4   5   5 7
       1    4   0   5 7 5                     1    0   4   5 5 7
       2    6   2   7 0 3       Place         2    0   2   3 6 7
       3    2   4   6             the         3    2   4   6
       4
                               leaves         4
                                 into
       5    6                                 5    6
                                order
       6                                      6
       7    5                                 7    5


     Key : 5 | 6 = 56 hours                Key : 5 | 6 = 56 hours

Unordered Stem and Leaf Plot            Ordered Stem and Leaf Plot
Groups of Five S&L Plot
 Groups of Five
 Stem and Leaf                       STEM LEAF
      Plot                               0    4
                                         0*   5   5 7
Groups of Ten S&L Plot                   1    0   4
                                         1*   5   5 7
  STEM LEAF                              2    0   2 3
     0    4   5   5 7      Split         2*   6   7
     1    0   4   5 5 7    each          3    2   4
     2    0   2   3 6 7   group          3*   6
     3    2   4   6
                          of ten         4
     4
                          in half        5
     5    6                              5*   6
     6                                   6
     7    5                              7
                                         7*   5
Groups of Five S&L Plot
 Groups of Five
 Stem and Leaf                               STEM LEAF
      Plot                                       0    4
                                 0 to 4
                            * 5 to 9             0*   5   5 7
In a Groups of Five S&L         10 to 14         1    0   4
Plot, the groups each
                            * 15 to 19           1*   5   5 7
contain a range of five.
                                 20 to 24        2    0   2 3
0 to 4 = 0,1,2,3,4 = five   * 25 to 29           2*   6   7
items (count them on             30 to 34        3    2   4
your fingers).
                            * 35 to 39           3*   6
The tens, for example            40 to 44        4
have a lower range of       * 45 to 49           4*
10 to 14 named as 1 |            50 to 54        5
and                         * 55 to 59           5*
an upper range of
15 to 19 named as 1* |                          etc
Stem and Leaf Plot - SUMMARY

• Stem and Leaf Plots have data placed into
  order from lowest to highest.
• They consist of a Stem Column (in tens)
  and a Leaf Column that has last digits only
• Because the data is in order, we can cross off
  forward and backward and find the Median
• The shape of the S&L Plot is the same as a
  horizontal Bar Chart of the data.
http://passyworldofmathematics.com/

Mais conteúdo relacionado

Destaque (16)

2.3 Histogram/Frequency Polygon/Ogives
2.3 Histogram/Frequency Polygon/Ogives2.3 Histogram/Frequency Polygon/Ogives
2.3 Histogram/Frequency Polygon/Ogives
 
Spearman Rank Correlation Presentation
Spearman Rank Correlation PresentationSpearman Rank Correlation Presentation
Spearman Rank Correlation Presentation
 
Correlation analysis ppt
Correlation analysis pptCorrelation analysis ppt
Correlation analysis ppt
 
Partial differential equations
Partial differential equationsPartial differential equations
Partial differential equations
 
Standard deviation
Standard deviationStandard deviation
Standard deviation
 
Standard Deviation and Variance
Standard Deviation and VarianceStandard Deviation and Variance
Standard Deviation and Variance
 
Skewness
SkewnessSkewness
Skewness
 
Standard deviation (3)
Standard deviation (3)Standard deviation (3)
Standard deviation (3)
 
Correlation and Simple Regression
Correlation  and Simple RegressionCorrelation  and Simple Regression
Correlation and Simple Regression
 
Pearson Correlation
Pearson CorrelationPearson Correlation
Pearson Correlation
 
Mean, median, mode, & range ppt
Mean, median, mode, & range pptMean, median, mode, & range ppt
Mean, median, mode, & range ppt
 
Correlation and regression
Correlation and regressionCorrelation and regression
Correlation and regression
 
Correlation ppt...
Correlation ppt...Correlation ppt...
Correlation ppt...
 
Skewness
SkewnessSkewness
Skewness
 
Mean, Median, Mode: Measures of Central Tendency
Mean, Median, Mode: Measures of Central Tendency Mean, Median, Mode: Measures of Central Tendency
Mean, Median, Mode: Measures of Central Tendency
 
Skewness & Kurtosis
Skewness & KurtosisSkewness & Kurtosis
Skewness & Kurtosis
 

Mais de Passy World

Congruent Triangles
Congruent TrianglesCongruent Triangles
Congruent Triangles
Passy World
 
Factorising Common Factors
Factorising Common FactorsFactorising Common Factors
Factorising Common Factors
Passy World
 
Expanding Binomial Brackets
Expanding Binomial BracketsExpanding Binomial Brackets
Expanding Binomial Brackets
Passy World
 

Mais de Passy World (20)

Why Exponents are Important
Why Exponents are ImportantWhy Exponents are Important
Why Exponents are Important
 
Exponents Rules
Exponents RulesExponents Rules
Exponents Rules
 
Equations with Fractions on Both Sides
Equations with Fractions on Both SidesEquations with Fractions on Both Sides
Equations with Fractions on Both Sides
 
Equations with Variables on Both Sides
Equations with Variables on Both SidesEquations with Variables on Both Sides
Equations with Variables on Both Sides
 
Gradient of Straight Lines
Gradient of Straight LinesGradient of Straight Lines
Gradient of Straight Lines
 
Midpoint Between Two Points
Midpoint Between Two PointsMidpoint Between Two Points
Midpoint Between Two Points
 
Linear Rules
Linear RulesLinear Rules
Linear Rules
 
Back to Back S&L Plots
Back to Back S&L PlotsBack to Back S&L Plots
Back to Back S&L Plots
 
Symmetry and Skew
Symmetry and Skew Symmetry and Skew
Symmetry and Skew
 
Grouped Mean Median Mode
Grouped Mean Median ModeGrouped Mean Median Mode
Grouped Mean Median Mode
 
The Tangent Ratio
The Tangent RatioThe Tangent Ratio
The Tangent Ratio
 
The Cosine Ratio
The Cosine RatioThe Cosine Ratio
The Cosine Ratio
 
The Sine Ratio
The Sine RatioThe Sine Ratio
The Sine Ratio
 
Labeling Trigonometry Triangles
Labeling Trigonometry TrianglesLabeling Trigonometry Triangles
Labeling Trigonometry Triangles
 
Similar Triangles II
Similar Triangles IISimilar Triangles II
Similar Triangles II
 
Similar Triangles
Similar TrianglesSimilar Triangles
Similar Triangles
 
Congruent Triangles
Congruent TrianglesCongruent Triangles
Congruent Triangles
 
Factorising Common Factors
Factorising Common FactorsFactorising Common Factors
Factorising Common Factors
 
Expanding Binomial Brackets
Expanding Binomial BracketsExpanding Binomial Brackets
Expanding Binomial Brackets
 
Rearranging Formulas
Rearranging FormulasRearranging Formulas
Rearranging Formulas
 

Último

Beyond the EU: DORA and NIS 2 Directive's Global Impact
Beyond the EU: DORA and NIS 2 Directive's Global ImpactBeyond the EU: DORA and NIS 2 Directive's Global Impact
Beyond the EU: DORA and NIS 2 Directive's Global Impact
PECB
 
Gardella_PRCampaignConclusion Pitch Letter
Gardella_PRCampaignConclusion Pitch LetterGardella_PRCampaignConclusion Pitch Letter
Gardella_PRCampaignConclusion Pitch Letter
MateoGardella
 
1029-Danh muc Sach Giao Khoa khoi 6.pdf
1029-Danh muc Sach Giao Khoa khoi  6.pdf1029-Danh muc Sach Giao Khoa khoi  6.pdf
1029-Danh muc Sach Giao Khoa khoi 6.pdf
QucHHunhnh
 
Gardella_Mateo_IntellectualProperty.pdf.
Gardella_Mateo_IntellectualProperty.pdf.Gardella_Mateo_IntellectualProperty.pdf.
Gardella_Mateo_IntellectualProperty.pdf.
MateoGardella
 

Último (20)

Unit-V; Pricing (Pharma Marketing Management).pptx
Unit-V; Pricing (Pharma Marketing Management).pptxUnit-V; Pricing (Pharma Marketing Management).pptx
Unit-V; Pricing (Pharma Marketing Management).pptx
 
Measures of Dispersion and Variability: Range, QD, AD and SD
Measures of Dispersion and Variability: Range, QD, AD and SDMeasures of Dispersion and Variability: Range, QD, AD and SD
Measures of Dispersion and Variability: Range, QD, AD and SD
 
Beyond the EU: DORA and NIS 2 Directive's Global Impact
Beyond the EU: DORA and NIS 2 Directive's Global ImpactBeyond the EU: DORA and NIS 2 Directive's Global Impact
Beyond the EU: DORA and NIS 2 Directive's Global Impact
 
Accessible design: Minimum effort, maximum impact
Accessible design: Minimum effort, maximum impactAccessible design: Minimum effort, maximum impact
Accessible design: Minimum effort, maximum impact
 
Gardella_PRCampaignConclusion Pitch Letter
Gardella_PRCampaignConclusion Pitch LetterGardella_PRCampaignConclusion Pitch Letter
Gardella_PRCampaignConclusion Pitch Letter
 
1029-Danh muc Sach Giao Khoa khoi 6.pdf
1029-Danh muc Sach Giao Khoa khoi  6.pdf1029-Danh muc Sach Giao Khoa khoi  6.pdf
1029-Danh muc Sach Giao Khoa khoi 6.pdf
 
Paris 2024 Olympic Geographies - an activity
Paris 2024 Olympic Geographies - an activityParis 2024 Olympic Geographies - an activity
Paris 2024 Olympic Geographies - an activity
 
Mattingly "AI & Prompt Design: The Basics of Prompt Design"
Mattingly "AI & Prompt Design: The Basics of Prompt Design"Mattingly "AI & Prompt Design: The Basics of Prompt Design"
Mattingly "AI & Prompt Design: The Basics of Prompt Design"
 
SECOND SEMESTER TOPIC COVERAGE SY 2023-2024 Trends, Networks, and Critical Th...
SECOND SEMESTER TOPIC COVERAGE SY 2023-2024 Trends, Networks, and Critical Th...SECOND SEMESTER TOPIC COVERAGE SY 2023-2024 Trends, Networks, and Critical Th...
SECOND SEMESTER TOPIC COVERAGE SY 2023-2024 Trends, Networks, and Critical Th...
 
Gardella_Mateo_IntellectualProperty.pdf.
Gardella_Mateo_IntellectualProperty.pdf.Gardella_Mateo_IntellectualProperty.pdf.
Gardella_Mateo_IntellectualProperty.pdf.
 
Measures of Central Tendency: Mean, Median and Mode
Measures of Central Tendency: Mean, Median and ModeMeasures of Central Tendency: Mean, Median and Mode
Measures of Central Tendency: Mean, Median and Mode
 
Basic Civil Engineering first year Notes- Chapter 4 Building.pptx
Basic Civil Engineering first year Notes- Chapter 4 Building.pptxBasic Civil Engineering first year Notes- Chapter 4 Building.pptx
Basic Civil Engineering first year Notes- Chapter 4 Building.pptx
 
Application orientated numerical on hev.ppt
Application orientated numerical on hev.pptApplication orientated numerical on hev.ppt
Application orientated numerical on hev.ppt
 
APM Welcome, APM North West Network Conference, Synergies Across Sectors
APM Welcome, APM North West Network Conference, Synergies Across SectorsAPM Welcome, APM North West Network Conference, Synergies Across Sectors
APM Welcome, APM North West Network Conference, Synergies Across Sectors
 
microwave assisted reaction. General introduction
microwave assisted reaction. General introductionmicrowave assisted reaction. General introduction
microwave assisted reaction. General introduction
 
Advance Mobile Application Development class 07
Advance Mobile Application Development class 07Advance Mobile Application Development class 07
Advance Mobile Application Development class 07
 
Holdier Curriculum Vitae (April 2024).pdf
Holdier Curriculum Vitae (April 2024).pdfHoldier Curriculum Vitae (April 2024).pdf
Holdier Curriculum Vitae (April 2024).pdf
 
Mixin Classes in Odoo 17 How to Extend Models Using Mixin Classes
Mixin Classes in Odoo 17  How to Extend Models Using Mixin ClassesMixin Classes in Odoo 17  How to Extend Models Using Mixin Classes
Mixin Classes in Odoo 17 How to Extend Models Using Mixin Classes
 
Advanced Views - Calendar View in Odoo 17
Advanced Views - Calendar View in Odoo 17Advanced Views - Calendar View in Odoo 17
Advanced Views - Calendar View in Odoo 17
 
Presentation by Andreas Schleicher Tackling the School Absenteeism Crisis 30 ...
Presentation by Andreas Schleicher Tackling the School Absenteeism Crisis 30 ...Presentation by Andreas Schleicher Tackling the School Absenteeism Crisis 30 ...
Presentation by Andreas Schleicher Tackling the School Absenteeism Crisis 30 ...
 

Stem and Leaf Stem Plots

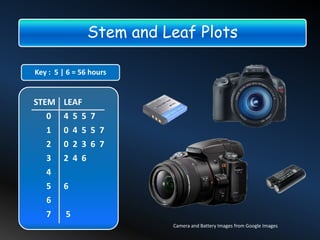
  • 1. Stem and Leaf Plots Key : 5 | 6 = 56 hours STEM LEAF 0 4 5 5 7 1 0 4 5 5 7 2 0 2 3 6 7 3 2 4 6 4 5 6 6 7 5 Camera and Battery Images from Google Images
  • 2. Camera Battery Life Testing A magazine did some testing to see how long camera batteries lasted before they needed recharging. (Several cameras and test conditions were used). The results, measured in number of hours until a camera’s battery was flat, were as follows: 26, 32, 14, 10, 5, 34, 4, 7, 15, 17, 15, 22, 27, 20, 23, 36, 5, 56, 75
  • 3. Organising Battery Life Test Results Our first step in analysing this data is to construct a Frequency Table of the results. 26, 32, 14, 10, 5, 34, 4, 7, 15, 17, 15, 22, 27, 20, 23, 36, 5, 56, 75 The Highest value is 75, and the lowest value is 4. This gives a Range of 75 - 4 = 71. Size of Class Intervals = Range / 10 = 71 divided by 10 = 7.1 = 7 Seven is not the easiest of numbers to work with, and so we have decided to group our data into Groups of 10.
  • 4. Frequency Table for Battery Life Battery Life FREQUENCY Actual Values Here is the Frequency 0-9 4 4, 5, 5, 7 Table for our camera 10-19 5 10, 14, 15, 15, 17 battery test results: 20-29 5 20, 22, 23, 26, 27 30-39 3 32, 34, 36 26, 32, 14, 10, 5, 34, 40-49 0 4, 7, 15, 17, 15, 22, 50-59 1 56 27, 20, 23, 36, 5, 60-69 0 56, 75 70-79 1 75
  • 5. Bar Graph for Battery Life Battery Life FREQUENCY 0-9 4 10-19 5 20-29 5 30-39 3 40-49 0 50-59 1 60-69 0 70-79 1 (The Horizontal Bar Chart for our results, made using “Chart Go”.)
  • 6. Stem and Leaf Diagram to show camera battery life under various conditions Key : 5 | 6 = 56 hours Battery Life Actual Values STEM LEAF 0-9 4, 5, 5, 7 Ones 0 4 5 5 7 10-19 10, 14, 15, 15, 17 Tens 1 0 4 5 5 7 20-29 20, 22, 23, 26, 27 Twenties 2 0 2 3 6 7 30-39 32, 34, 36 Thirties 3 2 4 6 40-49 Fourties 4 50-59 56 Fifties 5 6 60-69 Sixties 6 70-79 75 Seventies 7 5
  • 7. The Structure and Values for a Stem and Leaf Diagram In a Stem and Leaf Plot, the data values are put in Key : 5 | 6 = 56 hours order from the Lowest to Highest. Battery Life Data Values STEM LEAF We then group 0-9 them into : 4, 5, 5, 7 Ones 0 4 5 5 7 10-19 10, 14, 15, 15, 17 Tens 1 0 4 5 5 7 Ones = 0 to 9 20-29 Tens = 10 to 19 20, 22, 23, 26, 27 Twenties 2 0 2 3 6 7 and so on. These 3 2 4 6 30-39 32, 34, 36 Thirties groups are called the40-49 “Stems”. Fourties 4 50-59 56 Fifties 5 6 The “Leaf” is the 60-69 last digit on each Sixties 6 of the original 7 5 70-79 75 Seventies data values.
  • 8. Bar Chart and Stem & Leaf Diagram for Camera Battery Life Testing Notice how the Bar Chart and the S&L Diagram have the same overall shape. Key : 5 | 6 = 56 hours STEM LEAF 0 4 5 5 7 1 0 4 5 5 7 2 0 2 3 6 7 3 2 4 6 4 5 6 6 7 5
  • 9. Stem and Leaf Plot Values and Shape Key : 5 | 6 = 56 hours STEM LEAF 0 4 5 5 7 1 0 4 5 5 7 2 0 2 3 6 7 3 2 4 6 A Stem and Leaf Plot puts all of the data values into order, and places 4 them in groups. It also has the same 5 6 shape as a Bar Chart of the data. 6 7 5 It is like a Bar Chart, but with the data values written onto it, instead of having coloured bars.
  • 10. Reading Stem and Leaf Plots STEM LEAF 0 4 5 5 7 Ones 0|5 = 5 1 0 4 5 5 7 2 0 2 3 6 7 Twenties 2|6 = 26 (Not 6) 3 2 4 6 4 5 6 Fifties 5|6 = 56 (Not 6) 6 7 5 Key : 5 | 6 = 56 hours
  • 11. Stem and Leaf – Maximum and Minimum The Minimum value is always STEM LEAF at the start of the S&L Plot: 0 4 5 5 7 0|4 = 4 1 0 4 5 5 7 The Maximum value is 2 0 2 3 6 7 always at the end of the S&L 3 2 4 6 plot: 7|5 = 75 4 5 6 The S&L contains 19 values, (not 27 values). 6 7 5 Eg. Only count how many Leaves there are. Key : 5 | 6 = 56 hours
  • 12. Stem and Leaf – Median Average STEM LEAF Because the data values 0 4 5 5 7 are in order, (from lowest 1 0 4 5 5 7 to highest), we can easily 2 0 2 3 6 7 find the middle “Median” 3 2 4 6 by crossing off values from 4 each end, until we reach 5 6 the middle value. 6 7 5 Median = 20 hours Key : 5 | 6 = 56 hours
  • 13. Stem and Leaf – Double Medians For our Camera Battery Life STEM LEAF results, we had 19 results contained in the leaves. 0 4 5 5 7 1 0 4 5 5 7 Whenever we have an ODD number of items like this, there 2 0 2 3 6 7 is always only one middle 3 2 4 6 number which is the “Median”. 4 The next example shows an 5 6 EVEN number of items. 6 For an EVEN number of 7 5 items, we will always have two middle numbers. Key : 5 | 6 = 56 hours
  • 14. Stem and Leaf – Double Medians Here is a different set of Battery STEM LEAF Life results, where we have 22 0 4 5 5 7 results contained in the leaves. 1 0 4 5 5 7 Whenever we have an EVEN 2 0 2 3 6 7 number of items like this, there 3 2 4 6 are always two middle numbers. 4 We find the midpoint of these 5 6 6 9 two numbers by adding them 6 together and dividing by 2. 7 5 8 Median = ( 22 + 23 ) / 2 Key : 5 | 6 = 56 hours Median = 22.5 hours.
  • 15. Making a Stem and Leaf Plot Our original Battery Testing results were as follows: 26, 32, 14, 10, 5, 34, 4, 7, 15, 17, 15, 22, 27, 20, 23, 36, 5, 56, 75 We need to separate out these results into Groups of 10. Ones 5, 4, 7, 5 Tens 14, 10, 15, 17, 15 Twenties 26, 22, 27, 20, 23 Next we need to set up Thirties 32, 34, 36 stems for the ones Fifties 56 through to the seventies. Seventies 75 (See next slide)
  • 16. Making a Stem and Leaf Plot Ones 5, 4, 7, 5 STEM LEAF Tens 14, 10, 15, 17, 15 0 1 Twenties 26, 22, 27, 20, 23 2 Thirties 32, 34, 36 3 Fourties 4 5 Fifties 56 6 Sixties 7 Seventies 75 Next we need to set up Leaves for all of the original values. (See next slide)
  • 17. Making a Stem and Leaf Plot Ones 5, 4, 7, 5 STEM LEAF Tens 14, 10, 15, 17, 15 0 5 4 7 5 1 4 0 5 7 5 Twenties 26, 22, 27, 20, 23 2 6 2 7 0 3 Thirties 32, 34, 36 3 2 4 6 Fourties 4 5 6 Fifties 56 6 Sixties 7 5 Seventies 75 We only take the last digit of each data value when making the leaves.
  • 18. Unordered Stem and Leaf Plot STEM LEAF Our Stem and Leaf Plot 0 5 4 7 5 does not have our data 1 4 0 5 7 5 placed into order from 2 6 2 7 0 3 lowest to highest. 3 2 4 6 4 5 6 We call this plot an 6 “Unordered Stem and 7 5 Leaf Plot”. Key : 5 | 6 = 56 hours
  • 19. Ordered Stem and Leaf Plot STEM LEAF STEM LEAF 0 5 4 7 5 0 4 5 5 7 1 4 0 5 7 5 1 0 4 5 5 7 2 6 2 7 0 3 Place 2 0 2 3 6 7 3 2 4 6 the 3 2 4 6 4 leaves 4 into 5 6 5 6 order 6 6 7 5 7 5 Key : 5 | 6 = 56 hours Key : 5 | 6 = 56 hours Unordered Stem and Leaf Plot Ordered Stem and Leaf Plot
  • 20. Groups of Five S&L Plot Groups of Five Stem and Leaf STEM LEAF Plot 0 4 0* 5 5 7 Groups of Ten S&L Plot 1 0 4 1* 5 5 7 STEM LEAF 2 0 2 3 0 4 5 5 7 Split 2* 6 7 1 0 4 5 5 7 each 3 2 4 2 0 2 3 6 7 group 3* 6 3 2 4 6 of ten 4 4 in half 5 5 6 5* 6 6 6 7 5 7 7* 5
  • 21. Groups of Five S&L Plot Groups of Five Stem and Leaf STEM LEAF Plot 0 4 0 to 4 * 5 to 9 0* 5 5 7 In a Groups of Five S&L 10 to 14 1 0 4 Plot, the groups each * 15 to 19 1* 5 5 7 contain a range of five. 20 to 24 2 0 2 3 0 to 4 = 0,1,2,3,4 = five * 25 to 29 2* 6 7 items (count them on 30 to 34 3 2 4 your fingers). * 35 to 39 3* 6 The tens, for example 40 to 44 4 have a lower range of * 45 to 49 4* 10 to 14 named as 1 | 50 to 54 5 and * 55 to 59 5* an upper range of 15 to 19 named as 1* | etc
  • 22. Stem and Leaf Plot - SUMMARY • Stem and Leaf Plots have data placed into order from lowest to highest. • They consist of a Stem Column (in tens) and a Leaf Column that has last digits only • Because the data is in order, we can cross off forward and backward and find the Median • The shape of the S&L Plot is the same as a horizontal Bar Chart of the data.