
Recomendados
Recomendados
Mais conteúdo relacionado
Mais procurados
Mais procurados (16)
Semelhante a Performance of local vs foreign managers otten
Semelhante a Performance of local vs foreign managers otten (20)
Mais de bfmresearch
Mais de bfmresearch (20)
Último
Último (20)
Performance of local vs foreign managers otten
- 1. European Financial Management, Vol. 13, No. 4, 2007, 702–720 doi: 10.1111/j.1468-036X.2007.00379.x The Performance of Local versus Foreign Mutual Fund Managers Rog´ r Otten e Maastricht University and AZL, PO BOX 616 6200 MD Maastricht, The Netherlands E-mail: R.Otten@finance.unimaas.nl Dennis Bams Maastricht University and De Lage Landen (DLL), PO BOX 616 6200 MD Maastricht, The Netherlands E-mail: W.Bams@finance.unimaas.nl Abstract In this paper we examine the performance of US equity funds (locals) versus UK equity funds (foreigners) also investing in the US equity market. Based on informational disadvantages one would expect the UK funds to under-perform the US funds, especially in the research-intensive small company market. After controlling for tax treatment, fund objectives, investment style and time-variation in betas, we do not find evidence for this. In the small company segment we even find a slight out-performance for UK funds compared to US funds. Finally we observe a home bias in the UK portfolios, which is partly attributable to UK funds investing in cross-listed stocks in the USA. Keywords: mutual funds, home bias, information asymmetry, performance evalu- ation JEL classification: G12, G20, G23 1. Introduction Historically international investments clearly lagged domestic investments. From a diversification viewpoint this so called ‘home bias’ phenomenon creates a puzzle. Several reasons have been put forward to explain the preference of domestic investments over foreign investments. These include, for instance, transaction costs, institutional We thank John Doukas (the editor) an anonymous referee, Christopher Blake, Rob Bauer, Jean Dermine, Bart Frijns, William Goetzmann, Kees Koedijk, Stephen Ross, Stefan Ruenzi, Peter Schotman and participants of the 2002 BSI Gamma Foundation conference, the 2003 FMA-Europe Meeting in Dublin and the 2003 Meeting of the EFMA in Helsinki for helpful comments. Financial support from the BSI Gamma Foundation is gratefully acknowledged. All remaining errors are the sole responsibility of the authors. The views expressed in this paper are not necessarily shared by De Lage Landen (DLL) and AZL. C 2007 The Authors Journal compilation C Blackwell Publishing Ltd, 9600 Garsington Road, Oxford OX4 2DQ, UK and 350 Main Street, Malden, MA 02148, USA.
- 2. Local versus Foreign Mutual Fund Managers 703 constraints, currency risk and informational disadvantages. 1 Especially the latter argument has been tested extensively in previous studies. As local investors have superior access to information on local firms they outperform foreign investors. This is documented by, for instance, Brennan and Cao (1997), Coval and Moskowitz (2001) and Hau (2001). These results however mostly relate to foreign individual investors lacking local information. An obvious way to solve this could be to buy shares of a mutual fund that invests in the foreign market. Mutual fund managers are expected to have better access to information than individuals have. However, the current literature on the efficient use of mutual funds to invest in foreign markets is quite scant. Fletcher (1997) investigates the performance of UK mutual funds investing in US equity. Using 85 funds over the 1985– 96 period he finds UK funds investing in the USA register insignificant performance to their benchmark portfolios. This is in line with evidence on local US funds by for instance Gruber (1996) and Carhart (1997). A more direct comparison of local versus foreign mutual fund performance is made in Shukla and van Inwegen (1995). They study the performance differential of 108 US mutual fund managers investing in the USA, versus 18 UK managers also investing in the USA over the 1981–93 period. Controlling for factors like tax treatment, fund expenses, fund objectives and currency risk they conclude that UK mutual funds investing in the USA significantly under- perform US funds. The main explanation that is put forward again relates to the infor- mation disadvantages foreign fund managers face when competing against local fund managers. Shukla and van Inwegen (1995) base their results on a total database of 126 surviving funds by applying a 1-factor CAPM model. However, recently a number of studies emerged that contribute differences in return between locals and foreigners to the type of securities that are held. For instance Covrig et al. (2001), Kim (2000), Dahlquist and Robertsson (2001) and Kang and Stultz (1997) report that foreign investors hold relatively larger stocks compared to local investors and Grinblatt and Keloharju (2000) find that foreigners tend to be momentum investors while locals are contrarians. This calls for further investigation using multi-factor models in the spirit of Carhart (1997). Therefore, in this paper we re-examine the performance differential between local and foreign mutual fund managers, after controlling for tax treatment, fund expenses, fund objectives, survivorship bias and investment style. More specifically we will consider UK funds investing in the USA (foreign) versus US equity funds investing in the USA (local). 2 The added value of our paper compared to Shukla and van Inwegen (1995) lies in the use of more elaborate multi-factor asset pricing models, the more recent sample period (1990–2000), larger database (2531 funds), and the dynamic structure of our analysis. The latter will allow us to investigate the performance and risk development through time, in order to detect the impact of increased information dissemination. The remainder of the paper is organised as follows. In section 2 we describe the data that was used. Section 3 presents the results of our performance tests. In section 4 we discuss several robustness tests while section 5 concludes the paper. 1 See Lewis (1999) for a comprehensive survey on the ‘home bias’ puzzle. 2 For the remainder of this paper we refer to local funds as US funds and foreign funds as UK funds. C 2007 The Authors Journal compilation C Blackwell Publishing Ltd, 2007
- 3. 704 Rog´ r Otten and Dennis Bams e 2. Data 2.1. Mutual fund data Our data was collected from the CRSP Survivor-bias Free US Mutual Fund Database (USA) and Datastream (UK). All returns are inclusive of any distributions and net of annual management fees. For each mutual fund we also collect fund type or investment style, size and management fees. To be included in our sample a fund needs to have at least 24 months of returns and has to be invested in US equity for at least 85%. To select the UK funds investing in the USA we followed the classification of the 2001 UK Unit Trust Yearbook. This led to a total sample of 2436 US funds and 95 UK funds with monthly logarithmic returns from January 1990 through December 2000. As we are mainly interested in the ability of US and UK managers to pick US stocks, we transform all fund returns into US dollar returns. Furthermore we eliminate the possible effect of differential tax treatments by using pre-tax returns for both US and UK funds. 3 As pointed out by, for instance, Brown et al. (1992), leaving out dead funds leads to an overestimation of average performance. Our US data was survivorship-bias free. To avoid a possible survivorship bias for the UK we additionally add back funds that were closed at any point during the sample period. Through the Unit Trust Yearbook we were able to identify dead UK funds. Return data for these funds was then collected from Datastream. Dead funds were included in the sample until they disappeared. After that the portfolios are re-weighted accordingly. The percentage of disappearing funds throughout the sample period for the US and UK funds was 9.5% and 8.5%, respectively. The influence of this becomes apparent if we compare the mean returns of all funds (dead + surviving) with the return on surviving funds only. Restricting our sample to surviving funds would lead us to overestimate average US fund returns by 0.27% and UK fund returns by 0.38% per year. Panels A and B of Table 1 describe the mutual fund data we use in our subsequent analyses. To enhance the comparability of the results, and to take into account the previously mentioned observation that foreigners tend to invest in larger stocks, we group mutual funds into two separate categories: large company funds and small company funds. This grouping is based on the investment objective funds state themselves, using CRSP (USA) and the Unit Trust Yearbook (UK). From these two panels two interesting observations emerge. First, US funds out- perform UK funds. Second, although UK funds are much smaller (1/3 of the size of the average US fund) they charge lower fees. 4 3 More specifically, for UK funds we use returns that are gross of the Inland Revenue Tax and US withholding taxes on dividends from US companies. 4 A reason for that may lie in the fact that while US funds are required to report a so-called total expense ratio (TER), UK funds are not. Recent research by Fitzrovia International, a London-based fund research firm, showed that the reported costs for the UK-funds are not the same as the true costs because administration costs, legal and audit fees are not included. Because the SEC closely monitors US fees, as they appear in a fund’s prospectus, the difference between the true TER and the one reported will not be that large for the US market. UK fees should however be interpreted carefully. For more details on US versus European mutual fund fees see Otten and Schweitzer (2002). C 2007 The Authors Journal compilation C Blackwell Publishing Ltd, 2007
- 4. Local versus Foreign Mutual Fund Managers 705 Table 1 Summary statistics 1990:01–2000:12 Table 1 reports summary statistics on the US mutual funds (Panel A), UK mutual funds investing in the USA (Panel B), benchmark indices (Panel C) and instrumental variables (Panel D). The return data are annualised with reinvestment of all distributions. All fund returns are net of expenses and in USD. The Market factor is the excess return on the CRSP US total market index, SMB the factor mimicking portfolio for size, HML the factor mimicking portfolio for book-to-market, PR1YR the factor mimicking portfolio for the 12 month return momentum and UK market index the excess return on the FT-ALL index. Panel A: US mutual fund returns Mean excess Number Average Average expense Investment objective return S.D. of funds size ratio Large companies 8.24 11.25 1643 763 1.44 Small companies 11.13 18.81 793 312 1.64 All funds 9.06 12.63 2436 610 1.50 Surviving funds only 9.33 13.04 2205 634 1.48 Panel B: UK mutual fund returns Mean excess Number Average Average expense Investment objective return S.D. of funds size ratio Large companies 8.21 13.67 75 259 1.27 Small companies 13.12 18.00 20 87 1.40 All funds 8.60 14.21 95 223 1.30 Surviving funds only 8.98 14.17 87 231 1.29 Panel C: benchmark returns Cross-correlations Benchmark Mean return S.D. US market SMB HML PR1YR US market index 9.75 14.22 1.00 SMB −1.24 13.81 0.18 1.00 HML 2.49 12.48 −0.52 −0.53 1.00 PR1YR 12.68 14.81 0.12 0.11 −0.25 1.00 UK market index 4.62 15.02 0.60 −0.03 −0.20 0.15 Panel D: instrumental variables Cross-correlations Variable Mean S.D. T-Bill Term Default 1-month T-bill 4.92 0.37 1.00 Term spread 1.85 3.99 −0.55 1.00 Default spread 0.77 0.61 0.34 0.14 1.00 Dividend yield 2.34 2.76 0.10 0.61 0.45 C 2007 The Authors Journal compilation C Blackwell Publishing Ltd, 2007
- 5. 706 Rog´ r Otten and Dennis Bams e 2.2. Benchmark returns In our performance tests we use the CRSP total market index as the initial benchmark. After that we include factors to capture the size (SMB), book-to-market (HML) and momentum (PR1YR) effect. These returns were obtained from Eugene Fama and Mark Carhart. In addition to US factors we also test for a possible home bias by including the FT-All index, a UK market equivalent. Finally we collect four well known variables that are used to predict stock returns, in order to test for time-variation in betas. Details on these benchmarks and instrumental variables can be found in Panels C and D of Table 1. 3. Empirical Results 3.1. CAPM model The basic model used in studies on mutual fund performance is a CAPM based single index model. The intercept of such a model, α i , gives the Jensen alpha, which is usually interpreted as a measure of out- or under-performance relative to the used market proxy. Rit − Rft = αi + βi (Rmt − Rft ) + εit (1) where R it is the return on fund i in month t, R ft the return on a one month T-bill in month t, R mt the return on the CRSP equity benchmark in month t and ε it an error term. Table 2 presents the results of applying equation (1) on our database. Per country and within a country by investment objective, we compute Jensen’s alpha. To enhance comparability we also add a portfolio which is constructed by subtracting UK fund returns from US fund returns. This portfolio is then used to examine differences in risk and return between US and UK funds. From this Table two conclusions can be drawn. First, we find insignificant difference in alpha (0.61%) between US and UK funds. Second, also the market risk of US and UK funds does not differ significantly (−0.01) for the portfolio consisting of all funds. If we however differentiate between mutual funds that focus on large companies and ones that invest in smaller companies an interesting result emerges. US large company funds bear significantly less market risk compared to UK large company funds (−0.09). The opposite is true for small company funds, where US funds have significantly higher market risk than UK small company funds (0.15). 3.2. Multi-factor model The previously used 1-factor model assumes that a fund’s investment behaviour can be approximated using only a single market index. It does however not fully account for holdings in smaller companies. For this reason Elton et al. (1993) propose to add a small cap benchmark to the previous 1-factor CAPM model. In addition to that, Fama and French (1992, 1993, 1996) provide strong evidence for the relevance of yet another factor, besides a small cap index. Based on their work on the cross-sectional variation of stock returns, Fama and French (1993) propose a 3-factor model. Besides a value- weighted market proxy two additional risk factors are used, size and book-to-market. 5 5 In Otten and Bams (2002) we provide evidence on the applicability of this model to European fund data. C 2007 The Authors Journal compilation C Blackwell Publishing Ltd, 2007
- 6. Local versus Foreign Mutual Fund Managers 707 Table 2 CAPM results Table 2 reports the results of the estimation of equation (1) for the 1990:01–2000:12 period. Reported are the OLS estimates for the US funds and UK fund investing in the USA. Finally the US-UK portfolio is constructed by subtracting the UK fund returns from the US fund returns. Rit − Rft = αi + βi (Rmt − Rft ) + εit . (1) Where R t is the fund return, Rf t the risk-free rate and Rm t the return on the CRSP US market index. All returns are in USD. Alphas are annualised. ∗∗∗ Significant at the 1% level; ∗∗ significant at the 5% level; ∗ significant at the 10% level. Investment objective Alpha Market beta R2 adj US funds Large companies 0.97 0.75∗∗∗ 0.89 Small companies −0.25 1.17∗∗∗ 0.78 All funds 0.62 0.87∗∗∗ 0.95 Surviving funds only 0.75 0.88∗∗∗ 0.92 UK funds Large companies 0.01 0.84∗∗∗ 0.76 Small companies 0.98 1.02∗∗∗ 0.59 All funds 0.01 0.88∗∗∗ 0.77 Surviving funds only 0.38 0.88∗∗∗ 0.78 US-UK funds Large companies 0.96 −0.09∗∗ 0.02 Small companies −1.23 0.15∗∗∗ 0.07 All funds 0.61 −0.01 0.00 Surviving funds only 0.37 0.00 0.00 Although the Fama and French model improves average CAPM pricing errors, it is not able to explain the cross-sectional variation in momentum-sorted portfolio returns. Therefore Carhart (1997) extends the Fama-French model by adding a fourth factor that captures the Jegadeesh and Titman (1993) momentum anomaly. The resulting model is consistent with a market equilibrium model with four risk factors, which can also be interpreted as a performance attribution model, where the coefficients and premia on the factor-mimicking portfolios indicate the proportion of mean return attributable to four elementary strategies. The Carhart model is estimated as follows: Rit − Rft = αi + β0i (Rmt − Rft ) + β1i SMBt + β2i HMLt + β3i PR1YRt + εit (2) where SMB t = the difference in return between a small cap portfolio and a large cap portfolio at time t HML t = the difference in return between a portfolio of high book - to - market stocks and a portfolio of low book - to - market stocks at time t PR1YR t = the difference in return between a portfolio of past winners and a portfolio of past losers at time t Table 3 summarises the results of applying the multi-factor model. First, we notice an increase in average R2 adj for the multi-factor model, especially for the small company C 2007 The Authors Journal compilation C Blackwell Publishing Ltd, 2007
- 7. 708 Rog´ r Otten and Dennis Bams e Table 3 Carhart 4-factor model The table reports the results of the estimation of equation (2) for the 1990:01–2000:12. Reported are the OLS estimates for each country and within countries based on investment objective. Difference is a portfolio which is constructed by subtracting UK from US fund returns. Rt − Rft = α + β0 (Rmt − Rft ) + β1 SMBt + β2 HMLt + β3 PR1YRt + εit (2) Where R t is the fund return, Rf t the risk-free rate, Rm the return on the CRSP market index, and SMB and HML the factor-mimicking portfolios for size and book-to-market. PR1YR is a factor-mimicking portfolio for the 12-month return momentum. All alphas in the Table are annualised. T-stats are heteroskedasticity consistent. ∗∗∗ Significant at the 1% levell; ∗∗ significant at the 5% level; ∗ significant at the 10% level. Investment objective Alpha Market beta SMB HML PR1YR R2 adj US funds Large companies −0.08 0.82∗∗∗ −0.09∗∗∗ 0.12∗∗∗ 0.00 0.92 Small companies 0.58 1.06∗∗∗ 0.58∗∗∗ 0.02 0.07∗∗∗ 0.96 All funds 0.06 0.90∗∗∗ 0.09∗∗∗ 0.10∗∗∗ 0.01 0.96 Surviving funds only 0.49 0.88∗∗∗ 0.16∗∗∗ 0.07∗∗∗ 0.02∗ 0.94 UK funds Large companies −0.18 0.87∗∗∗ 0.06 0.08 −0.02 0.76 Small companies 1.12 0.95∗∗∗ 0.65∗∗∗ 0.10 0.01 0.81 All funds 0.03 0.89∗∗∗ 0.17∗∗∗ 0.09 −0.01 0.79 Surviving funds only 0.46 0.89∗∗∗ 0.17∗∗∗ 0.07 −0.01 0.80 US-UK funds Large companies 0.10 −0.06 −0.14∗∗∗ 0.04 0.02 0.07 Small companies −0.54 0.11∗∗ −0.06 −0.07 0.06∗ 0.07 All funds 0.03 0.01 −0.08∗ 0.02 0.02 0.01 Surviving funds only 0.04 −0.01 −0.01 0.01 0.03 0.00 funds. Second, after correcting for market risk, size, book-to-market and momentum we find an insignificant difference in alpha between US and UK funds (0.03%). Third, the difference in market risk between the average US and UK fund is still negligible (0.01). Differentiating between large and small company funds however again reveals a smaller market risk for US large company funds (−0.06) and a larger market risk for US small company funds (0.11), relative to their UK peers. Note however that the difference for the large company funds is not significantly different from zero anymore. Fourth, in contrast to Kang and Stultz (1997), we do not find evidence for the preference of UK funds to buy the larger companies. The difference in SMB between the average US and UK fund is even significantly negative (−0.08), indicating that UK funds invest relatively more in small caps. This difference is however only significant for funds focusing on large companies (−0.14). Fifth, there appears to be no clear pattern concerning value/growth investing (HML) and momentum/contrarian (PR1YR). 3.3. Conditional multi-factor model Traditionally performance is measured using unconditional expected returns, assuming that both the investor and manager use no information about the state of the economy C 2007 The Authors Journal compilation C Blackwell Publishing Ltd, 2007
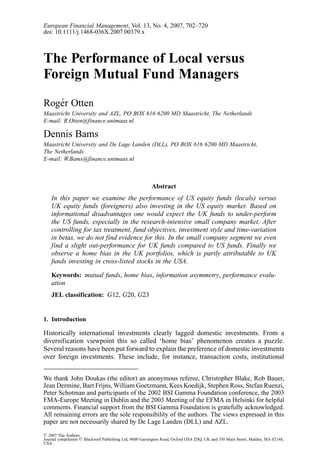
- 8. Local versus Foreign Mutual Fund Managers 709 to form expectations. If managers however trade on publicly available information, and employ dynamic strategies, unconditional models may produce inferior results. Calculating average alphas using a fixed beta estimate for the entire performance period consequently leads to unreliable results if expected returns and risks vary over time. To address these concerns on unconditional performance models, Chen and Knez (1996) and Ferson and Schadt (1996) advocate conditional performance measurement. This is done by using time-varying conditional expected returns and conditional betas instead of the usual, unconditional betas. To illustrate this, consider the following case were Z t−1 is a vector of lagged pre-determined instruments. Assuming that the beta for a fund varies over time, and that this variation can be captured by a linear relation to the conditional instruments, then β it = β i0 + B i Z t−1 , where B i is a vector of response coefficients of the conditional beta with respect to the instruments in Z t−1 . For a single index model the following equation is estimated: Rit − Rft = αi + βi0 (Rmt − Rft ) + B i Zt−1 (Rmt − Rft ) + εit (3) This equation can easily be extended to incorporate multiple factors, which results in a conditional model with time-varying betas. The instruments we use are publicly available and proven to be useful for predicting stock returns by several previous studies. 6 Introduced are (1) the 1-month T-bill rate, (2) dividend yield on the market index, (3) the slope of the term structure and finally (4) the quality spread, by comparing the yield on government and corporate bonds. All instruments are lagged 1 month. Table 4 presents the results of the conditional Carhart 4-factor model. While column 2 repeats the unconditional alphas from Table 3, the conditional alphas are in column 4. Allowing for time-variation in betas leads to an increase in alphas for both US and UK funds. The general conclusion however remains valid: we observe no significant difference in alpha between the average US and UK funds. Looking at the results by investment objective however reveals a significant under-performance of US small company funds compared UK small company mutual funds (−2.65%) at the 10% level. This is rather surprising as we would expect UK funds would face the most significant information disadvantages in the smaller companies market. There local information is most decisive to realise out-performance, as indicated in Covrig et al. (2001), Kim (2000), Dahlquist and Robertsson (2001) and Kang and Stultz (1997). Finally we examine the marginal explanatory power of adding time-variation by turning to the last column of Table 4, where we present the result of the Wald test. While for all US funds we can reject the hypothesis of constant betas at the 5% level, this is not the case for the UK funds. More interesting however is that the difference in return between US and UK funds is strongly time-varying. In Figure 1 we present some dynamics of the multi-factor exposures of US large company funds versus UK large company funds. The Figure presents the differences in time-varying market beta, SMB, HML and PR1YR between US and UK mutual funds. These results are obtained by evaluating the US-UK portfolio using the conditional multifactor version of equation (3). This yields some interesting results concerning the consistency of relative investment style deviations. While the unconditional market beta from Table 3 was lower for US large company funds compared to their UK peers, this difference turns around during the second half of the sample period. During the 1997–2000 period US large company 6 Pesaran and Timmerman (1995) discuss several studies that emphasise the predictability of returns based on interest rates and dividend yields. C 2007 The Authors Journal compilation C Blackwell Publishing Ltd, 2007
- 9. 710 Rog´ r Otten and Dennis Bams e Table 4 Conditional 4-factor model This table presents the results from the unconditional (column 2 and 3) and conditional (column 4 and 5) performance model. The results from the unconditional model are imported from Table 3 column 2, the conditional model results stem from the multifactor version of equation (3). Here we allow the market, SMB, HML and PR1YR betas to vary over time as a function of (1) the 1 month T-bill rate, (2) dividend yield (3) the slope of the term structure and (4) the quality spread. The last column of Table 4 provides results for heteroskedasticity-consistent Wald tests to examine whether the conditioning information adds marginal explanatory power to the unconditional model. All alphas are annualised. ∗∗∗ Significant at the 1% level; ∗∗ significant at the 5% level; ∗ significant at the 10% level. Unconditional Conditional Wald Investment objective 4f-alpha R2 adj 4f-alpha R2 adj (p-value) US funds Large companies −0.08 0.92 0.25 0.97 0.00 Small companies 0.58 0.96 0.85 0.97 0.00 All funds 0.06 0.96 0.38 0.98 0.00 Surviving funds only 0.49 0.94 0.97∗ 0.97 0.00 UK funds Large companies −0.18 0.76 −0.11 0.79 0.04 Small companies 1.12 0.81 3.50∗ 0.84 0.12 All funds 0.03 0.79 0.17 0.81 0.17 Surviving funds only 0.46 0.80 0.38 0.82 0.13 US-UK funds Large companies 0.10 0.07 0.36 0.30 0.00 Small companies −0.54 0.07 −2.65∗ 0.20 0.01 All funds 0.03 0.01 0.21 0.14 0.00 Surviving funds only 0.04 0.00 0.59 0.17 0.00 funds even had a higher beta than UK large company funds. To a lesser extent this also holds for the small cap exposure (SMB). Using a constant SMB local US company funds are significantly less exposed to smaller company stocks than UK funds, while this difference evaporates during the 1997–2000 period, using the conditional model. Figure 2 presents similar dynamics, but now for US versus UK small company funds. The most important observation from this Figure seems to be the time-variation in differences in market beta. Again based on Table 3 we find the unconditional difference in market beta to be significantly positive, indicating that US small company funds bear higher market risk compared to UK funds. Based on the conditional market parameter this difference seems to be varying quite a bit. Finally the negative SMB loading remains intact after introducing time-variation, indicating that US small company funds are exposed less to small company stocks, if compared to UK small company funds. 3.4. Discussion of our results Our results until now do not support the results of previous studies in this field. Where Shukla and van Inwegen (1995) document significant under-performance of UK funds versus US funds we find no significant difference in unconditional 4-factor alphas. Only after allowing for time-variation in betas we find evidence in support of the fact that US C 2007 The Authors Journal compilation C Blackwell Publishing Ltd, 2007
- 10. Local versus Foreign Mutual Fund Managers 711 .6 0.2 .4 0.0 .2 -0.2 .0 -0.4 -.2 -0.6 -.4 -0.8 -.6 -1.0 90 91 92 93 94 95 96 97 98 99 00 90 91 92 93 94 95 96 97 98 99 00 MARKET SMB .6 .3 .2 .4 .1 .2 .0 -.1 .0 -.2 -.2 -.3 -.4 -.4 90 91 92 93 94 95 96 97 98 99 00 90 91 92 93 94 95 96 97 98 99 00 HML PR1YR Fig. 1. Time-variation in differences between US and UK large company funds This figure presents the differences in time-varying market beta, SMB, HML and PR1YR between US and UK large company mutual funds. These results are obtained by evaluating the difference portfolio using the conditional multifactor version of equation (3). In order to introduce time-variation we allow the market beta, SMB, HML and Momentum to vary over time as a function of (1) the 1 month T-bill rate, (2) dividend yield (3) the slope of the term structure and (4) the quality spread. Results are reported for the entire 1990:01–2000:12 period. small company funds under-perform UK small company funds, at the 10% level. This is in sharp contrast to our expectations related to informational disadvantages. We would expect US funds to have an information advantage especially in the smaller companies market, leading to an out-performance compared to UK investors. This information advantage probably is less severe in the large company segment. Based on the latter argument Covrig et al. (2001), Kim (2000), Dahlquist and Robertsson (2001) and Kang and Stultz (1997) report that foreign investors hold relatively larger stocks compared to local investors and Grinblatt and Keloharju (2000) find that foreigners tend to be momentum investors while locals are contrarians. Our results however indicate that UK funds invest more in smaller companies, compared to their US peers, while momentum C 2007 The Authors Journal compilation C Blackwell Publishing Ltd, 2007
- 11. 712 Rog´ r Otten and Dennis Bams e .8 .4 .6 .2 .4 .0 .2 -.2 .0 -.4 -.2 -.6 -.4 -.8 91 92 93 94 95 96 97 98 99 00 91 92 93 94 95 96 97 98 99 00 MARKET SMB .8 .5 .6 .4 .3 .4 .2 .2 .1 .0 .0 -.2 -.1 -.4 -.2 -.6 -.3 91 92 93 94 95 96 97 98 99 00 91 92 93 94 95 96 97 98 99 00 HML PR1YR Fig. 2. Time-variation in differences between US and UK small company funds This figure presents the differences in time-varying market beta, SMB, HML and PR1YR between US and UK small company mutual funds. These results are obtained by evaluating the difference portfolio using the conditional multifactor version of equation (3). In order to introduce time-variation we allow the market beta, SMB, HML and Momentum to vary over time as a function of (1) the 1 month T-bill rate, (2) dividend yield (3) the slope of the term structure and (4) the quality spread. Results are reported for the entire 1990:01–2000:12 period. and/or contrarian strategies do not seem to matter. In the next section we explore several factors that could have influenced these results. 4. Robustness Tests 4.1. Expenses Until now we only reported results based on net returns, so after deducting management fees. Although this is the most relevant return for investors, gross returns enable us to judge whether US fund managers possess superior stock picking skills compared to UK funds. To address this issue we add back annual management fees to all funds in order to obtain the gross investment return. This return is then used to run the C 2007 The Authors Journal compilation C Blackwell Publishing Ltd, 2007
- 12. Local versus Foreign Mutual Fund Managers 713 Table 5 Performance gross of expenses Investment objective Alpha Market beta SMB HML PR1YR R2 adj US funds Large companies 1.36 0.82∗∗∗ −0.09∗∗∗ 0.12∗∗∗ 0.00 0.92 Small companies 2.22 1.06∗∗∗ 0.58∗∗∗ 0.02 0.07∗∗∗ 0.96 All funds 1.56 0.90∗∗∗ 0.09∗∗∗ 0.10∗∗∗ 0.01 0.96 Surviving funds only 1.97 0.88∗∗∗ 0.16∗∗∗ 0.07∗∗∗ 0.02∗ 0.94 UK funds Large companies 1.09 0.87∗∗∗ 0.06 0.08 −0.02 0.76 Small companies 2.62∗ 0.95∗∗∗ 0.65∗∗∗ 0.10 0.01 0.81 All funds 1.33 0.89∗∗∗ 0.17∗∗∗ 0.09 −0.01 0.79 Surviving funds only 1.64 0.89∗∗∗ 0.17∗∗∗ 0.07 −0.01 0.80 US-UK funds Large companies 0.27 −0.06 −0.14∗∗∗ 0.04 0.02 0.07 Small companies −0.40 0.11∗∗ −0.06 −0.07 0.06∗ 0.07 All funds 0.23 0.01 −0.08∗ 0.02 0.02 0.01 Surviving funds only 0.23 −0.01 −0.01 0.01 0.03 0.00 4-factor model again. These results are reported in Table 5. Since UK funds charge about 0.20% lower fees, the difference between the US and UK 4-factor alpha for the portfolio consisting of all funds rises from 0.03% to 0.23% per year. This difference however is still insignificantly different from zero. Therefore we believe a difference in management fees between US and UK funds does not drive our results. 4.2. Non-US equity holdings Although all funds explicitly state they only invest in US stocks there might still be some non-US equity holdings hidden in their portfolios. As we are dealing with open- end mutual funds a fixed-income exposure could be expected to provide the necessary liquidity. While cash exposures are covered by the inclusion of the risk-free rate in equations (1–3), we additionally include both a US and UK government bond index, following Elton et al. (1993, 1996). Some of the funds in our UK sample state they invest in North America, which next to the USA, also includes Canada. Therefore we also insert the excess return on the Toronto Stock Exchange (TSE) index. Finally we consider the explanatory power of the FT-All index, a UK equity market equivalent. To test for non-US equity holdings we therefore estimate the following equation: Rit − Rft = αi + β0i (Rmt − Rft ) + β1i SMBt + β2i HMLt + β3i PR1YRt + β4i US bondst + β5i UK bondst + β6i Canadian equityt + β7i UK equityt + εit (4) where: US bonds t = excess return on a US Government index at time t UK bonds t = excess return on a UK Government index at time t Canadian equity t = excess return on the TSE index at time t UK equity t = excess return on the FT - ALL index at time t C 2007 The Authors Journal compilation C Blackwell Publishing Ltd, 2007
- 13. 714 C 2007 The Authors Table 6 Non-US equity holdings US UK Canadian UK Investment objective Alpha Market beta SMB HML PR1YR Bonds Bonds equity equity R2 adj US funds Large companies 0.21 0.76∗∗∗ −0.10∗∗ 0.11∗∗∗ 0.00 −0.02 −0.01 0.07∗ −0.02 0.91 e Journal compilation C Blackwell Publishing Ltd, 2007 Small companies 0.35 1.11∗∗∗ 0.60∗∗∗ 0.03 0.06∗∗∗ 0.03 −0.00 −0.05 0.01 0.96 All funds 0.17 0.88∗∗∗ 0.08∗∗∗ 0.10∗∗∗ 0.01 −0.01 −0.01 0.03 −0.01 0.95 Surviving funds only 0.64 0.85∗∗∗ 0.15∗∗∗ 0.06∗ 0.03 −0.00 −0.01 0.03 −0.01 0.93 UK funds Large companies 0.16 0.83∗∗∗ 0.10∗∗∗ 0.07 −0.05 −0.04 −0.01 −0.02 0.20∗∗∗ 0.79 Small companies 1.44 0.92∗∗∗ 0.67∗∗∗ 0.09 −0.01 0.05 0.05 −0.06 0.12∗ 0.81 All funds 0.41 0.84∗∗∗ 0.22∗∗∗ 0.07 −0.03 −0.02 −0.00 −0.04 0.20∗∗∗ 0.82 Surviving funds only 0.71 0.85∗∗∗ 0.21∗∗∗ 0.06 −0.03 −0.02 0.01 −0.04 0.17∗∗∗ 0.81 Rog´ r Otten and Dennis Bams US-UK funds Large companies 0.05 −0.07 −0.20∗∗∗ 0.04 0.05 0.02 0.00 0.09∗ −0.22∗∗∗ 0.17 Small companies −1.09 0.19∗∗ −0.07 −0.06 0.07∗∗ −0.02 −0.05 0.01 −0.11∗∗ 0.08 All funds −0.24 0.04 −0.14∗∗∗ 0.03 0.04 0.01 −0.01 0.07 −0.21∗∗∗ 0.11 Surviving funds only −0.07 −0.01 −0.06 0.00 0.06 0.02 −0.02 0.07 −0.18∗∗∗ 0.09
- 14. Local versus Foreign Mutual Fund Managers 715 The results of estimating equation (4) are summarised in Table 6. Adding factors to capture a possible non-US equity holding reveals a significant UK equity exposure for UK funds (0.20), while all other factors are insignificant. As a result of that the exposure of the UK funds to the US index decreases rapidly. This UK exposure creates a puzzle, do UK funds investing in the USA really display a home bias? The annual reports of all UK funds are crystal clear, investments in UK stocks are strictly prohibited. In addition to that we contacted a large number of the UK asset managers investing in the USA, which all guaranteed they had no UK holdings. To solve this peculiar observation we explore three further possible sources of the UK exposure. All tests are performed using the 4-factor model augmented with the UK equity index, as all other non-US equity holdings are insignificant. Co-movement US and UK market Because the returns on the US and UK market are highly correlated (0.60, Table 1), our results might be driven by multicollinearity. 7 To disentangle the effect of the US and UK market on UK mutual funds we run two-step regressions in order to isolate the ‘true’ UK exposure. Formally we estimate: Rit − Rft = αi + β0i (Rmt − Rft ) + β1i SMBt + β2i HMLt + β3i PR1YRt (5) + β4i ‘Net’ UK equityt + εit where ‘Net’ UK equity = error term of regressing the FT - ALL index against the US index at time t In Table 7 we report the results of estimating equation (5). Correcting for the co- movement in US and UK equity we still find a significant UK equity exposure for all UK funds (0.19), especially for UK large company funds. Currency effects Often the existence of currency risk is mentioned as a cause of home bias. To limit currency effects a UK fund manager could engage in currency hedging. As the use of derivatives often is not allowed for mutual funds, a manager could alternatively create a ‘natural’ hedge. That is, he could include stocks in the portfolio that show a significant relationship to the Dollar/Pound exchange rate, hereby dampening adverse currency movements. To test for both possibilities we ran an ICAPM specification of equation (5), including the Dollar/Pound exchange rate. Based on results reported in Table 8 we conclude that the UK funds are not significantly related to the Dollar/Pound exchange rate. More importantly, including the exchange rate does not consume the exposure to the UK equity index, which is still significant (0.22). Cross-listings A final cause of the observed ‘home bias’ of UK funds could be cross-listings. Based on figures from the NYSE, 49 UK stocks have a listing at the NYSE by the end of our sample period (December 2000). So, although UK funds are not allowed to invest in 7 See also Engsted and Tanggaard (2004) for an analysis of co-movements between US and UK equity. C 2007 The Authors Journal compilation C Blackwell Publishing Ltd, 2007
- 15. 716 C 2007 The Authors Table 7 UK equity exposure using two-step regression Investment objective Alpha Market beta SMB HML PR1YR ‘Net’ UK equity R2 adj US funds Large companies −0.11 0.82∗∗∗ −0.09∗∗ 0.12∗∗∗ 0.00 −0.01 0.92 e Small companies 0.60 1.06∗∗∗ 0.58∗∗∗ 0.02 0.07∗∗∗ 0.01 0.95 Journal compilation C Blackwell Publishing Ltd, 2007 All funds 0.05 0.90∗∗∗ 0.09∗∗∗ 0.10∗∗∗ 0.01 0.00 0.96 Surviving funds only 0.46 0.88∗∗∗ 0.16∗∗∗ 0.07∗∗∗ 0.03 −0.01 0.94 UK funds Large companies 0.35 0.86∗∗∗ 0.08∗ 0.05 −0.04 0.19∗∗∗ 0.79 Small companies 1.53 0.94∗∗∗ 0.65∗∗∗ 0.08 0.00 0.12∗ 0.82 All funds 0.55 0.88∗∗∗ 0.19∗∗∗ 0.06 −0.03 0.19∗∗∗ 0.81 Surviving funds only 0.91 0.87∗∗∗ 0.19∗∗∗ 0.05 −0.03 0.16∗∗∗ 0.81 US-UK funds Rog´ r Otten and Dennis Bams Large companies −0.44 −0.04 −0.16∗∗∗ 0.07 0.04 −0.20∗∗∗ 0.15 Small companies −0.93 0.12∗∗ −0.07 −0.06 0.07∗ −0.11∗∗ 0.10 All funds −0.50 0.02 −0.10∗∗ 0.04 0.04 −0.19∗∗∗ 0.10 Surviving funds only −0.45 0.01 −0.03 0.02 0.06 −0.17∗∗∗ 0.05
- 16. C 2007 The Authors Table 8 Currency effects Investment objective Alpha Market beta SMB HML PR1YR ‘Net’ UK equity Exchange rate R2 adj US funds Large companies −0.12 0.83∗∗∗ −0.08 0.12∗∗∗ −0.01 −0.02 −0.01 0.92 Small companies 0.61 1.06∗∗∗ 0.58∗∗∗ 0.02 0.06∗∗∗ 0.00 0.00 0.95 Journal compilation C Blackwell Publishing Ltd, 2007 All funds 0.04 0.90∗∗∗ 0.09∗∗∗ 0.11∗∗∗ 0.01 −0.01 −0.01 0.96 Surviving funds only 0.45 0.89∗∗∗ 0.16∗∗∗ 0.07∗∗∗ 0.02 −0.02 −0.02 0.94 UK funds Large companies 0.64 0.71∗∗∗ 0.07∗ 0.04 −0.03 0.23∗∗∗ 0.07 0.79 Small companies 1.68 0.86∗∗∗ 0.65∗∗∗ 0.08 0.00 0.13∗ 0.02 0.81 All funds 0.83 0.73∗∗∗ 0.19∗∗∗ 0.05 −0.02 0.22∗∗∗ 0.06 0.81 Surviving funds only 1.14 0.74∗∗∗ 0.18∗∗∗ 0.04 −0.02 0.20∗∗∗ 0.07 0.81 US-UK funds Large companies −0.76 0.12∗∗ −0.15∗∗∗ 0.08 0.02 −0.24∗∗∗ −0.08 0.15 Small companies −1.07 0.20∗∗∗ −0.07 −0.06 0.06∗ −0.13∗∗ 0.02 0.09 Local versus Foreign Mutual Fund Managers All funds −0.77 0.17∗∗∗ −0.10∗∗ 0.06 0.03 −0.23∗∗∗ −0.07 0.10 Surviving funds only −0.69 0.15∗∗∗ −0.02 0.03 0.04 −0.21∗∗∗ −0.09 0.06 717
- 17. 718 Rog´ r Otten and Dennis Bams e Table 9 Cross-listings portfolio Table 6 reports the results of the estimation of equation (1) for the 1990:01–2000:12 period. As benchmark we now take a portfolio of all 51 cross-listed UK stocks. Reported are the OLS estimates for the US funds and UK fund investing in the USA. Finally the US-UK portfolio is constructed by subtracting the UK fund returns from the US fund returns. Rit − Rft = αi + βi (Rmt − Rft ) + εit (1) Where R t is the fund return, Rf t the risk-free rate and Rm t the return on the portfolio of cross-listed UK stocks in the USA. All returns are in USD. Alphas are annualised. ∗∗∗ Significant at the 1% level; ∗∗ significant at the 5% level; ∗ significant at the 10% level. Investment objective Alpha Market beta R2 adj US funds Large companies 6.29∗∗ 0.39∗∗∗ 0.29 Small companies 5.40∗ 0.51∗∗∗ 0.17 All funds 6.87∗∗ 0.43∗∗∗ 0.30 Surviving funds only 7.18∗ 0.43∗∗∗ 0.27 UK Funds Large companies 5.41∗ 0.56∗∗∗ 0.42 Small companies 8.50∗ 0.57∗∗∗ 0.21 All funds 5.75∗ 0.56∗∗∗ 0.40 Surviving funds only 6.21∗ 0.55∗∗∗ 0.38 US-UK Funds Large companies 0.88 −0.17∗∗∗ 0.11 Small companies −3.10 −0.06∗ 0.03 All funds 1.12 −0.13∗∗∗ 0.10 Surviving funds only 0.97 −0.12∗∗∗ 0.09 UK stocks in the UK, they might be buying UK stocks in the USA. Again based on the previously mentioned informational disadvantages born by foreign investors, UK managers probably prefer buying UK stocks rather than US stocks. Pagano et al. (2002) examined cross-listings and observe that firms that decide to list abroad are mostly the larger firms. From Table 7 we know that the UK exposure was most prominent for the larger company funds, which could support the view that part of the observed UK exposure actually arises because of UK managers buying UK stocks listed in the USA. In order to test for this possibility formally, we create a portfolio of all cross-listed UK stocks on the NYSE during 1990–2000. This cross-listings portfolio is then inserted in equation (1) to serve as the market benchmark. The results in Table 9 confirm our prior remarks. UK funds exhibit a significantly higher exposure to the cross-listed UK stocks in the USA compared to the US funds (−0.13). This UK bias is most prominent for the large company funds, corroborating our previous results. Based on this we believe cross-listings possibly add to the home bias observed with UK mutual funds. 5. Conclusion Previous literature on the home bias indicates that informational disadvantages lead to disproportionately large domestic investments. The general conclusion is mostly C 2007 The Authors Journal compilation C Blackwell Publishing Ltd, 2007
- 18. Local versus Foreign Mutual Fund Managers 719 that local investors out-perform foreign investors because they have superior access to information on local firms. This holds especially for the smaller companies. In this paper we re-examine this argument by looking at mutual funds. More specifically we considered UK equity mutual funds investing in the USA versus US equity mutual funds. The added value of our paper compared to previous studies in this field relates to the use of more elaborate multi-factor asset pricing models, larger database, the more recent sample period and the dynamic structure of our analysis. After controlling for tax treatment, fund objectives, management fees, investment style and time-variation in betas, we do not find a significant difference in risk-adjusted returns between US and UK funds. Furthermore we examined the investment style of US versus UK mutual fund managers. Based on previous research in this area we expected foreigners to invest relatively more in visible, well-known large company stocks, which suffer less from informational disadvantages. Our results however indicate that UK funds invest more in smaller companies, compared to their US peers. Finally we observe a home bias for the UK mutual funds. Based on our results using US and UK mutual funds we cannot confirm the under- performance of foreign investors that is documented in previous work. References Brennan, M. J. and Cao, H. H., ‘International portfolio investment flows’, Journal of Finance, Vol. 52, 1997, pp. 851–80. Brown, S. and Goetzmann, W., Ibbotson, R. and Ross, S. S., ‘Survivorship bias in performance studies’, Review of Financial Studies, Vol. 5, 1992, pp. 553–80. Carhart, M., ‘On persistence in mutual fund performance’, Journal of Finance, Vol. 52, 1997, pp. 57–82. Chen, Z. and Knez, P. J., ‘Portfolio performance measurement: theory and applications’, Review of Financial Studies, Vol. 9, 1996, pp. 511–556. Coval, J. and Moskowitz, T., ‘Home bias at home: local equity preference in domestic portfolios’, Journal of Finance, Vol. 54, 1999, pp. 2045–73. Covrig, V., Lau, S. T. and Ng, L., ‘Do domestic and foreign fund managers have similar preferences for stock characteristics? A cross-country analysis’, Working Paper (University of Wisconsin- Milwaukee, 2001). Dahlquist, M. and Robertsson, G., ‘Direct foreign ownership, institutional investors and firm charac- teristics’, Journal of Financial Economics, Vol. 59, 2001, pp. 413–40. Elton, E., Gruber, M., Das, S. and Hlavka, M., ‘Efficiency with costly information: a re-interpretation of evidence from managed portfolios’, Review of Financial Studies, Vol. 6, 1993, pp. 1–22. Elton, E., Gruber, M., Das, S. and Blake, C., ‘The persistence of risk-adjusted mutual fund perfor- mance’, Journal of Business, Vol. 69, 1996, pp. 133–57. Engsted, T. and Tanggaard, C., ‘The Comovement of US and UK Stock Markets’, European Financial Management, Vol. 10, 2004, pp. 593–607. Fama, E. and French, K. R., ‘The cross-section of expected stock returns’, Journal of Finance, Vol. 47, 1992, pp. 427–65. Fama, E. and French, K. R., ‘Common risk factors in the returns on stocks and bonds’, Journal of Financial Economics, Vol. 33, 1993, pp. 3–53. Fama, E. and French, K. R., ‘Multifactor explanations of asset pricing anomalies’, Journal of Finance, Vol. 51, 1996, pp. 55–84. Ferson, W. and Schadt, R., ‘Measuring fund strategy and performance in changing economic condi- tions’, Journal of Finance, Vol. 51, 1996, pp. 425–62. C 2007 The Authors Journal compilation C Blackwell Publishing Ltd, 2007
- 19. 720 Rog´ r Otten and Dennis Bams e Fletcher, J., ‘The evaluation of the performance of UK American unit trusts’, International Review of Economics and Finance, Vol. 8, 1997, pp. 455–66. Hau, H., ‘Location matters: an examination of trading profits’, Journal of Finance, Vol. 56, 2001, pp. 1959–83. Grinblatt, M. and Keloharju, M., ‘The investment behavior and performance of various investor-types: a study of Finland’s unique data set’, Journal of Financial Economics, Vol. 55, 2000, pp. 43–67. Gruber, M., ‘Another puzzle: The growth in actively managed mutual funds’, Journal of Finance, Vol. 51, 1996, pp. 783–807. Jegadeesh, N. and Titman, S., ‘Returns to buying winners and selling losers: implications for stock market efficiency’, Journal of Finance, Vol. 48, 1993, pp. 65–91. Kang, J. K. and Stulz, R. M., ‘Why is there a home bias? An analysis of foreign portfolio ownership in Japan’, Journal of Financial Economics, Vol. 46, 1997, pp. 3–28. Kim, W., ‘Do foreign investors perform better than locals? Information asymmetry versus investor sophistication’, Working Paper (Korea Development Institute (KDI), 2000). Lewis, K., ‘Explaining home bias in equities and consumption’, Journal of Economic Literature, Vol. 37, 1999, pp. 571–608. Otten, R. and Bams, D., ‘European mutual fund performance’, European Financial Management, Vol. 8, 2002, pp. 75–101. Otten, R. and Schweitzer, M., ‘A comparison between the European and the U.S. mutual fund industry’, Managerial Finance, 2002, pp. 14–34. Pagano, M., R¨ ell, A. and Zechner, J., ‘The geography of equity listing: why do companies list abroad?’, o Journal of Finance, Vol. 57, 2002, pp. 2651–94. Pesaran, M. and Timmerman, A., ‘Predictability of stock returns: robustness and economic signifi- cance’, Journal of Finance, Vol. 50, 1995, pp. 1201–28. Shukla, R. and van Inwegen G., ‘Do locals perform better than foreigners? An analysis of UK and US mutual fund managers’, Journal of Economics and Business, Vol. 47, 1995, pp. 241–54. C 2007 The Authors Journal compilation C Blackwell Publishing Ltd, 2007