1. Portfolio Manager Ownership
and Mutual Fund Performance
Allison L. Evans*
This paper examines the association between a mutual fiind manager's personal fimd investment
and mutual fund performance. From a data set of newly released managerial ownership disclo-
sures. I find that fund ownership levels are diverse and, in many instances, quite large. Mutual
fund returns are increasing in the level of managerial investment, consistent with personal own-
ership realigning decision-maker and shareholder interests. Also consistent with the reduction
of agency costs, ¡find thai managerial ownership is inversely related to fund turnover However,
there is no evidence of an association between managerial ownership and a mutual fiind s tax
burden.
The purpose of this paper is to determine whether a fund manager's personal ownership of
mutual fund shares is associated with differences in mutual fund performance. Specifically,
I explore whether mutual funds with minimally invested managers experience lower retums
and/or higher fund costs than do funds with managers who have a greater direct financial
stake. Such a finding would be consistent with fund ownership causing a reduction in agency
costs between managers and fund shareholders in the mutual fund industry, beyond the current
compensation structure. Over the years 2001 -2004,1 find that managerial ownership is positively
related to fimd retums, inversely related to turnover levels, and unrelated to the fund's tax
burden.
The relation between a manager's investment in a business and the performance ofthat business
has generated interest across the fields of accounting, finance, and economics. Numerous papers,
including Jensen and Meckling's ( 1976) seminal work, have analyzed the effects ofthe separation
of ownership and control, as well as compensation structures that attempt to realign incentives
between the two. Many studies have emerged that examine the relation between personal own-
ership and performance in the corporate setting. Studies have examined, for instance, the effect
of firm managerial ownership on discretionary accounting adjustments (e.g.. Warfield, Wild, and
Wild, 1995). disclosure decisions (e.g.. Aboody and Kasznik, 2000; Nagar. Nanda. and Wysocki,
2003). dividend policy (e.g.. Lambert, Lanen, and Larker, 1989; Brown, Liang, and Weisbenner,
2005; Chetty and Saez, 2005). inventory choices (e.g.. Hunt, 1985; Niehaus, 1989), investment
decisions (e.g.. Clinch. 1991; Ryan and Wiggins, 2002; Broussard, Buchenroth, and Pilotte,
2004), fiiture earnings (Hanlon, Rajgopal, and Shevlin, 2005), and market valuation (e.g., Morck,
Shleifer, and Vishny, 1988). This body of literature as a whole does document a relation between
This paper is hased on my dissertation at the University of North Carolina at Chapel Hill. I would like lo thank the
members of my dissertation committee for their valuable guidance and support: Douglas Shackelford (chair), Jennifer
Conrad. Mark Lang. Ed Maydew. and Jana Raedy. I ahn appreciate helpful comments from Courtney Edwards. Jim
trving, Sudarshan Jayaraman. Christine Petniviti. and an anonymous referee. I am grateful to Upper. Inc. for providing
capital gain distribution data and to Kunal Kapoor. Director of Fund Analysis at Morningstar. Inc., for .several helpful
discussions.
'Allison Evans is an Assistant Professor of Accounting at Wake Forest University in Winston-Salem, NC.
Financial Management • Autumn 2008 • pages 513 - 534
2. 514 Financial Management • Autumn 2008
ownership and performance in the corporate setting, although that relation is not necessarily a
straightforward one. '
With the exception of concurrent research by Khorana. Servaes, and Wedge (2006. hereafter
KSW). similar examinations ofthe relation between a manager's share ownership and perfor-
mance have not been attempted in the mutual fund arena prior to 2007 because managerial fund
ownership data have only been available since 2005. Furthermore, since mutual fund managers
are not required to own fund shares, many researchers have assumed that their investment is
small. Jin (2006), for instance, assumes that since mutual fund managers are not generally re-
quired to own shares in their fund, they have little incentive to care aboutfiandtax consequences.
This statement implies that the lack of an explicit requirement to own fiind shares is equiv-
alent to managers not making material investments in their fiind. This assumption, although
common, is contrary to the findings in this study. Ofthe 237 domestic equity mutual fund port-
folios in my sample, 22% have managers who have personally invested over $1,000,000 in their
fund.
In addition to being a vehicle to extend the agency literature, mutual funds are important in
their own right. Mutual funds are playing an increasingly large role in domestic equity markets,
as documented by the Investment Company Institute (2005, hereafter ICI). The ICI reports that
the mutual fiind industry managed $8.1 trillion and held approximately 22% ofthe outstanding
stock of US companies in 2004. At the same time, regulators and fund investors are increasing
their focus on the trading behavior of fiind managers after the revelation of several recent trading
abuses. This increased scrutiny culminated in the Securities and Exchange Commission's (SEC)
new regulation that requires mutual funds to disclose managerial ownership levels, compensation
structure, and conflicts of interest.^ Any empirical documentationof factors that might influence
the trading decisions of mutual fiind managers will benefit industry regulators, as well as current
and potential fund investors.
The paper is organized as follows. Section I develops the hypotheses. Section II describes the
data and sample selection process. Section III describes the empirical specifications. Sections IV
and V present the resuhs fi"om univariate and multivariate tests, respectively. Section VI
concludes.
t. Hypothesis Development
There are multiple factors that could influence the governance of mutual fiinds. Two pri-
mary govemance mechanisms are specified in Fama and Jensen (1983). One such factor is the
existence of the fund's board of directors (BOD). The BOD is responsible for matters such
as setting loads and fees, appointing committees, approving mergers, and approving general
investment objectives. Several papers study how the structure of the BOD (e.g.. size and in-
dependence) affects those items under the board's control (e.g., Tufano and Sevick. 1997;
Meschke, 2005; Qian, 2005; Khorana, Servaes, and Wedge, 2006). However, it is the fijnd
'Some studies (e.g., Morck, Shleifer, and Vishny. 1988; Stulz, 1988; McCotinell and Servaes. 1990) find that prof-
itability is positively correlated with ownership in the cotT>orate setting up to a certain point, after which entrench-
ment issues may actually erode profitability, creating an inverted U-shaped relation between owtiership and profitabil-
ity. Coles, Meschke, and Lemmon (2008) find support for this relatioti, although their paper sets forth endogeneity
concerns.
'US Securities and Exchange Commission, 2004, Final Rule: Disclosure Regarding Portfolio Managers of Registered
Management Investment Companies, 17 Code of Federal Regulation Parts 239, 249, 270, 274. US Government Printing
Office, Washington, DC.
3. Evans » Portfolio Manager Ownership and Mutual Fund Performance 515
manager per se who directly affects the day-to-day trading decisions of the fund, not the
Although Fama and Jensen (1983) specify this potential role the BOD could play in fund
governance, their study acknowledges that this mechanism is relatively weak in the mutual fund
setting. A more influential form of govemance lies in the hands of fund investors themselves.
Since fund shareholders are able to withdraw their investment at any time at the fund's full net
asset value (NAV), they have substantial control over the fund. Any shareholder who feels the
fund is underpertbrming may, on demand, withdraw the full market value of all shares owned.
Such withdrawals could generate significant negative effects on the income of the fund and of
the fund manager. Thus, portfolio managers have an incentive to act in a manner that will please
fund investors and thereby minimize investor flight.
Whether managerial fund ownership is associated with performance in the mutual fund setting
is an empirical question. Such a result should obtain to the extent that fund ownership alle-
viates an incentive conflict between the manager and fund investors. Dow and Gorton (1997)
model one such conflict, where a manager who actively searches for profitable trading oppor-
tunities and finds none will still execute trades, although such trades might actually decrease
fund value. This action results from incentives embedded in the manager's compensation con-
tract, formulated based on the inability for outsiders to distinguish informed nontrading from a
manager who shirks responsibilities or has no talent to pick good stocks. Thus, Dow and Gorton
posit that a manager's compensation creates incentives to make trades, even those that reduce
value.
Although their compensation is based primarily on net assets under management, many fund
managers also have at least a portion of their compensation (typically the annual bonus) tied
to fund retums. In theory, this compensation structure should help align the desires of fund
shareholders (higher returns) with the incentives of fund managers (personal wealth). Only
10% of the 237 fund portfolios in this sample disclosed that compensation is not tied to
fund performance in some way. If this compensation structure is enough to alleviate any ex-
isting agency issues, then fund ownership need not be associated with better fund returns.
If, however, the compensation structure does not fully alleviate an agency problem between
managers and shareholders, then I would expect fund retums to be positively associated with
the degree of managerial ownership. The SEC's stated motivation for enacting this disclo-
sure requirement, to "help investors assess the extent to which portfolio manager's interests
are aligned with theirs," implies that current compensation arrangements have not alleviated
regulator concerns about potential agency problems in the mutual fund industry. My first hypoth-
esis, stated in alternative form, is that managerial fund ownership is positively related to fund
returns.
In a related test, I also examine whether lower levels of managerial ownership are associated
with higher levels of fund turnover, my second hypothesis. Finding an inverse relation between
fund manager ownership and turnover would support the Dow and Gorton ( 1997) theory that one
incentive conflict between managers and shareholders lies in fund turnover. Aligning incentives
between the two parties should help offset the incentive of managers to make trades purely for
the sake of making trades, regardless of the potentially negative effect on fund value. Lower
turnover levels could also help reduce the fund's tax burden as well as administrative costs
(brokerage commissions and trading expenses) associated with each sale. Managers who, as fund
shareholders, would personally feel the effects of these costs (through lower fund returns) would
'Khorana, Servaes, and Wedge (2006) include three measures of board effectiveness in their tests andfindno robust
relation between those measures and fund performance.
4. 516 Financial Management • Autumn 2008
have greater incentive to minimize them.'' I will interpret a negative relation between ownership
and fund tumover as a reduction of agency costs in the mutual fund setting.
A manager's incentives can often diverge from the desires of investors with respect to the fund's
tax burden. By trading shares held within the ftind's stock portfolio, the fund manager triggers
capital gains or losses. The SEC requires mutual funds to distribute net gains to fund shareholders
each year.^ While all investors would favor a higher pretax retum, only taxable investors are
interested in the potential tax burden associated with fund distributions. Several papers (Huddart
and Narayanan, 2002; Weiss, 2002; Jin, 2006) cite conversations with fund managers who assert
that taxes do not greatly affect trading behavior since shareholders vary in tax status and have
different (often unobservable) marginal tax rates. Yet empirical studies (Dickson and Shoven,
1995; Bergstresser and Poterba, 2002) find evidence of significant heterogeneity in the tax
liabilities associated with different mutual fund investments. This paper is the first to consider
one possible explanation; the manager's personal stake in the fund.
It would require either an influential, tax-sensitive clientele or a personal incentive for a fund
manager to incorporate the potential tax burden of distributions into selling decisions. A fund
manager's compensation is rarely tied to a fund's tax burden (only one of the sample funds
does so), meaning that compensation does not provide a direct link between the fund's tax
burden and thefiandmanager's incentives.*" Personal ownership by the manager would align that
individual's incentives with those of taxable individuals, regardless of whether they are the fund's
primary clientele. However, even a manager with a strong personal desire to minimize taxes on
distributions should not alter selling behavior if such a strategy would be contrary to the desires
of the fund's key investors. It is quite plausible that a fund's clientele would be indifferent to
taxes. The ICI (2005) estimates that 54% of 2004 mutual fund assets were held by tax-deferred or
tax-exempt accounts and 37% were held in taxable household accounts.^ Hypothesis three, stated
in altemative form, is that fund manager ownership is inversely related to a fund's potential tax
burden. Such a relation wouid only be hypothesized to the extent that fund managers hold their
shares in taxable accounts.
Concurrent research by KSW also test the relation between mutual fund manager ownership
and ñind performance. Although the sample construction is different between this paper and
KSW, both studies find a positive relation between managerial ownership and fund retums. The
current work exclusively explores sole-managed domestic equity mutual funds. The KSW sample
is broader in that it examines sole- and multimanager funds and includes a wider selection of funds
(e.g.. bond funds). However, KSW find that the performance-ownership relation is strongest in
sole-managed domestic equity funds (i.e., the setting that is used in this paper). Furthermore, my
work explicitly ties both returns and tumover tests to existing financial theory (Dow and Gorton,
1997).
Other differences exist between KSW and this paper. For instance, KSW examine BOD's
characteristics in their analysis, while the work presented here excludes or controls for items that
^Trading expenses are charged directly against the fund's assets, thus reducing NAV, the price at which fund shares are
sold.
*To qualify as a flow-through entity, a fund must distribute at least 90% of its eamings to investors. After the Tax Reform
Act of 1986, a fund must also distribute at least 98% of its realized capital gains net income, or be subject to an excise
tax on the remaining undistributed portion.
"^Bergstresser and Poterba (2002} find that funds with a lower after-tax retum (a heavier tax burden) have lower subsequent
inflows, which could lower fund net assets and, in turn, compensation.
^Household accounts can either be taxable (held directly by the individual(s)) or tax-deferred (held in a retirement
account). Distributions received by a tax-deferred household account are not taxed until withdrawals arc made from the
account, at the ordinary tax rates in place at the time of withdrawal.
5. Evans * Portfolio Manager Ownership and Mutual Fund Performance 517
were set by the board, since such items do not reflect what falls under the manager's control. One
important area the KSW paper does not address is whether a fund's tax burden will vary based on
managerial investment. I address this question by examining both after-tax returns and multiple
measures ofthe fund's tax burden. The current research pertains to the wide range of investors
who hold any taxable (i.e., nonretirement) account.
II. Data and Sample
A. Ownership Data
Effective October 1, 2004, the SEC enacted a new federal rule requiring that mutual funds
disclose certain items of information regarding their portfolio managers. In any prospectus
released on or after February 28, 2005, funds must identify each portfolio manager {or team of
managers) responsible for the day-to-day management ofthe fund's portfolio. In its Statement
of Additional Information (SAI), the funds must disclose each portfolio manager's beneficial
ownership of securities in the fund. The firms do not need to disclose the exact dollar amount
of investment. Rather, they must disclose the portfolio manager's ownership stake as ofthe most
recent fiscal year-end within seven dollar ranges: none, $1-$ 10,000, $10.001-$50,000. $50,001-
$100,000. $100,001-$500.000. $500,001-$1,000.000, and over Sl.OOO.OOO.** Funds must also
disclose other managerial information in the SAi, including the structure of, and method used to
determine each portfolio manager's compensation. In addition, the SAI must include information
regarding other accounts managed by its portfolio managers, including any material conflicts of
interest. The Appendix presents a sample ofthe mandatory SAI disclosures.^
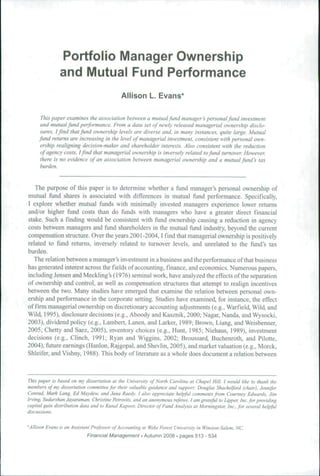
Figure 1 illustrates the disclosed ownership levels for the initial sample of portfolios. More than
two-thirds ofthe observations fall into three ofthe seven SEC-mandated ownership categories:
none (22%), SI00,001-$500,000 (24%), and over $1,000,000 (22%). For ease of exposition.
Figure 1 displays the remaining four categories with the three primary ownership levels to
illustrate, in essence, a low, medium, and high ownership level. Half of the sample portfolios
(49%) have managers owning $100,000 or less. As stated, nearly 24% have managers owning
between $100,000 and $500,000, while 28% have managers who have personally invested more
than $500,000.'" This figure reveals that ownership levels by fund managers are quite diverse
and can be substantial. Subsequent tests will examine whether ownership in the "low" category
is associated with a lower level of performance than being in the higher two categories.
B. Sample
For the purposes of this study, I obtain a list of sample funds and data for the fund characteristics
from Morningstar's Principia database. Following Bergstresser and Poterba (2002) and Plancich
(2003). 1 extract data for domestic equity funds from each January release of Principia and
merge them into one data set. Detailed long-term and short-term capital gain distribution data are
"These personal ownership disclosures conform to the disclosures required for members ofthe BOD.
•"The disclosure is from Kobren Insight Funds, a fund in this paper's final sample. Fund families with multiple portfolios
under management (e.g., Eaton Vance, Fidelity, and T. Rowe Price) often issue an SAI that reports data on multiple funds.
As such, those disclosures are considerably longer and more intricate.
'"Within the "low" group, there is no statistical difference between [he "none" funds and the funds with ownership between
$1 and $100,000 in any specification. I include the few funds that fall into the $500.001-$ 1.000,000 classification (6%)
in the high-ownership group (HIGH), though inferences are robust to reclassifying those funds into the mid-ownership
group.
6. 518 Financial Management • Autumn 2006
Figure!. Level of Mutual Fund Portfolio Manager Ownership
• $0-
$100,000
D $100,001-
$500,000
Dover
$500,000
provided by Lipper (a Reuter's company that is a global provider of mutual fiind information and
analysis).
I hand-collect data from each fimd's SAI to construct a measure of managerial ownership
for each fund in the sample. I only study funds with a single manager, which comprises nearly
one-half (47%) of all Morningstar funds at the end of 2004. My sample consists of funds that
issued ownership disclosures from the effective date ofthe SEC ruling (February 28, 2005) to
September 16, 2005. Over these six and one-half months, 1 collected data for 273 fund portfolios
of the types considered by this analysis (actively managed domestic grov/th, value, blend, or
specialty equity funds). ' ' Of those, I eliminate 36, since the manager data in the fund s SAI differ
from the manager information reported by Morningstar, leaving an initial sample of 237 fiind
portfolios.'^''^
III. Empirical Specification
A. General
This paper examines the relation between fund manager ownership and various measures of fund
performance (retums and costs). Equation (1) captures the relation between each performance
measure and managerial fund ownership:
"I exclude 13 tax-managed funds with ownership disclosures becau.se they are so few in number and because the
managers of those flinds may face a different incentive structure than managers of traditional funds. Another 13 portfolios
are excluded since their shares are restricted to itistitutional investors. Results are qualitatively unaltered when either of
these groups is included in the analyses.
'-The data discrepancies could take two forms. Either the manager's name in the SAI is differenl from the name in
Morningstar's database, or the SAI listed multiple managers, whereas Morningstar listed a sole manager
'^The mean (median) NAV for 2004 funds identified as having one manager is S17.62 ($13.99) versus $20.35 ($16.64)
for sample funds. The mean (median) NAV for the universe of Momingstar funds is S17.78 ($ 13.75 ). The curTent sample
has a significantly larger NAV (at the 1% level) than both of these samples.
7. Evans • Portfolio Manager Ownership and Mutual Fund Performance 519
PERFu = a, + ßx LOWi + ß.Xu + £„. (1)
The variahle PERF takes on each individual performance measure, in turn, for ftind / in year /.
For the purposes ofthe statistical tests, I include a LOW variable, which takes on the value I if
the manager owns $100,000 or less in the fund and 0 otherwise. This variable construction will
indicate whether managers with a minimal ownership level have statistically different performance
levels than managers who own more. The ideal ownership variable would be tbe manager's
ownership as a percentage ofthat individual's net worth; unfortunately, such data are unavailable.
Another potential ownership variable is ownership as a percentage ofthe fund's net assets. The
resulting ownership percentages are extremely small, using either the lower bound or endpoint
of each range to estimate fund ownership (with the exception of the "over $1,000,000" category
in which the lower bound is always used). The median ftind has a managerial ownership level of
0.000% using either estimation technique. The 75th percentile has a manager holding 0.002%
(0.003%) of the fund's net assets, using the lower bound (midpoint) of the range. The 90th
percentile has a manager holding 0.001% (0.014%), respectively.
The variable X^ represents the set of covariates that could also affect a ftind's performance. In
each test, I only use data representing years that the current manager is at the fund. Consequently,
I delete any fund-year observations that fall during the sample period but before the current
manager's tenure. I cluster the error term in each estimation by fund portfolio, since the same
ftmd may be in tbe sample multiple years. '"^
B. Ownership Measure
Funds disclose their manager's personal investment at tbe portfolio level. However, if the fund
has multiple share classes, the SEC does not require the fund to disclose in which share class(es)
a manager has made an investment. The Eaton Vance Growth Fund, for instance, has class A
shares (ticker symbol EVGFX), class B shares (EMGFX), and class C shares (ECGFX). Eaton
Vance disclosed that Arieh Coll. the Growth Fund portfolio manager, owned between $500,001
and $1,000,000 in the portfolio as ofthe most recent fiscal year end. However, the disclosure
does not detail whether the investment is in class A, B, or C shares (or some in all three).
Share classes do not represent fundamentally different investments. They simply represent
different means of entry into the same underlying set of stocks (e.g., whether a fee is charged
upon an investor's entry or exitft-omthe ftind). Ofthe 237 sample portfolios, 59% have multiple
share classes. Momingstar treats each share class of a fund as a separate ftind, as do many mutual
fund analyses. However, most fund characteristics are the same portfolio-wide (e.g., turnover,
per-share distributions, and market capitalization) and thus are reported as the same for every
share class.'^ Annual returns can also be the same between share classes, or only vary slightly
as a result of differences in expenses between classes. To avoid counting the same observation
multiple times, all analyses consider only the largest share class of a multiclass portfolio.
Ownership data have only been available since February 28, 2005 and are only disclosed for
the fund's most recent fiscal year-end, so I assume each manager's investment is the same across
all years of this study (2001 -2004). '^ It is possible that managers increased their ownership levels
'^SeePetersen (2005) fora discussion ofcrror-term clustering and entity fixed effects.
"Net assets vary betweeti share classes, as do expenses, sales loads, and Momingstar's calculation of capital gains
overhang.
'"I re-estimate this paper's tesis over shorter time periods to reduce the number of years in which I assume the managers'
ownership is the same as for the most recent (and only) disclosure. Results are robust to shortening the time frame to
2003-2004. Using only 2004 as a sample period substantially reduces the .sample size. Although the trends found in
subsequent tests are still present using just 2004 data, the results lose significance in thai specification.
8. 520 Financial Management • Autumn 2008
immediately preceding the disclosure requirement. In that instance, my assumption would bias
against finding significant differences in fund performance based on ownership. I should also
emphasize that, for a fund to be in this paper's sample, it must have been in existence in 2005, the
year the disclosure requirement took effect. Any fund that did not survive until 2005 would not
have released ownership information and could not be included in this study.
C. Fund Returns
In this section, 1 study the relation between a fund's retums (adjusted for the mean return for
the fund's style category) and managerial ownership. The first dependent variable, ANNRTN,
is the difference between the ftind's simple pretax annual retum, as computed by Momingstar,
and the mean return for all Momingstar funds within the same fund-style category (i.e., large-cap
value, mid-cap growth) in a given year.'^ I also examine two after-tax return measures: annual
returns after taxes on distributions, and after taxes on distributions and the sale of fund shares.
The SEC, since 2001, requires funds to present both after-tax retums numbers, setting forth a
common formula for funds to use to compute each measure.'" Only taxable investors would
be subject to the fund's tax costs. Each retum measure is presented and analyzed before sales
loads.'^
Morningstar reports retums after adjusting for fund expenses, which are taken directly out of
each fund's assets.^" A portion of those costs are captured by the fund's expense ratio and do not
reflect any decision made by the fund manager. I consequently include the fund's expense ratio
as an independent variable to control for the portion of net retums that are out ofthe manager's
control. Other costs, which are not included in the expense ratio but which also decrease fund
returns (brokerage commissions and transaction costs), are directly related to the amount of trades
the fund manager executes.
1 include additional covariates tbat could be associated with a fund's returns. To account for
a fund's systematic risk, I include BETA as a control variable. I add LAGINFLOWS to proxy
for a fund's need to sell additional shares to meet shareholder redemptions.'' Such liquidations
likely took place over this time period, as mean inflows for sample funds were negative in 2001
and 2002.^^ I also include an indicator variable to represent funds with a first-year manager
{NEWMGR), since new managers often make portfolio changes when they take over a fund
"The fund-style categories are defined by Momingstar, based on analysis of each fund's trading behavior, rather than the
fund's self-reported investment style.
'"The calculations assume that distributions are received by individual shareholders in the top statutory tax bracket and
thus represent an upper bound on the tax on distributions. The formula for the tax on sale assumes a ftind shareholder
exits the fund at the end ofthe year and thus incorporates any unrealized gain or loss on fund shares. Funds calculate that
tax burden based on a hypothetical shareholder with a $1,000 initial investment.
'''The return figures disclosed in ftjnd prospectuses are reported after incorporating the maximum sales load ofthe fund.
However, these sales charges are not set by the fund manager and have consequenlty been removed from the current
analysis. When sales loads are incorporated, the difterences between mean returns based on ownership are magnified.
implying that sales loads are lower for funds with higher levels of ownership. Untabulated univariate statistics support
this implication. The mean total sales load for the low-ownership funds is 2.4%, while it is only 0,64% for the highest
ownership group, a difference that is significant at the 1% level.
™Those expenses include management, administrative, and t2-bl (marketing) fees.
^'The focus of this paper is on the manager's behavior when buying and selling stocks held within the fund. However, it
is possible for fund shareholders to sell their fund shares, which funds are required to repurchase. If a fund docs nol have
enough cash to meet redemptions, it may have to sell some of its stock. Negative inflows mean redemptions exceed new
stock purchases within a fund. Inflows are calculated following Bergstresser and Poterba (2002). Inflows = [Total Net
Assets,/Total Net Assets,_, -(NAV, + DIV, + GA¡NS,)INAV,.,]I{I -I- ANNRTNJl).
^^The ICI (2005) also estimates that net new cash flow for equity funds was negative in 2002.
9. Evans ' Portfolio Manager Ownership and Mutual Fund Performance 521
(Scherbina and Jin, 2006). BOND, the percentage of fund assets that is invested in bonds, is a
covariate since stocks and bonds exhibit different patterns of retums. AGE., the age ofthe fund
in years, is included to capture any systematic differences between older and younger funds.
TENURE is included since the degree of the agency problem may be enhanced for seasoned
managers wbo are nearing retirement (Chevalier and Ellison, 1999). The natural log ofthe net
assets ofthe fund family (FFAMNETA) also serve as a control variable, since funds belonging to
larger fund families may have higher performance (Chen, Hong, Huang, and Kubik, 2004). I add
year and fund-style indicators (e.g., large-cap value, mid-cap growth) to capture time differences
and differences between mean fund returns based on investment objectives.
Controls for the after-tax specifications are largely the same as for the pretax retums specifi-
cations. I also include a control variable representing the one-year lag ofthe fund's capital gains
overhang {percentage of net assets that represent appreciation). Prior research (Barclay, Pearson.,
and Weisbach, 1998; Bergstresser and Poterba, 2002) finds evidence consistent with the level of
appreciation witbin a fund influencing a manager's selling decisions.
D. Fund Turnover
In this section, 1 analyze whether higher levels of fund ownership are associated with differences
in the frequency of a fund's trades. An inverse relation would be consistent with the Dow and
Gorton (1997) theory that managerial compensation encourages noise trading, even when no
value-enhancing trades are found. If managerial ownership reduces this agency problem, then
higher share ownership by mutual fund managers should result in lower levels of share turnover.
Minimally invested managers, however, would have no such incentive to minimize turnover-
related costs. Low turnover helps minimize selling expenses (brokerage and transaction costs)
and potentially a fund's tax burden, since fewer sales may decrease the capital gains or losses a
fund would trigger In fact, after avoiding net taxable gains altogether. AllianceBernstein (2004)
lists low turnover as the next-best way for managers to minimize the potential tax burden on
mutual fund distributions. Both transaction and tax costs reduce a shareholder's return on a
mutual ftind investment.
The variable TURN, a fund's turnover ratio, can be interpreted as the percentage ofthe portfolio's
holdings that have changed over the past year. A low tumover (e.g., 20%-30%) would indicate a
buy-and-hold strategy, whereas a high turnover (e.g., over 100%) indicates an investment strategy
involving considerable buying and selling of securities. To address the possibility that turnover
is a proxy for ftind style, I again use the mean ratio for the fund's style category as a benchmark.
The resulting TURN variable represents the mean-adjusted turnover volume relative to the mean
for the fund's peer group. As in all previous tests, the fund's investment style is classified by
Morningstar, based on its analysis ofthe fund's trading behavior
I include INFLOWS as a covariate, since ftinds with low or negative net inflows may bave
to sell additional stock to meet shareholder redemptions. I add a fund's current and lagged
retums to control for the fact that managers might sell shares to lock-in gains or rebalance
their portfolios following market upswings. I also add a one-year lag ofthe fund's capital gains
overhang (LAGCGOH), since the level of unrealized gains could influence a manager"s selling
decisions. I include NEWMGR because a new manager may make more sales to rebalance the
fund's portfolio. AGE is included since newer funds may have increased trading needs until tbey
are more established, and TENURE captures differences in the agency problem between younger
and older managers. Year and fund-style indicators also serve as covariates, consistent with prior
specifications.
10. 522 Financial Management • Autumn 2008
E. Fund Tax Costs
Finally, I examine the association between a manager's ownership in the fund and the tax burden
ofthat fund. I use several different measures designed to capture different aspects of a fund's
tax sensitivity. Consistent with prior tests, each measure represents the difference between the
fund's tax measure and the average for the same fund-style category. The first construct of a
manager's sensitivity to taxes on fund distributions is LTTOT, the percentage of total gains paid
out as long-term gains. Plancich (2003) uses LTTOT to test whether mutual funds shifted more
toward long-term gains after the Tax Reform Act of 1997 reduced the capital gains tax rate from
a maximum of 28% to 20%. She finds evidence consistent with such a shift. The quantity LTTOT
represents a fund's sensitivity to individual tax incentives, because in all years of this study, short-
term capital gains are taxed at a higher rate than long-term gains.^^ Since most dividends are now
also taxed at a 15% tax rate, short-term capital gains are currently the most tax-disadvantageous
form of mutual fund distribution.
Although favoring long-term gains would decrease a taxable individual's tax burden, a better
measure of tax-sensitivity may be whether funds distribute gains at all. AllianceBemstein (2004)
lists avoiding short-term capital gains and offsetting realized capital gains with capital losses as
the primary tax-management techniques for muUial fiind managers. Dickson, Shoven, and Sialm
(2000) find that active realization of capital losses has a significant effect on after-tax returns
for actively managed funds. Specifically, instead of distributing capital gains realized within the
fund, the manager could offset those gains with fund losses.^'' To see whether higher ownership
is associated with this tax-sensitivity measure, PCTGA/N, the per share dollars of gains paid out
as a percentage of each share's net asset value, is used as a dependent variable.
The final tax-cost measure, FCTTAX, captures the effects of dividend, short-term gain, and
long-term gain distributions. PCTTAX represents the maximum per share tax burden a taxable
individual would face on all fund distributions as a percentage of tbe fund's net asset value,
relative to the average for funds in the same category.^- If managers with larger personal fund
investments want to minimize their current tax bill, PCTGAIN and PCTTAX should decrease
with fund ownership. However, it is possible that desires of a tax-insensitive clientele would
outweigh the manager's personal tax situation, or that the managers themselves would hold their
fund investments primarily in tax-deferred accounts.
I include INFLOW, since negative cash inflows could prompt the fund manager to increase
stock sales to meet redemptions. The variable NETA., the natural log of a fund's total net assets, is
included to control for scale effects. I add LAGCGOH, since the fund's level of unrealized gains
may affect a manager's decisions, consistent with prior specifications, and I include NEWMGR,
since a first-year manager might make more stock sales to rebalance the portfolio, increasing
the potential tax burden ofthe fund. The quantities AGE and TENURE are covariates to capture
^^ Another disadvantage of short-tenn gains is that they become classified as ordinary income on an individual's lax retum,
meaning that the investor cannot utilize that distribution to ofFset any capital losses. An individual's capital losses can be
offset by capital gains, then up to $3.000 of ordinary income. Any remaining capital losses must be carried forward for
use in fiiture years.
'•"A ftind cannot distribute the losses it generates. However, it may use those losses to offset gains within a portfolio for
up to eight future years.
ïiPCTTAX = {{Itcg X /„) -f {stcg X f,,) 4- {div x tj))INAV. The tax rate on long-term capital gains (/„) is 20% in the
years before the enactment ofthe 2003 JGTRRA and 15% thereafter. The tax rate on short-term gains (f,,) is set equal
to the maximum ordinary tax rate, and thus represents an upper bound on the potential tax burden from short-term gain
distributions. The dividend tax rate (fj) is equal to the maximum ordinary tax rate in all years before the Jobs and Growth
Tax Relief Reconciliation Act, and 15% in 2003 and 2004. The variables Itcg, stcg, and div represent long-term capital
gains, short-term capital gains, and dividends, respectively.
11. Evans » Portfolio Manager Ownership and Mutual Fund Performance 523
differences in trading activity based on the establishment of the fund or the manager's agency
issue relative to career stage, i also include year and fund-style indicators to control for time and
investment objective differences. Finally, PCTGAIN is a regressor in the LTTOT specification to
control for the amount of gains distributed, following Plancich (2003).
IV. Univariate Results
A. Dependent Variables
Panel A of Table I presents the mean, median, and standard deviation of each performance
measure that I use as a dependent variable (returns, turnover, and tax costs, respectively), by
the binary ownership variable {LOW). Before deletions due to missing values, the initial sample
consists of 812 fund-year observations ( 136 observations for the cumulative four-year return test).
Table I also shows the value ofthe difference in the variable means between the two ownership
groups, and presents /-values denoting the statistical significance ofthat difference. Fund retums,
however defined, are positively related to ownership. Funds with minimally invested managers
have significantly lower mean-adjusted returns than fiinds with more highly invested managers, at
the 1 % leve!. Mean-adjusted after-tax retums are also significantly lower for LOW funds (after-tax
returns on distributions is significant at the 1% level, while after-tax returns on distributions and
the sale of fund shares is significant at the 5% level). Overall, these results lend initial support
to the hypothesis that both pretax and after-tax retums are lower for ftinds with the low levels of
managerial investment.
Panel A also illustrates that funds with minimally invested managers have a significantly
higher level of costly mean-adjusted fimd turnover (at the 1% level). This relation is consistent
with the reduction of an agency cost that often results in an inflated level of executed trades, as
well as the minimization of selling expenses and/or tax costs, which also have a negative effect
on shareholder retums. The tax-cost statistics in Panel A provide initial evidence of whether
funds with minimally invested managers have a higher tax burden, which would be consistent
with the finding that those funds appear to have higher levels of fund tumover. However, the
univariate results do not clearly support this implication. A tax-sensitivity hypothesis would bave
predicted that LTTOT means would increase with increasing managerial ownership, since tax-
sensitive funds would favor long-term capital gains. The LTTOT mean is actually higher for the
LOW group, although the difference is not significant. Similarly, the mean PCTGAIN is lowest
for the low-ownership group, which is also inconsistent with more highly invested managers
attempting to minimize the current-year tax burden. However, there is a significant difference
in tbe percentage of NAV that represents the total tax on distributions in a direction predicted
by tax sensitivity. The quantity PCTT.AX is significantly higher, at the 5% level, for funds with
minimally invested managers. In sum. univariate tax cost results do not clearly support a negative
relation between ownership and the fund's current tax burden.
B. Control Variables
Panel B of Table I presents univariate statistics for the control variables. It illustrates that there
are significant diñerences between funds with different managerial investment levels. Both net
assets and capital gains overhang (the percentage of net assets representing capital appreciation)
are increasing with ownership, with differences between groups significant at the 1% level.
The fund's expense ratio, capturing costs outside the fund manager's control, is significantly
decreasing in managerial ownership, consistent with managers choosing to invest in funds with
12. 524 Financial Management • Autumn 2008
Table I. Descriptive Statistics by Level of Managerial Ownership
The number of observations is 812 before missing-data deletions (136 for the 4YR retum variable). All
variables are in excess of the fund-style mean. Variable definitions: LOW = 1 if manager owns $0-
$100,000 in the fund, 0 otherwise; Difference = the excess value ofthe variable mean for LOW = 0 over
lOlV = 1; ANNRTN - fund's percentage annual return: ANNUALIZED 4YR RTN = ftind's cumulative
return annualized over a four-year period computed by Morningstar methodology; /íF7"7>íA'AriV-Distrib
(Distrib & Sale) = fund's percentage annual return including tax burden from distributions (and assuming
shareholder exits fund at year-end), calculated per SEC regulations); TURN = fund's turnover ratio; LTTOT =
ratio of a fund's long-term to tota! capital gain; PCTGAIN — percentage of a fund's net asset value paid out
as capital gains; PCTT4X = per-share maximum tax burden on distribution as a percentage of a fund's net
asset value. A i-test denotes the significance of the difference in means between LOW = 1 and LOW = 0
using a two-tailed test.
Panel A. Mean-Adjusted Fund Performance
L0tV=1 LOW = Difference (f-Value)
ANNRTN
Mean -0.41 2.2 2..6*"
Median -0.54 1.0 (3..79)
SD 8.8 10.3
ANNUALIZED 4YR RTN
Mean 0.44 2.7 2..3"*
Median 0.03 1.8 (3..94)
SD 6.4 7.5
AFTTAX RTN-Distnb
Mean 0.05 2.7 2.. 7 ' "
Median -0.24 1.3 (3,.70)
SD 9.4 10.8
AFTTAX RTN-Distnh & Sale
Mean 0.41 1.5 1,, 1 "
Median 0.14 0.63 (2.36)
SD 6.2 7.3
TURN
Mean 10.9 -52.8 -63.:
Median -33.0 -59.6 i.27)
SD 192.8 71.1
LTTOT
Mean 0.087 0.060 -0.027
Median 0.17 0.14 (-0.64)
SD 0.30 0.31
PCTGAIN
Mean 0.0014 0.0006 0.008
Median -0.0039 -0.0039 (0.35)
SD 0.03 0.03
PCTTAX
Mean 0.0013 -0.00016 -0.0014**
Median -0.00092 -0.0010 (-2.34)
SD 0.01 O.OI
13. Evans • Portfolio Manager Ownership and Mutual Fund Performance 525
Table I. Descriptive Statistics by Level of Managerial Ownership {Continued)
The number of observations is 812 before missing-data deletions. A /-test denotes the significance ofthe
difference in means between LOU' = 1 and LOW = 0. Variable definitions: LOW = I if manager owns
$0-$ 100,000 in the fund, 0 otherwise; Differenee = the excess value ofthe variable mean for LOW = 0
over LOW = ; ANNRTN — fund's percentage annual return; CGOH = percentage ofthe fund's assets that
represent capital appreciation; EXPRATIO = fund's expense ratio; NETA = the fund's total net assets, in
millions; FFAMNETA = the ftind family's total net assets, in millions; BETA — the fund's systematic risk as
reported by Morningstar; BOND = percentage of fund assets invested In bonds; .4GE = fund age in years;
INFLOW = net inflows weighted by beginning net asset value; TENURE = length of time managing the
fund, in years; L/M/S GROW/VALUE/BLEND = 1 if the fund is a largc/mediunVsmall growtli/value/blend
fund, and 0 otherwise; SPECIALTY = 1 if the fund is a specialty ftmd, and 0 otherwise; NEWMGR = 1 if
the manager is in his first year, and 0 otherwise.
Panel B. Control Variables
LOW^O Difference (r-Vaiue)
Continuous Variables
CGOH
Mean -20.8 -0.16 20.6'"
Median -1.0 13.0 (3.44)
SD 101 59.1
EXPRATIO
Mean 1.6 1.3 -0.30'*'
Median 1.5 1.3 (-7.28)
SD 0.71 0.45
NETA
Mean 306 1.278 972*"
Median 100 293 (7.II)
SD 612 2.524
FFAMNETA
Mean 23.213 31.921 8. 708'
Median 6.871 6,804 (1.78)
SD 56. 782 77. 525
BETA
Mean 1.4 1.9 0.50
Median 0.89 0.90 (0.69)
SD 6.4 8.7
BOND
Mean 0.83 0.55 -0.28
Median 0 0 (-1.29)
SD 3.6 2.5
AGE
Mean 11.2 15.6 4.4'"
Median 7.4 11.2 (4.74)
SD 12.8 13.9
INFLOW
Mean 0.56 0.44 -0.12
Median 0.16 0.19 (-0.02)
SD 1.7 77.4
14. 526 Financial Management • Autumn 2008
Tabie i. Descriptive Statistics by Level of Manageriai Ownership {Continued)
Panel B. Control Variables (Continued)
L
.OW = 1 LOW = 0 Difference (r-Vaiue)
TENURE
Mean 4.6 7.2 2.6"'
Median 3.7 5.56 (6.98)
SD 4.4 6.0
Discrete Variables
LGROW 14.8% 10.9% -3.9%-
(-1.66)
MGROW 13.7% 13.8% 0.1%
(0.04)
SGROW 14.6% 8.7% - 5.9%**'
(-2.63)
LVALUE 5.8% 11.4% 5.6%'"
(2.81)
MVALUE 2.5% 4.9% 2.4%'
(1.80)
SVALUE 5.2% 5.4% 0.2%
(0,09)
3%
LBLEND 15.1% 18.1%
(1.13)
3%
MBLEND 6.6% 9.6%
(1.55)
4%*"
SBLEND 1.1% 5.1%
(3.21)
-8.5%—
SPECIALTY 20.6% 12.1%
(-3.33)
0%
100% 100%
NEWMGR 12% 6% -6%"*
(-3.06)
No. observations 448 364
Percentage of all observations 55% 45%
" • SignifÈcant al the 0.01 level.
" Significant at the 0.05 level.
' Significant at the 0.10 level.
lower expenses. Fund age and manager tenure are also significantly lower for managers with a
low level of personal investment. These findings are consistent with managers amassing more
investment over time. Similarly, managers in their first year (NEWMGR) are more likely to have
little to no fund investment. There are also some differences in the types of fund represented by
LOW funds. Most notably, significantly more LOW funds are specialty funds. Overall. Table I
illustrates that there are significant differences in the univariate statistics for both the primary
and control variables.^''
^*'Of the !0% of funds that disclose that fund manager compensation is not tied to fund performance. 59% are LOW funds.
However, this estimate is based on a very small number of funds and thus might not generalize to all such funds.
15. Evans • Portfolio Manager Ownership and Mutual Fund Performance 527
V. Multivariate Results
A. Fund Returns
Table II presents the results for the regression of mean-adjusted returns on the dichotomous
ownership variable. Annual fund returns in excess of fund-style means are statistically lower,
at the 1% level, for funds where the fund manager has a low level of personal investment.•^•'
Economically speaking., this result indicates that funds where the manager owns $100,000 or
less generate excess annual returns that are approximately 2.6% lower than funds with managers
that own more than that amount. This finding is consistent with managerial investment aligning
decision maker and shareholder interests.^** The results are similar for the regression that uses
mean-adjusted returns after taxes on distributions. The after-tax retums are significantly lower,
at the 5% level, for funds with minimally invested managers. Results for the after-tax retums on
distribution and sate variable are in the predicted direction, but fall out ofthe range of statistical
significance. This variable assumes investors sell shares at year-end and thus is not as relevant for
long-term investors. In addition to fund investment style and year, which explain a large portion of
mutual fund's annual retums, prior-period inflows are negatively related to mean-adjusted retums
at the 5% level. This result is consistent with the difficulty of managing an increasing asset base.
B. Two-Stage Least Squares Estimation
Of concern in the foregoing analysis is the potential endogeneity of the ownership choice;
specifically, that low (high) fund returns could be causing low (high) managerial ownership.
To address this concem, I estimate a two-stage least squares (2SLS) regression, the results of
which are presented in Table III. The first stage is a logistic estimation in which I regress
the binary LOW variable on fund style, lagged mean-adjusted fund returns, and a measure of
manager compensation, since managers with higher income will have more to invest. Because
fiind managers are largely compensated based on net assets under management, I use total net
assets as the compensation proxy. The Pearson correlation coefficient between the dichotomous
LOW variable and total net assets is 0.70, which is significant at the 1% level. Total net assets
are uncorrelated with mean-adjusted returns (a Pearson correlation coefficient of 0.004) and thus
can be considered an appropriate instrument for the first stage.
Estimating 2SLS with this structure does not result in a change in inferences from the original
ordinary least-squares (OLS) estimation.'^'^ The coefficient on the predicted LOW value from
the first stage is significant at the 5% level. Thus, even after removing the effect of prior-period
retums on managerial ownership, personal investment is positively related to fund retums. This
result is consistent with higher managerial ownership leading to higher returns, rather than the
reverse. Alternatively stated, this result supports the idea that ownership reduces agency costs
*'Using ownership as a percentage of fund net assets as the independent variable does not yield significant results.
However, when Ihe returns analysis is estimated using a rank regression, the results are significant using the percentage
ownership variable (consistent with the LOW analysis) at the 5% level, using either the lower bound or midpoint of the
dollar range in the estimation of managerial ownership.
^''In a separate analysis, I examined whether cumulative retums are lower for low-ownership funds over a cumulative
four-year period. I used the subset of funds that were in existence and had complete data over the entire sample period.
While the resulting .sample is quile small (57 observations), the results are consistent with the tabulated returns analyses,
LOW ftinds had significantly lower cumulative retums than the other sample funds at the 1% significance level,
^'Although the primary endogeneity concem is between ownership and pretax returtis, 1 also estimate 2SLS using each
ofthe two after-tax retum figures. Inferences remain unchanged.
16. 528 Financial Management • Autumn 2008
Table II. Mean-Adjusted Fund Returns Regression Results
All dependent variables are in excess of the fiind-style mean. Variable definitions: ANNUAL RTN =
ftind's annual return percentage; ^F7T/lX/?7?V-Distrib (Distrib & Sale) = fund's percentage annual return
including tax burden from distributions (and assuming shareholder exits fund at year-end), calculated per
SEC regulations); LOW = I if the manager owns $0-$ 100,000 in the fund. 0 otherwise; LAGINFLOWS =
one-year lag of net inflows weighted by beginning net asset value; EXPRATIO = ftind's expense ratio;
BETA = fund's systematic risk, reported by Morningstar; BOND — percentage of fund assets invested in
bonds; AGE = fund age in years; TENURE = length of time managing the fund in years; NEWMGR — 1 if
tenure is less than one year, 0 otherwise; FFAMNETA = the natural log ofthe fund family's total net assets;
LAGCGOH — one-year lag ofthe percentage ofthe ftind's assets that represents capital appreciation.
ANNUAL AFTTAXRTN AFTTAXRTN
RTN (Distribution) (Distribution & Sale)
Coefficient Ir-Value Coefficient f-Value Coefficient i-Value
Intercept 2.67 0.94 3.98 1.33 1.58 0.77
LOW -3.14"* -2.63 -2.73** -2.10 -1.26 -1.45
LAGINFLOWS -0.018*' -2.46 -0.018*'* -2.65 -0.012*' -2.51
EXPRATIO -0.72 -0.87 -0.72 -0.78 -0.098 -0.15
BETA -0.014 -0.44 -0.014 -0.42 -0.0046 -0.19
BOND 0.14 1.38 0.12 0.90 0.021 0.26
AGE -0.0014 -0.06 -0.0031 -0.13 0.013 0.75
TENURE -0.071 -0.97 -0.017 -0.17 -0.0087 -0.12
NEWMGR -0.56 -0.38 -0.49 -0.34 0.10 O.IO
FFAMNETA 0:11 0.56 0.13 0.66 -0.029 -0.23
LAGCGOH - - -0.0029 -0.31 -0.0012 -0.18
No. observations 515 515 515
Year fixed effects? Yes Yes Yes
Fund-style indicators? Yes Yes Yes
Adjusted R^ 0.045 0.048 0.037
*" Significant at the 0.01 level
" Significant at the 0.05 level
in the mutual fund industry. In additioti to the SEC's motivation for enacting the new disclosure
requirements (to help investors to assess incentive alignment with managers), anecdotal evidetice
also supports the agency theory. Kunal Kapoor, Director of Fund Analysis at Morningstar, Inc.,
places mutual fund managers into two distinct categories: money managers and fiind shareholders.
This categorization reflects the opinion that personally invested fund managers likely possess
more conviction, taking more care in executing appropriate trades, than are money managers
who simply perform investing services in exchange for compensation. The results of this 2SLS
estimation are compatible with both the SEC's motivation for requiring the managerial ownership
disclosures and the opinion of leading analysts in the mutual fund industry.
C. Fund Turnover
Results from the turnover regression are reported in Table IV. Consistent with the univariate
results, mean-adjusted turnover levels are inversely related to fund ownership. Specifically, LOW
fiands have significantly higher excess tumover levels (approximately 61% higher) than the other
17. Evans • Portfolio Manager Ownership and Mutual Fund Performance 529
Table III. Two-Stage Least Squares Estimation
AU dependent variables are in excess ofthe fund-style mean. Variable definitions: LOW = 1 if the man-
ager owns $Q-$100.000 in the fund, 0 otherwise; NETA = the natural log ofthe fund's total net assets;
(LAG)ANNRTN = fund's (one-year lag of its) annual retum percentage; LOWPREDICT = predicted value
of LOW from the first stage ofthe 2SLS estimation; LAGINFLOWS = one-year lag of net inflows weighted
by beginning net asset value; EXPRATIO = fund's expense ratio; BETA — fund's systematic risk, reported by
Momingstar; BOND = percentage of fund assets invested in bonds; AGE = fund age in yeat^; TENURE =
length of time managing ihe fund, in years; NEWMGR = 1 if tenure is less than one year, 0 otherwise;
FFAMNETA = the natural log ofthe fund family's total net assets.
Dependent Variable = Dependent Variable =
LOW ANNRTN
Coefficient Wald Coefficient i-Value
Intercept 0.52" 4.16 6.78" 3.08
NETA -0,025"* 30.16
LAGANNRTN -0.030'" 15.25
LOWPREDICT 12.37*" -2.51
LAGINFLOWS -0.019"' -2.66
EXPRATIO -0.38 -0.96
BETA -0.018 -0.88
BOND 0.13 1.26
AGE -0.0095 -0.83
TENURE -0.038 -1.01
FFAMNETA -0.044 -0.13
NEWMGR -0.27 -0.33
No. observations 726 726
Year fixed effects? Yes Yes
Fund-style indicators? Yes Yes
Adjusted R^ 0.043
" * Significant at the O.OI level.
" Significant at the 0.05 leve!.
satnple futids.^" These results are consistent with personal fund ownership leading to a reduction
in a manager's incentive to inflate fund tumover in an effort to appear competent as a manager
and thereby increase compensation. Following Dow and Gorton (1997). decreasing the amount
of noise trading should also result in an increase of fiind retums, which conforms to the results
presented in Table II. Executing fewer trades reduces transaction costs and possibly decreases
the fund's tax burden. In addition, results from the control variables reveal that tumover is
negatively related to a fund's prior-year returns., as well as the one-year lag of the fund's capital
gains overhang, consistent with selling to lock in gains. Thus, the relation between managerial
ownership and both returns {a positive relation) and tumover (a negative relation) in this paper is
consistent with ownership reducing agency costs in the mutual fund setting.
D. Fund Tax Costs
Since the significance between ownership coefficients is somewhat less in the after-tax returns
specifications than in the pretax specification, one may conclude that the fund's tax burden might
•""Using ownership as a percentage of net assets yields significant results at the 5% level in the predicted relation (lower
tumover in funds with higher ownership percentages). This result persists using either the lower bound or midpoint ofthe
ownership ranges (lower bound only for the highest category) as a dollar estimate for managerial investment.
18. 530 Financial Management * Autumn 2008
Table IV. Mean-Adjusted Fund Turnover Regression Results
The dependent variable is the fund's turnover ratio in excess ofthe mean for the fund-style category. Variable
definitions: LOW ^ 1 if the manager owns $O-$IOO.OOO in the fund, 0 otherwise; INFLOWS ~ net inflows
weighted by beginning net asset value; NETA = the natural logofthe fund's total nel assets, LAGANNRTN =
fund's one-year lagged annual return percentage; NEWMGR = I if the manager is in his first year, and
0 otherwise; LAGCGOH = one-year lag of the percentage of the ftind's assets that represents capital
appreciation; AGE = fund age in years; TENURE = length of time managing the fund, in years.
Coefficient t-Value
Intercept -6.34 0.23
LOW 61.4"* 3.10
INFLOWS -0.0029 -0.17
NETA -2.74 -0.76
LAGANNRTN -1.18'" -2.61
NEWMGR 0.32 0.02
LAGCGOH ^0.29"* -2.76
AGE 0.17 0.44
TENURE -2.88" -2.06
No. observations 571
Year fixed effects? Yes
Fund-style indicators? Yes
Adjusted R^ 0.18
•" Significant at the 0.01 level.
" Significam at the 0.O5 level.
not be reduced as a result ofthe executioti of trades by a highly invested manager. However, those
funds with more substantially invested managers {LOW = 0) also have lower fund turnover, a
common strategy for tax minimization in mutual funds. As a direet test of whether the tax burden
is reduced in funds with highly invested managers, I analyze three tax-sensitivity measures:
LTTOT, PCTGAIN. and PCTTAX.
The results from these regressions are presented in Table V. The coefficient on LOW is not
significantly different from zero in two ofthe three specifications and is only weakly significant
in the third. Such results suggest that a fund manager's ownership and the fund's tax btirden have
no relation to one another. These findings are consistent with fund managers trading on behalf
of a tax-insensitive clientele, or a clientele of unknown tax status. They are also consistent with
the anecdotal claims that managers trade irrespective of the tax implications of their behavior.
The fact that funds managed by owners with more than a negligible investment do not appear to
tax-manage could also indicate that managers hold mutual fund shares in tax-deferred accounts,
although ownership disclosures are not required to denote in what kind of account(s) the manager
holds a personal investment.^' Thus, while certain research has shown that managers, as a whole,
engage in some degree of tax planning (Bhabra, Dhillon, and Ramirez, 1999; Gibson, Safieddine,
and Titman, 2000; Huddart and Narayanan, 2002; Plancich, 2003), the results of tbis analysis
do not support the hypothesis that managers with higher ownership engage in more tax planning
than do managers without a substantial personal fund investment.
^'Additionally, a portion ofthe managers' compensation could be direclly píaced into their retirement/tax-deferred
accounts, although none ofthe sample funds have disclosed whether this process has occurred. This treatment would also
reduce a manager's incentive to lower the tax burden ofthe fund.
19. Evans • Portfolio Manager Ownership and Mutual Fund Performance 531
Table V. Mean-Adjusted Fund Tax Costs Regression Results
All dependent variables are in excess ofthe fiind-style mean. Variable definitions: LTTOT = ratio of a
fund's long-tenn to total capital gain distributions; PCTGAIN = fund's per-share capital gain payout as a
percentage of NAV; PCTTAX = fund's per-sharc tax due by taxable investor as a percentage of NAV, LOW =
1 if the manager owns $0-$ 100.000 in Ihe fund, and 0 otherwise; INFLOWS = net inflows weighted by
beginning net asset value; NETA = the natural log of Ihe fund's total net assets; LAGCGOH - one-year lag
ofthe percentage ofthe fund's assets that represent capital appreciation; NEWMGR = I if the manager is in
his first year, and 0 othei^vise; {LAG)ANNRTN = fund's (one-year lagged) annual retutn percentage; AGE =
fund age in years; TENURE = length of time managing the fund, in years; PCTGAIN = percentage of a
net asset value paid out as capital gains.
LTTOT PCTGAIN PCTTAX
Coefficient f-Value Coefficient r-Value Coefficient r-Vaiue
Intercept -0.19* -1.81 -0.00093 -0.11 -0.0022 -1.36
LOW 0.28 0.57 0.0010 0.36 o.ooir 1.69
INFLOWS -0.00014 -1.31 -0.00OOI8* -1.72 -0.0000014 -0.65
NETA 0.0075 0.61 -0.00076 -0.74 -0.0000037 -0.02
LAGCGOH 0.0041" 2.45 0.000042" 2.23 0.0000043 !,28
NEWMGR 0.19"' 3.75 0.0057 I.4I 0.00026 0.33
ANNRTN -0.00067 -0.21 -0.000029 -0.16 0.0000075 0.23
LAGANNRTN -0.0024 -1.29 0.00043 1.34 0.000089' 1.78
AGE -0.00083 -0.46 0.000089 0.96 0.000015 0.78
TENURE 0.0072' 1.79 0.00020 0.68 -0.0000085 -0.12
PCTGAIN 0.81" 2.17 - - - -
No. observations 199 572 572
Year fixed effects? Yes Yes Yes
Fund-style indicators? Yes Yes Yes
Adjusted R^ 0.12 0.063 0.094
"' Significant at the 0.01 level
" Significant ill ihe 0.05 level
• Significani al the 0.10 level
Results frotn control variables indicate that a fund's tax burden is positively related to the
capital gains overhang at the beginning of the year. This relation is consistent v^'ith overhang
affecting trading decisions, consistent with prior research (Barclay, Pearson, and Weisbach, 1998;
Bergstresser and Poterba, 2002). The LTTOT variable is positively related to the percentage of
net asset value paid out as gains. It is also significantly higher for funds with new managers who
make initial portfolio changes when they take over the fund.
VI. Conclusion
As the share ofthe market owned by mutual funds continues to rise., determining the factors
that affect fund manager trading behavior has become increasingly important. This paper uses
newly disclosed managerial ownership data and details of other fund characteristics from the
years 2001-2004 to study the relation between a manager's personal wealth and the performance
ofthe associated fund. I find that managerial fund ownership varies widely, with approximately
one out of every two managers owning over $100,000 in the managed fund, and one out of every
five managers owning over $1,000,000.
20. 532 Financial Management » Autumn 2008
I find that fiinds run by minimally invested managers have significantly lower style-adjusted
retums (approximately 2.6%) than do funds where managers own more than $100,000 of their
ftind. They also have significantly higher turnover levels. Both findings are consistent with the
reduction ofthe agency costs set forth in the Dow and Gorton (1997) model, where managers
make value-reducing trades in lieu of making no trades when they cannot identify any suitable
investments. This paper's tax analyses do not find evidence of decreased tax sensitivity in funds
with minimally invested managers. This result is consistent with more substantially invested
managers trading for a tax-insensitive clientele, a clientele of unknown tax status, or with a
manager holding shares in a tax-deferred retirement account.
Investors should consider many variables when they choose to invest in mutual ftind shares.
The optimal ftind choice for each individual depends on personal goals, investment horizon, and
risk profile. However, the results of this study suggest that investors of any tax status might need
to add managerial ownership to the list of variables to consider when choosing a mutual fund
investment.• ' '
References
Aboody, D, and R. Kasznik, 2000, "CEO Stock Option Awards and the Timing of Corporate Voluntary
Disclosures," Journal ofAccounling and Economics 29, 73-100.
AllianceBernstein, 2004, Biting Back at Taxes: Exploring Tax-Managed Mutual Funds, New York, NY,
AllianceBernstein Investment Research and Management.
Barclay, M., N. Pearson, and M. Weisbach, 1998, "Open End Mutuai Funds and Capital Gains Taxes,"
Journal of Financial Economics 49, 3-43.
Bergstresser, D. and J. Poterba, 2002, "Do After Tax Retums Affect Mutual Fund Inflows?" Journal of
Financial Economics 63, 381-414.
Bhabra, H., U Dhillon, and G. Ramirez, 1999, "A November Effect? Revisiting the Tax Loss Selling
Hypothesis," Financio/A/onogemeni 28, 5-15.
Broussard. J., S. Buchenroth, and E. Pilotte, 2004, "CEO Incentives, Cash Flow, and Investment," Financial
Management 33, 51-70.
Brown, J., N. Liang, and S, Weisbenner, 2005, "Executive Financial Incentives and Payout Policy; Firm
Responses to the 2003 Dividend Tax Cut," University of Illinois and Federal Reserve Board Working
Paper.
Chen. J.. H. Hong. M. Huang, and J.D. Kubik, 2004, "Does Fund Size Erode Mutual Fund Performance?
The Role of Liquidity and Organization," American Economic Review 94, 1276-1302.
Chetty, R. and E. Saez, 2005, "Dividend Taxes and Corporate Behavior: Evidence from the 2003 Dividend
Cut," Quarterly Journal of Economics 120, 791-833.
Chevalier, J. and G. Ellison, 1999, "Career Concerns of Mutual Fund Managers," Quarterly Journal of
Economics 4,i34-S56.
Clinch, G., 1991, "Employee Compensation and Firms' Research and Development Activity," Journal of
Accounting Research 29, 59-78.
Coles, J., F. Meschke. and M. Lemmon. 2008, "Structural Models and Hndogeneity in Corporate Finance: The
Link between Managerial Ownership and Corporate Performance," Arizona State University, University
of Utah, and University of Minnesota Working Paper.
21. Evans • Portfolio Manager Ownership and Mutual Fund Performance 533
Dickson. J, and J. Shoven, 1995, "Taxation and Mutual Funds: An Investor Perspective," in J. Poterba, Ed.
Tax Policy and ¡he Economy, Vol. 9, Cambridge. MA, MIT Press, 151-181.
Dickson. I , J, Shoven, and C. Sialm, 2000, "Tax Externalities of Equity Mutual Fimds," National Tax
Journal 53, 601-62^.
Dow, J. and G. Gorton, 1997, "Noise Trading, Delegated Portfolio Management, and Economic Welfare,"
Journal of Political Economy 105, 1024-1050.
Fama, E. and M.Jensen, 1983, "Separation ofOwnership and Contro^'Vourna/o/LawanrfEconomiCi 26,
301-326.
Gibson, S., A. Safieddine, and S. Titman, 2000, "Tax Motivated Trading and Price Pressure: An Analysis
of Mutual Fund Holdings," Journal of Financial and Quantitative Analysis 35. 369-386.
Hanlon, M., S. Rajgopal, and T. Shevlin, 2005, "Are Executive Stock Options Associated with Future
Eamings?" Journal of Accounting and Economics 36, 3-43.
Huddart. S. and VG. Narayanan. 2002, "An Empirical Examination of Tax Factors and Mutual Funds Stock
Sales Decisions," Review of Accounting Studies 7, 319-341,
Hunt, H.. 1985, "Potential Determinants of Corporate Inventory Accounting Decisions," Journal of Ac-
counting Research 23,448-467.
Investment Company Institute, 2005, The Investment Company Fact Book, Washington, DC, Investment
Company Institute.
Jensen, M. and W. Meckling, 1976, "Theory ofthe Firm: Managerial Behavior, Agency Costs and Ownership
Structure," Journal of Financial Economics 3, 305-360.
Jin, L., 2006, "Capital Gain Tax Overhang and Price Pressure," Jburna/o/Finance 61, 1399-1431.
Khorana, A.. H. Servaes, and L. Wedge, 2006, "Portfolio Manager Ownership and Fund Performance,"
Journal of Financial Economics 85, 179-204.
Lambert, R., W. Lanen, and D. Larker, 1989, "Executive Stock Option Plans and Corporate Dividend Policy,"
Journal of Financial and Quantitative Analysis 24,409-425.
McConnell, J, and H. Servaes, 1990, "Additional Evidence on Equity Ownership and Corporate Value,"
Journal of Financial Economics 20, 293-315.
Meschke, F., 2005, "An Empirical Examination of Mutual Fund Boards." University of Minnesota and
Arizona State University Working Paper.
Morck, R., A. Sblcifer, and R. Vishny, 1988, "Management Ownership and Market Valuation," Journal of
Financial Economics 20, 293-315.
Nagar. V. D. Nanda, and P Wysocki, 2003, "Discretionary Disclosure and Stock-Based !ncentives,'Vourrta/
of Accounting and Economics 34, 283-309.
Niehaus, G., 1989, "Ownership Strucnire and Inventory Method Choice," The Accounting Review 64,
269-284.
Petersen, M., 2005, "Estimating Standard Errors in Finance Data Sets: Comparing Approaches," North-
western university Working Paper.
Plancich, S., 2003, "Mutual Fund Capital Gain Distributions and the Tax Reform Act of 1997," National
Tax Journal 56, 27 -296.
Qian, M., 2005, "Who Can You Trust? A Smdy on Mutual Fund Govemance," Boston College Working
Paper.
22. 534 Financial Management • Autumn 2006
Ryan, H. Jr. and R. Wiggins III, 2002, "The Interactions between R&D Investment Decisions and Compen-
sation Policy," Financial Management 31, 5-30.
Scherbina, A. and L. Jin, 2006. "Change is Good or the Disposition Effect among Mutual Fund Managers,"
Harvard Business School Working Paper.
Stulz, R., 1988, "Managerial Control of Voting Rights: Financing Policies and the Market for Corporate
Control," Journal of Financial Economics 21, 25-54.
Tufano, P. and M. Sevick, 1997, "Board Structure and Fee-Setting in the US Mutual Fund Industry," Journa/
of Financial Economics 46, 321 -335.
Warfieid, T, J. Wild, and K. Wild, 1995, "Managerial Ownership, Accounting Choices and Informativeness
of Earnings," Journal of Accounting and Economics 20, 61 -91.
Weiss, I., 2002, "Discussion of'An Empirical Examination of Tax Factors and Mutual Funds' Stock Sales
Decisions," Aev/evf o//íccotínííng S/Wi//ej 7, 343-347.