SlideShare uma empresa Scribd logo
1 de 15
Baixar para ler offline
WealthMark	
  Research	
  

By:	
  	
  Ben	
  Esget	
  

The	
  Hybrid	
  Solution	
  to	
  Portfolio	
  Management	


Introduction:	
  
Most	
  active	
  fund	
  managers	
  fail	
  to	
  beat	
  their	
  desired	
  index.	
  	
  John	
  Bogle,	
  founder	
  of	
  the	
  Vanguard	
  Group,	
  
testified	
  before	
  the	
  Senate	
  Subcommittee	
  on	
  Financial	
  Management,	
  the	
  Budget,	
  and	
  International	
  
Security	
  on	
  November	
  2,	
  2003	
  stating	
  from	
  1984-­‐2002	
  the	
  S&P	
  500	
  index	
  annualized	
  a	
  return	
  of	
  12.2%	
  
while	
  the	
  average	
  mutual	
  fund	
  annualized	
  9.3%.	
  	
  Over	
  multiple	
  decades	
  only	
  about	
  10%	
  of	
  mutual	
  funds	
  
managers	
  have	
  been	
  able	
  to	
  beat	
  the	
  S&P	
  500	
  index1.	
  	
  Investors	
  compound	
  manager’s	
  
underperformance	
  by	
  chasing	
  high	
  performing	
  managers,	
  investing	
  only	
  after	
  the	
  manager	
  has	
  racked	
  
up	
  impressive	
  gains,	
  then	
  investors	
  watch	
  their	
  account	
  underperform	
  as	
  the	
  manager	
  regresses	
  to	
  the	
  
mean	
  of	
  all	
  managers.	
  	
  Morningstar	
  Inc.	
  frequently	
  cites	
  examples	
  of	
  mutual	
  fund	
  investors	
  doing	
  much	
  
worse	
  than	
  the	
  fund	
  itself	
  by	
  trying	
  to	
  time	
  well	
  performing	
  funds	
  and	
  futher	
  highlights	
  this	
  problem	
  
noting	
  Star	
  managers	
  that	
  have	
  fallen	
  from	
  grace,	
  citing	
  examples	
  such	
  as	
  the	
  Legg	
  Mason	
  Value	
  Trust,	
  
the	
  CGM	
  Focus	
  Fund,	
  and	
  the	
  Fairholm	
  Fund.	
  	
  	
  But	
  even	
  Morningstars’	
  own	
  fund	
  selection	
  process	
  has	
  
failed	
  to	
  add	
  value;	
  in	
  fact,	
  their	
  fund	
  selection	
  process	
  has	
  done	
  worse	
  than	
  the	
  average	
  actively	
  
managed	
  mutual	
  fund	
  (see	
  Exhibit	
  1).	
  	
  It	
  is	
  the	
  blind,	
  leading	
  the	
  blind,	
  leading	
  the	
  blind.	
  

Exhibit	
  1:	


1
 	
  Burton	
  G.	
  Malkiel,	
  “Reflections	
  on	
  the	
  Efficient	
  Market	
  Hypothesis:	
  30	
  Years	
  Later,”	
  The	
  Financial	
  Review	
  40,	
  
http://www.e-­‐m-­‐h.org/Malkiel2005.pdf	
  (2005):	
  1-­‐9.	
  

                                                                                                                                                                                                                                                       1	


Morningstar	
  4	
  and	
  5	
  star	
  funds	
  versus	
  the	
  Wilshire	
  5000	
  index	
  *based	
  on	
  equal	
  investment	
  in	
  55	
  
funds,	
  after	
  expenses,	
  loads	
  and	
  redemption	
  fees.	
  

Source:	
  Hulbert	
  Financial	
  Digest	
  

Exhibit	
  2	
  shows	
  historically	
  hedge	
  funds	
  have	
  achieved	
  higher	
  returns	
  than	
  traditional	
  indexes,	
  especially	
  
when	
  adjusted	
  for	
  risk.	
  	
  	
  From	
  1994-­‐2011	
  hedge	
  funds	
  returned	
  9.07%	
  annualized	
  while	
  stocks	
  and	
  
bonds	
  returned	
  7.18%	
  and	
  6.25%	
  annualized,	
  respectively.	


Exhibit	
  2:	


Source:	
  Center	
  for	
  Hedge	
  Fund	
  Research	
  

Hedge	
  funds	
  come	
  with	
  unique	
  problems	
  that	
  do	
  not	
  make	
  the	
  extra	
  alpha	
  achieved	
  risk	
  free.	
  	
  One	
  of	
  
the	
  major	
  problems	
  with	
  hedge	
  funds	
  is	
  the	
  extreme	
  fee	
  structure.	
  	
  Traditionally	
  hedge	
  funds	
  have	
  
charged	
  a	
  2%	
  management	
  fee	
  and	
  a	
  20%	
  incentive	
  fee.	
  	
  Fees	
  have	
  been	
  coming	
  down	
  over	
  the	
  last	
  18	
  
years,	
  but	
  during	
  those	
  18	
  years	
  hedge	
  funds	
  pocketed	
  28.1%	
  of	
  profits	
  generated	
  in	
  the	
  portfolios2.	


Hedge	
  funds	
  generally	
  use	
  leverage	
  to	
  enhance	
  returns	
  both	
  directly	
  and	
  at	
  the	
  security	
  level.	
  	
  They	
  
deploy	
  leverage	
  directly	
  by	
  accessing	
  lines	
  of	
  credit	
  and	
  indirectly	
  through	
  use	
  of	
  options	
  and	
  futures.	
  	
  In	
  
addition,	
  hedge	
  funds	
  are	
  usually	
  not	
  transparent	
  and	
  quite	
  often	
  illiquid.	
  	
  This	
  creates	
  a	
  very	
  unique	
  
situation	
  where	
  there	
  is	
  a	
  disjoint	
  in	
  distribution	
  of	
  information	
  between	
  the	
  potential	
  investor	
  and	
  the	
  
fund	
  manager	
  as	
  to	
  how	
  much	
  risk	
  is	
  involved	
  with	
  the	
  fund,	
  and	
  how	
  robust	
  the	
  funds	
  strategy	
  is	
  going	
  
forward.	
  	
  Warren	
  Buffett	
  is	
  famous	
  for	
  saying	
  “When	
  the	
  tide	
  goes	
  out	
  you	
  see	
  who	
  is	
  swimming	
  
naked.”	
  	
  During	
  the	
  economic	
  collapse	
  of	
  2008	
  many	
  hedge	
  fund	
  investors	
  were	
  dismayed	
  to	
  discover	


2
 	
  Laurence	
  Fletcher,	
  Managers	
  Pocket	
  28%	
  of	
  Hedge	
  Fund	
  Profits	
  –	
  Study,	
  
http://www.reuters.com/article/2012/04/24/us-­‐hedgefunds-­‐study-­‐idUSBRE83N0JR20120424	
  (April	
  2012).	
  

                                                                                                                                                                                                                                                          2	


their	
  funds	
  using	
  copious	
  leverage	
  and	
  many	
  funds	
  “locked”	
  assets	
  allowing	
  liquidity	
  at	
  the	
  managers’	
  
discretion.	
  	
  Hedge	
  funds	
  also	
  display	
  massive	
  variance	
  of	
  the	
  individual	
  fund’s	
  performance.	
  	
  Unlike	
  
mutual	
  funds	
  where	
  most	
  simply	
  underperform	
  an	
  index,	
  hedge	
  funds	
  often	
  completely	
  collapse	
  or	
  
experience	
  massive	
  losses.	
  	
  Finally,	
  hedge	
  funds	
  are	
  required	
  by	
  law	
  to	
  set	
  net	
  worth	
  minimums,	
  limit	
  
their	
  number	
  of	
  investors	
  and	
  are	
  restricted	
  in	
  how	
  they	
  market	
  in	
  an	
  effort	
  to	
  protect	
  unsophisticated	
  
investors	
  from	
  risk.	
  	
  To	
  offset	
  these	
  government	
  interventions	
  hedge	
  funds	
  usually	
  set	
  high	
  minimum	
  
investment	
  amounts	
  to	
  maximize	
  their	
  assets	
  per	
  fund.	


Overall,	
  the	
  portfolio	
  management	
  industry	
  lacks	
  a	
  clear	
  value	
  proposition	
  for	
  the	
  investor.	
  	
  Where	
  
outperformance	
  is	
  seen	
  it	
  is	
  often	
  overpriced,	
  difficult	
  to	
  predict	
  going	
  forward,	
  and	
  comes	
  with	
  unique	
  
characteristics	
  which	
  generally	
  involve	
  excess	
  risk.	
  	
  A	
  new	
  style	
  of	
  portfolio	
  management	
  is	
  needed	
  that	
  
eliminates	
  these	
  issues	
  and	
  restores	
  the	
  investor	
  value	
  proposition.	
  

Alpha	
  demystified:	
  
There	
  are	
  three	
  key	
  ways	
  portfolio	
  managers	
  can	
  add	
  alpha	
  outside	
  of	
  employing	
  leverage.	


            1. Security	
  selection	
  
            2. Market	
  timing	
  	
  
            3. Beta	
  selection	


Source:	
  Investcorp	
  

Security	
  selection	
  can	
  be	
  any	
  individual	
  investment	
  form	
  of	
  holding,	
  including	
  but	
  not	
  limited	
  to,	
  an	
  
individual	
  stock,	
  bond,	
  index,	
  piece	
  of	
  real	
  estate,	
  an	
  option	
  or	
  a	
  futures	
  contract.	
  	
  Beta	
  timing	
  is	
  the	
  
practice	
  of	
  moving	
  allocations	
  within	
  a	
  portfolio	
  as	
  a	
  way	
  of	
  increasing	
  or	
  decreasing	
  risk.	
  	
  Beta	
  selection	
  
is	
  the	
  fund	
  managers’	
  choice	
  of	
  how	
  much	
  risk	
  in	
  relation	
  to	
  the	
  market	
  to	
  take.	


The	
  vast	
  majority	
  of	
  portfolio	
  managers	
  attempt	
  to	
  add	
  value	
  through	
  only	
  one	
  or	
  two	
  of	
  these	
  
methods.	
  	
  Most	
  managers	
  often	
  do	
  so	
  in	
  a	
  discretionary	
  way	
  and,	
  as	
  discussed	
  above,	
  either	
  come	
  up	
  
short	
  or	
  create	
  a	
  portfolio	
  exposed	
  to	
  very	
  unique	
  risks	
  and	
  exorbitant	
  fees.	
  	
  In	
  order	
  to	
  combat	
  these	
  
issues	
  we	
  recommend	
  systematically	
  adding	
  value	
  through	
  all	
  three	
  drivers	
  of	
  alpha.	
  

Eliminating	
  Forced	
  and	
  Unforced	
  Errors:	


                                                                                                                                                                    3	


In	
  investing,	
  like	
  baseball,	
  there	
  are	
  forced	
  and	
  unforced	
  errors.	
  	
  Forced	
  errors	
  are	
  defined	
  as:	
  a	
  miss	
  
caused	
  by	
  an	
  opponent’s	
  good	
  play.	
  	
  Unforced	
  errors	
  are	
  defined	
  as:	
  an	
  error	
  in	
  service	
  or	
  a	
  return	
  shot	
  
that	
  cannot	
  be	
  attributed	
  to	
  any	
  factor	
  other	
  than	
  poor	
  judgment	
  and	
  execution	
  by	
  the	
  player3.	
  	
  
Investors	
  can	
  greatly	
  reduce	
  unforced	
  errors	
  by	
  taking	
  a	
  systematic	
  approach	
  to	
  investing	
  because	
  it	
  
greatly	
  reduces	
  the	
  chance	
  of	
  making	
  mistakes.	
  	
  Indexes	
  are	
  a	
  great	
  example	
  of	
  this	
  since	
  indexes	
  are	
  a	
  
manmade	
  systematized	
  approach	
  to	
  investing.	
  	
  Individual	
  investors	
  like	
  mutual	
  fund	
  managers	
  often	
  fail	
  
to	
  outperform	
  the	
  S&P	
  500	
  which	
  is	
  a	
  manmade	
  index.	
  	
  Some	
  indexes	
  however	
  have	
  actually	
  fared	
  
better	
  than	
  the	
  S&P	
  500.	
  	
  	
  Since	
  its’	
  inception	
  the	
  NASDAQ	
  index	
  has	
  outperformed	
  the	
  S&P	
  500	
  albeit	
  
with	
  much	
  higher	
  volatility	
  (See	
  Exhibit	
  3).	
  	
  Since	
  1990	
  the	
  global	
  bond	
  index	
  has	
  outperformed	
  the	
  S&P	
  
500,	
  but	
  did	
  have	
  very	
  long	
  periods	
  of	
  underperformance	
  (See	
  Exhibit	
  2).	
  

Exhibit	
  3:	


The	
  probability	
  of	
  making	
  a	
  forced	
  error	
  goes	
  up	
  as	
  the	
  volume	
  of	
  trades	
  and	
  transactions	
  increase	
  
because	
  there	
  is	
  a	
  chance	
  that	
  your	
  positioning	
  will	
  be	
  incorrect.	
  	
  Each	
  transaction	
  exponentially	
  
increases	
  the	
  odds	
  of	
  mistakes	
  compounding	
  while	
  every	
  transaction	
  increases	
  tax	
  liability	
  and	
  
transaction	
  costs.	
  	
  For	
  these	
  reason	
  robust	
  investment	
  strategies	
  should	
  not	
  only	
  be	
  systematic	
  but	
  will	
  
have	
  a	
  better	
  chance	
  at	
  future	
  success	
  if	
  they	
  are	
  semi-­‐passive	
  with	
  limited	
  trading	
  limiting	
  the	
  
opportunities	
  for	
  forced	
  or	
  unforced	
  errors.	
  	
  Warren	
  Buffet	
  states	
  that	
  as	
  he	
  gets	
  older	
  his	
  holding	
  times	
  
get	
  longer	
  and	
  longer	
  because	
  “When	
  you	
  sell	
  you	
  have	
  to	
  be	
  right	
  twice,	
  once	
  when	
  you	
  sell	
  and	
  once	
  
when	
  you	
  buy	
  again.”	


3
       	
  Wikipedia,	
  Glossary	
  of	
  Tennis	
  Terms	
  -­‐	
  Unforced	
  Error,	
  http://en.wikipedia.org/wiki/Unforced_error#U.	
  

                                                                                                                                                                                                                                                       4	


Lunch:	
  	
  Not	
  Free,	
  but	
  More	
  of	
  It:	
  
Academic	
  and	
  Industry	
  research	
  reveal	
  four	
  aspects	
  of	
  stocks	
  that	
  display	
  a	
  persistent	
  and	
  robust	
  ability	
  
to	
  generate	
  alpha	
  systematically:	
  

             1.     Value	
  
             2.     Momentum	
  
             3.     Dividends	
  	
  
             4.     Volatility	
  

The	
  vast	
  majority	
  of	
  academic	
  and	
  industry	
  research	
  is	
  in	
  the	
  area	
  of	
  valuation.	
  	
  Over	
  time	
  value	
  stocks	
  
have	
  outperformed	
  other	
  stocks	
  whether	
  you	
  define	
  value	
  as	
  EV/EBITDA	
  (Enterprise	
  Value/	
  Earnings	
  
Before	
  Interest,	
  Taxes,	
  Depreciation	
  and	
  Amortization,	
  EV/GP	
  (Enterprise	
  Value/Gross	
  Profit),	
  P/E	
  (Price	
  
to	
  Earnings),	
  P/B	
  (Price	
  to	
  Book),	
  or	
  EV/FCF	
  (Enterprise	
  Value/Free	
  Cash	
  Flow).	
  

Exhibit	
  4:	


Source:	
  	
  Gray	
  and	
  Carlisle,	
  “Quantitative	
  Value”,	
  Due	
  2013	


Many	
  mutual	
  fund	
  managers	
  and	
  some	
  hedge	
  fund	
  managers	
  classify	
  themselves	
  as	
  value	
  investors.	
  	
  
Yet,	
  even	
  as	
  value	
  stocks	
  outperform	
  the	
  index	
  most	
  of	
  these	
  managers	
  fall	
  short.	
  	
  Interestingly,	
  there	
  is	
  
a	
  large	
  body	
  of	
  research	
  indicating	
  that	
  the	
  belief	
  humans	
  add	
  value	
  above	
  and	
  beyond	
  a	
  quantitative	
  
model	
  is	
  incorrect.	
  	
  The	
  data	
  shows	
  that	
  quant	
  models	
  are	
  the	
  ceiling	
  of	
  performance	
  and	
  human	


                                                                                                                                                                 5	


decisions	
  not	
  only	
  don’t	
  enhance	
  performance	
  but	
  actually	
  diminish	
  it.4	
  	
  Perhaps	
  it	
  is	
  cognitive	
  
dissidence,	
  perhaps	
  it	
  is	
  the	
  high	
  level	
  of	
  testosterone	
  on	
  Wall	
  Street5,	
  or	
  perhaps	
  it	
  is	
  boyhood	
  fantasies	
  
of	
  becoming	
  Warren	
  Buffet,	
  but	
  whatever	
  the	
  reason,	
  money	
  managers	
  seem	
  incapable	
  of	
  accepting	
  a	
  
passive	
  approach	
  to	
  value.	


Momentum	
  investment	
  strategies,	
  also	
  known	
  as	
  trend	
  following,	
  have	
  been	
  well	
  documented	
  as	
  a	
  way	
  
to	
  add	
  alpha.	
  	
  For	
  years	
  trend	
  followers	
  established	
  themselves	
  as	
  managed	
  futures	
  hedge	
  funds	
  but	
  
more	
  recently	
  this	
  strategy	
  has	
  been	
  established	
  as	
  a	
  value	
  added	
  way	
  to	
  buy	
  stocks.	
  	
  In	
  their	
  research	
  
paper	
  “Does	
  Trend	
  Following	
  Work	
  on	
  Stocks?”	
  Willcox	
  and	
  Critenden	
  show	
  that	
  using	
  momentum	
  as	
  
criteria	
  to	
  buying	
  and	
  selling	
  stocks	
  added	
  substantial	
  value	
  over	
  the	
  basic	
  index	
  (See	
  exhibit	
  5).	


Exhibit	
  5:	


Source:	
  	
  Blackstar	
  Equity.	


Equity	
  research	
  from	
  Goldman	
  Sachs	
  and	
  Dorsey	
  Wright	
  show	
  similar	
  results	
  both	
  on	
  a	
  hypothetical	
  
back	
  tested	
  basis	
  and	
  on	
  a	
  real	
  time	
  performance	
  basis.	


4
  	
  EYQUM	
  Investment	
  Management,	
  The	
  Case	
  for	
  Quantitative	
  Value	
  Investment,	
  
http://www.scribd.com/doc/97001708/Case-­‐for-­‐Quantitative-­‐Value-­‐Eyquem-­‐Global-­‐Strategy-­‐20120613	
  (June	
  
2012).	
  
5
  	
  Sylvia	
  Ann	
  Hewlett,	
  Harvard	
  Business	
  Review:	
  Too	
  Much	
  Testosterone	
  on	
  Wall	
  Street?,	
  
http://blogs.hbr.org/hbr/hewlett/2009/01/too_much_testosterone_on_wall.html	
  (January	
  2009).	
  

                                                                                                                                                                                                                                                       6	


Picking	
  stocks	
  based	
  on	
  dividend	
  yield	
  is	
  another	
  way	
  to	
  systematically	
  enhance	
  returns.	
  	
  Similar	
  to	
  value	
  
investing,	
  dividends	
  appear	
  to	
  add	
  incrementally	
  more	
  value	
  (See	
  Exhibit	
  6).	
  	
  In	
  the	
  “Little	
  Book	
  of	
  Big	
  
Dividends”,	
  Carlson	
  shows	
  that	
  not	
  only	
  does	
  buying	
  stocks	
  in	
  accordance	
  with	
  the	
  dividend	
  yield	
  add	
  
value	
  but	
  more	
  value	
  can	
  be	
  added	
  when	
  run	
  through	
  an	
  algorithm	
  for	
  safety	
  as	
  well.	
  	
  Professor	
  Jeremy	
  
Siegel’s	
  research	
  shows	
  that	
  dividend	
  stocks	
  have	
  added	
  additional	
  alpha	
  going	
  back	
  as	
  far	
  as	
  data	
  exists	
  
(1800’s).	


Exhibit	
  6:	


                                                                                                                                                  +	
  
Source:	
  Credit	
  Suisse,	
  2011	


In	
  recent	
  years	
  the	
  concept	
  of	
  a	
  low	
  volatility,	
  or	
  low	
  beta	
  index	
  (also	
  called	
  low-­‐variance,)	
  has	
  gained	
  
popularity	
  as	
  a	
  wave	
  of	
  academic	
  research	
  shows	
  this	
  strategy	
  to	
  add	
  alpha.	
  	
  One	
  of	
  the	
  more	
  
interesting	
  aspects	
  of	
  low	
  volatility	
  stocks	
  is	
  that	
  they	
  appear	
  to	
  have	
  a	
  bimodal	
  distribution	
  of	
  beta	
  
depending	
  on	
  market	
  conditions.	
  	
  During	
  bull	
  markets	
  low	
  volatility	
  stocks	
  have	
  historically	
  had	
  a	
  beta	
  
close	
  to	
  1	
  and	
  often	
  outperform	
  the	
  market	
  as	
  a	
  whole	
  during	
  this	
  period6.	
  	
  During	
  bear	
  markets	
  low	
  
volatility	
  stocks	
  have	
  historically	
  displayed	
  low	
  beta	
  and	
  have	
  proven	
  a	
  natural	
  hedge	
  against	


6
 	
  Pim	
  van	
  Vliet,	
  “Ten	
  Things	
  You	
  Should	
  Know	
  About	
  Low-­‐Volatility	
  Investing,”	
  The	
  Journal	
  of	
  Investing	
  (Winter	
  
2011):	
  141-­‐143.	
  

                                                                                                                                                                                                                                                       7	


drawdowns7.	
  	
  In	
  1990,	
  S&P	
  started	
  its	
  own	
  index	
  that	
  tracks	
  the	
  100	
  lowest	
  volatility	
  stocks	
  within	
  the	
  
S&P	
  500	
  for	
  the	
  last	
  trading	
  year	
  and	
  the	
  results	
  are	
  impressive	
  (See	
  Exhibit	
  7).	
  	
  Other	
  researchers	
  have	
  
looked	
  back	
  further,	
  using	
  back-­‐tested	
  hypothetical	
  indexes.	
  	
  This	
  work	
  showed	
  similar	
  results	
  to	
  that	
  of	
  
S&P.	
  	
  One	
  of	
  the	
  more	
  interesting	
  pieces	
  of	
  research	
  was	
  published	
  in	
  the	
  Journal	
  of	
  Portfolio	
  
Management	
  in	
  1991	
  entitled	
  “Beta	
  and	
  Return”	
  by	
  Fisher	
  Black.	
  	
  They	
  show	
  from	
  1926	
  to	
  1991	
  “low-­‐
beta	
  stocks	
  did	
  better	
  than	
  the	
  CAPM	
  (Capital	
  Asset	
  Pricing	
  Model)	
  predicts,	
  and	
  high	
  beta	
  stocks	
  did	
  
worse.”	
  	
  He	
  explains	
  how	
  this	
  anomaly	
  is	
  not	
  decreasing	
  in	
  significance	
  but	
  rather	
  is	
  increasing,	
  “If	
  
anything,	
  the	
  pattern	
  looks	
  stronger	
  (from	
  1965-­‐1991)	
  than	
  it	
  did	
  for	
  1926-­‐1965	
  period.”	
  	
  Interestingly,	
  
in	
  1991	
  Black	
  conceded	
  he	
  had	
  no	
  way	
  of	
  knowing	
  if	
  low	
  volatility	
  stocks	
  would	
  continue	
  to	
  outperform	
  
going	
  forward,	
  but	
  we	
  can	
  now	
  see	
  they	
  definitely	
  have.	
  	
  Similar	
  results	
  have	
  been	
  shown	
  by	
  Robeco	
  
Asset	
  Management,	
  Russell	
  Investments,	
  and	
  Thorley	
  and	
  Perry	
  of	
  BYU.	


Exhibit	
  7:	


Source:	
  S&P	
  Research	


Investors	
  should	
  consider	
  several	
  things	
  when	
  deciding	
  if	
  and	
  how	
  to	
  use	
  any	
  of	
  the	
  four	
  strategies	
  listed	
  
above.	
  	
  The	
  most	
  important	
  considerations	
  are	
  the	
  likelihood	
  that	
  a	
  strategy	
  will	
  continue	
  to	
  work	
  going	
  
forward,	
  the	
  investor’s	
  ability	
  to	
  stick	
  with	
  the	
  strategy	
  and	
  the	
  turnover	
  within	
  the	
  strategy.	
  	
  	
  It	
  should	
  
come	
  as	
  no	
  surprise	
  that	
  each	
  of	
  the	
  strategies	
  discussed	
  above	
  is	
  not	
  a	
  free	
  lunch.	
  	
  Each	
  strategy	
  has	
  
long	
  periods	
  of	
  time	
  where	
  it	
  underperforms	
  other	
  indexes,	
  sometimes	
  significantly.	
  	
  At	
  points	
  of	
  
underperformance	
  the	
  investor	
  must	
  decide	
  whether	
  to	
  stick	
  with	
  a	
  strategy	
  based	
  on	
  its	
  long-­‐term	
  
merits	
  or	
  throw	
  in	
  the	
  towel	
  for	
  a	
  different	
  strategy.	
  	
  In	
  my	
  opinion,	
  this	
  is	
  the	
  number	
  one	
  reason	


7
 	
  Pim	
  van	
  Vliet,	
  Low-­volatility	
  investing:	
  a	
  long-­term	
  perspective,	
  
http://www.robeco.com/professionals/insights/quantitative-­‐investing/low-­‐volatility-­‐investing/low-­‐
volatility-­‐investing-­‐a-­‐long-­‐term-­‐perspective.jsp	
  (January	
  2012).	
  

                                                                                                                                                                                                                                                       8	


investors	
  fail	
  to	
  achieve	
  above	
  average	
  performance.	
  	
  	
  This	
  dilemma	
  is	
  toughest	
  with	
  momentum	
  
strategies	
  because	
  they	
  are	
  notoriously	
  volatile	
  (sharp	
  and	
  sudden	
  losses	
  known	
  as	
  drawdowns)	
  and	
  
have	
  high	
  transaction	
  volumes	
  leading	
  to	
  a	
  higher	
  chance	
  of	
  errors.	
  	
  Drawdowns	
  are	
  a	
  measure	
  of	
  
investor	
  pain,	
  and	
  human	
  psychology	
  is	
  such	
  that	
  investors	
  often	
  evaluate	
  how	
  much	
  pain	
  is	
  worth	
  a	
  
unit	
  of	
  gain.	
  	
  Large	
  drawdowns	
  coupled	
  with	
  high	
  transaction	
  volumes	
  will	
  make	
  this	
  strategy	
  difficult	
  for	
  
most	
  investors	
  to	
  stick	
  with.	
  	
  Value,	
  Dividends,	
  and	
  Low	
  Volatility	
  strategies	
  are	
  all	
  lower	
  turnover	
  giving	
  
the	
  investor	
  a	
  better	
  chance	
  of	
  sticking	
  with	
  the	
  strategy.	


Only	
  a	
  Low	
  Volatility	
  portfolio	
  by	
  design	
  will	
  limit	
  downside	
  risk.	
  	
  The	
  degree	
  to	
  which	
  value	
  stocks	
  and	
  
high	
  dividend	
  portfolios	
  limit	
  downside	
  risk	
  is	
  much	
  more	
  uncertain.	
  	
  Examining	
  the	
  market	
  crash	
  of	
  
2008,	
  value	
  metrics	
  showed	
  bank	
  stocks	
  to	
  be	
  significantly	
  undervalued	
  and	
  banks	
  appeared	
  on	
  most	
  
dividend	
  screens	
  as	
  the	
  highest	
  yielding	
  stocks.	
  	
  Of	
  course,	
  bank	
  stocks	
  were	
  some	
  of	
  the	
  hardest	
  hit	
  
during	
  the	
  2008	
  market	
  collapse	
  leaving	
  many	
  of	
  these	
  portfolios	
  significantly	
  underperforming	
  other	
  
indexes	
  and	
  investors	
  facing	
  the	
  dilemma	
  discussed	
  above.	
  	
  The	
  S&P	
  Low	
  Volatility	
  index	
  however,by	
  
design	
  is	
  low	
  volatility	
  and	
  experiences	
  significantly	
  less	
  downside.	
  	
  The	
  S&P	
  500	
  Low	
  Volatility	
  index	
  
includes	
  a	
  high	
  degree	
  of	
  value	
  stocks	
  and	
  both	
  currently	
  and	
  historically	
  boosts	
  a	
  higher	
  dividend	
  yield	
  
than	
  the	
  S&P	
  500	
  index.	
  	
  Low	
  volatility	
  portfolios	
  have	
  the	
  advantage	
  of	
  being	
  value	
  oriented	
  and	
  high	
  
yielding;	
  but	
  value	
  portfolios	
  and	
  high	
  yielding	
  portfolios	
  do	
  not	
  necessarily	
  boast	
  low	
  volatility.	
  	
  Low	
  
volatility	
  portfolios	
  have	
  conceptual	
  advantages	
  as	
  well,	
  primarily,	
  because	
  they	
  are	
  difficult	
  to	
  arbitrage	
  
away.	
  	
  Not	
  only	
  do	
  the	
  portfolios	
  tend	
  to	
  favor	
  some	
  of	
  the	
  largest	
  most	
  liquid	
  stocks	
  in	
  the	
  world	
  these	
  
portfolios	
  are	
  not	
  designed	
  to	
  “outperform”	
  but	
  rather	
  reduce	
  volatility.	
  	
  In	
  a	
  world	
  where	
  portfolio	
  
managers	
  are	
  paid	
  handsomely	
  for	
  outperformance	
  it	
  is	
  irrational	
  for	
  portfolio	
  managers	
  to	
  focus	
  on	
  a	
  
strategy	
  that	
  is	
  not	
  designed	
  for	
  explicit	
  outperformance	
  (never	
  mind	
  the	
  difficulty	
  marketing	
  such	
  a	
  
strategy	
  during	
  a	
  raging	
  bull	
  market)	
  thus	
  creating	
  a	
  situation	
  where	
  a	
  known	
  driver	
  of	
  alpha	
  is	
  left	
  
underutilized.	


Picking	
  Your	
  Poison:	


Choosing	
  how	
  much	
  risk	
  to	
  accept	
  during	
  portfolio	
  construction	
  is	
  like	
  choosing	
  poison;	
  at	
  some	
  point	
  
any	
  amount	
  of	
  incremental	
  risk	
  will	
  sting.	
  	
  The	
  world	
  of	
  beta	
  is	
  infinite,	
  ranging	
  from;	
  cash	
  with	
  a	
  beta	
  of	
  
zero	
  to	
  penny	
  stocks	
  and	
  options	
  often	
  approaching	
  Vegas	
  odds.	
  	
  Choosing	
  the	
  right	
  amount	
  of	
  
incremental	
  risk	
  is	
  an	
  extremely	
  complex	
  concept	
  where	
  even	
  the	
  best	
  portfolio	
  managers	
  quite	
  often	
  
underestimate	
  the	
  extremities	
  within	
  markets89.	
  	
  One	
  of	
  the	
  best	
  ways	
  to	
  construct	
  a	
  robust	
  portfolio	
  is	
  
to	
  find	
  a	
  baseline	
  beta	
  for	
  your	
  portfolio	
  and	
  incrementally	
  add	
  or	
  subtract	
  beta	
  accordingly.	
  	
  In	
  a	
  
portfolio	
  where	
  only	
  broad	
  based	
  liquid	
  indexes	
  are	
  used,	
  securities	
  and	
  allocations	
  should	
  be	
  
preselected	
  in	
  a	
  way	
  to	
  systematically	
  increase	
  or	
  reduce	
  risk.	
  	
  By	
  preselecting	
  betas	
  and	
  asset	
  allocation	
  
for	
  robust	
  portfolio	
  performance	
  under	
  periods	
  of	
  extreme	
  market	
  duress,	
  the	
  portfolio	
  manager	
  has	
  a	
  
higher	
  probability	
  of	
  avoiding	
  the	
  large	
  losses	
  seen	
  by	
  many	
  hedge	
  funds	
  as	
  well	
  as	
  creating	
  a	
  strategy	
  
that	
  is	
  easier	
  for	
  investors	
  to	
  stick	
  with.	


The	
  beta	
  of	
  the	
  S&P	
  Low	
  Volatility	
  index	
  is	
  .57	
  while	
  that	
  of	
  the	
  S&P	
  500	
  is	
  1	
  .	
  This	
  means	
  for	
  every	
  1%	
  
the	
  S&P	
  500	
  moves,	
  the	
  Low	
  Volatility	
  index	
  moves	
  .57%,	
  on	
  a	
  daily	
  basis.	
  	
  We	
  set	
  a	
  baseline	
  beta	
  to	
  be	
  
that	
  of	
  the	
  S&P	
  Low	
  Volatility	
  index.	
  	
  Thus,	
  any	
  incremental	
  increase	
  or	
  decrease	
  in	
  beta	
  from	
  this	


8
  	
  Roger	
  Lowenstein,	
  When	
  Genius	
  Failed:	
  The	
  Rise	
  and	
  Fall	
  of	
  Long-­‐Term	
  Capital	
  Management	
  (Random	
  House	
  
Trade	
  Paperbacks,	
  2001).	
  
9
  	
  Nassim	
  Nicholas	
  Taleb,	
  The	
  Black	
  Swan:	
  Second	
  Edition:	
  The	
  Impact	
  of	
  the	
  Highly	
  Improbable:	
  With	
  a	
  new	
  section:	
  
"On	
  Robustness	
  and	
  Fragility	
  (Random	
  House	
  Trade	
  Paperbacks;	
  2	
  edition,	
  May	
  2010).	
  

                                                                                                                                                                                                                                                       9	


starting	
  point	
  must	
  be	
  justified	
  and	
  should	
  be	
  done	
  in	
  a	
  very	
  controlled	
  way.	
  	
  To	
  reduce	
  beta	
  we	
  
incrementally	
  add	
  portions	
  of	
  the	
  Barclays	
  bond	
  aggregate	
  and	
  to	
  increase	
  beta	
  we	
  incrementally	
  add	
  
portions	
  of	
  the	
  NASDAQ	
  index,	
  up	
  to	
  60%.	
  	
  The	
  beta	
  of	
  the	
  Barclays	
  bond	
  aggregate	
  against	
  the	
  S&P	
  500	
  
is	
  .17	
  with	
  a	
  .20	
  correlation	
  and	
  the	
  beta	
  of	
  the	
  NASDAQ	
  against	
  the	
  S&P	
  500	
  is	
  1.18	
  with	
  a	
  correlation	
  
of	
  .9210.	
  	
  Notice,	
  the	
  highest	
  beta	
  we	
  are	
  willing	
  to	
  accept	
  in	
  any	
  portion	
  of	
  our	
  portfolio	
  is	
  only	
  1.18	
  and	
  
this	
  is	
  blended	
  with	
  an	
  index	
  with	
  a	
  beta	
  of	
  .57	
  bringing	
  the	
  overall	
  maximum	
  portfolio	
  beta	
  to	
  .814	
  
(much	
  lower	
  than	
  the	
  S&P	
  500).	
  	
  For	
  reference	
  the	
  S&P	
  High	
  Beta	
  index	
  has	
  a	
  beta	
  of	
  1.7	
  and	
  the	
  Oil	
  
Service	
  Sector	
  index	
  has	
  a	
  beta	
  of	
  1.4711.	
  The	
  standard	
  deviation	
  of	
  the	
  S&P	
  Low	
  Volatility	
  index,	
  the	
  
Barclays	
  Bond	
  Aggregate	
  index	
  and	
  the	
  NASDAQ	
  are,	
  11.37%,	
  2.86%	
  and	
  18.43%,	
  respectively.	
  	
  By	
  
systematically	
  controlling	
  the	
  beta	
  in	
  the	
  portfolio,	
  the	
  portfolio	
  manager	
  increases	
  the	
  probability	
  of	
  
avoiding	
  extreme	
  losses,	
  enhancing	
  investors’	
  ability	
  to	
  stick	
  with	
  the	
  portfolio	
  during	
  extreme	
  
conditions,	
  the	
  probability	
  or	
  repeatability	
  of	
  performance,	
  and	
  alpha.	


Macro	
  Advantage:	


Beta	
  timing	
  has	
  a	
  terrible	
  reputation	
  littered	
  with	
  high	
  frequency	
  trading	
  styles	
  and	
  massive	
  losses	
  but	
  
let	
  us	
  be	
  clear,	
  any	
  type	
  of	
  portfolio	
  change	
  is	
  beta	
  timing.	
  	
  The	
  decision	
  to	
  rebalance	
  a	
  portfolio,	
  sell	
  one	
  
stock	
  and	
  buy	
  another,	
  or	
  implement	
  tactical	
  asset	
  allocation	
  are	
  all	
  decision	
  that	
  involve	
  changing	
  the	
  
beta	
  mix	
  of	
  a	
  portfolio	
  and	
  are	
  therefore	
  market	
  timing.	
  	
  As	
  discussed	
  above,	
  such	
  decisions	
  can	
  be	
  
made	
  in	
  a	
  systematic	
  way	
  or	
  in	
  a	
  haphazard	
  way.	
  	
  	
  Even	
  indexes	
  perform	
  some	
  market	
  timing	
  when	
  they	
  
rebalance	
  the	
  indices.	
  	
  In	
  its	
  purest	
  form,	
  beta	
  timing	
  is	
  going	
  from	
  100%	
  in	
  the	
  S&P	
  500	
  to	
  100%	
  cash,	
  
moving	
  beta	
  from	
  1	
  to	
  0;	
  any	
  other	
  portfolio	
  reconstruction	
  is	
  simply	
  the	
  same	
  thing	
  to	
  a	
  lesser	
  degree.	


Macro	
  strategies	
  can	
  increase	
  alpha	
  while	
  reducing	
  risk	
  (See	
  Exhibit	
  8).	
  	
  Macro	
  strategies	
  add	
  value	
  via	
  
careful	
  beta	
  timing	
  and	
  controlling	
  risk	
  via	
  VaR	
  (Value	
  at	
  Risk)	
  methodologies	
  but,	
  as	
  discussed	
  above,	
  
often	
  deploy	
  leverage	
  and	
  liberal	
  use	
  of	
  options.	
  	
  The	
  power	
  of	
  Macro	
  strategies	
  are	
  found	
  in	
  deep	
  
seeded	
  human	
  responses	
  and	
  tendencies	
  and	
  will	
  not	
  be	
  easily	
  arbitraged	
  away.	
  	
  In	
  fact,	
  as	
  the	
  world	
  
becomes	
  more	
  efficient	
  at	
  a	
  micro	
  (bottom-­‐up)	
  level,	
  the	
  world	
  has	
  become	
  increasingly	
  inefficient	
  at	
  
the	
  macro	
  level	
  (top	
  down).	
  	
  To	
  defend	
  this	
  point	
  famed	
  investor	
  Peter	
  Thiel	
  points	
  out	
  “in	
  the	
  last	
  30	
  
years	
  we	
  have	
  had	
  more	
  boom/bust	
  cycles	
  than	
  in	
  the	
  history	
  of	
  the	
  stock	
  market.”	
  	
  Even	
  in	
  the	
  face	
  of	
  
less	
  efficient	
  markets	
  at	
  the	
  macro	
  level	
  investors	
  often	
  still	
  cling	
  to	
  passive	
  indexes.	
  	
  This	
  behavior	
  
creates	
  alpha	
  generating	
  opportunities	
  for	
  those	
  willing	
  and	
  capable	
  to	
  exploit	
  systematic	
  macro	
  factors.	
  	
  
Human	
  biases,	
  including	
  confirmation,	
  optimism,	
  loss	
  aversion,	
  the	
  planning	
  fallacy,	
  herding,	
  recency	
  
bias,	
  cognitive	
  dissidence,	
  and	
  the	
  story	
  bias12,	
  all	
  create	
  unique	
  behavioral	
  economic	
  tendencies	
  that	
  
cause	
  investors	
  to	
  make	
  forced	
  and	
  unforced	
  errors13.	
  	
  These	
  errors	
  can	
  be	
  exploited	
  through	
  systematic	
  
macroeconomic	
  models	
  and	
  because	
  they	
  are	
  deeply	
  ingrained	
  in	
  humanity	
  they	
  are	
  not	
  easily	
  
arbitraged	
  away,	
  although	
  some	
  conceptually	
  offer	
  a	
  higher	
  probability	
  of	
  success	
  going	
  forward	
  than	
  
others.	
  	
  But	
  can	
  a	
  macro	
  strategy	
  add	
  beta	
  timing	
  value	
  to	
  index	
  funds?	


10
  	
  Bill	
  Harding	
  and	
  Marta	
  Norton,	
  In	
  Practice:	
  A	
  New	
  Guardrail	
  Against	
  Risk,	
  
http://www.morningstar.com/advisor/t/42987553/in-­‐practice-­‐a-­‐new-­‐guardrail-­‐against-­‐risk.htm	
  (February	
  2011).	
  
11
  	
  Yahoo	
  Finance,	
  Market	
  Vectors	
  Oil	
  Services	
  ETF	
  (OIH),	
  http://finance.yahoo.com/q?s=oih&ql=1	
  (August	
  2012).	
  
12
  	
  Barry	
  Ritholtz,	
  Investors	
  10	
  Most	
  Common	
  Mistakes,	
  http://www.ritholtz.com/blog/2012/07/investors-­‐10-­‐most-­‐
common-­‐mistakes/	
  (July	
  2012).	
  
13
  	
  Michael	
  m.	
  Pompain,	
  CFA,	
  Readings	
  7-­‐9	
  Portfolio	
  Management	
  Study	
  Session	
  Chapter	
  3	
  Level	
  III	
  CFA	
  Study	
  
Material-­‐Behavioral	
  Finance,	
  Individual	
  Investors,	
  and	
  Institutional	
  Investors.	


                                                                                                                                                                                                                                                       10	


There	
  is	
  a	
  good	
  deal	
  of	
  research	
  that	
  shows	
  very	
  simplistic	
  macro	
  overlays	
  are	
  effective	
  in	
  adding	
  value	
  
to	
  a	
  buy	
  and	
  hold	
  index	
  strategy.	
  	
  Beta	
  timing	
  indicators	
  shown	
  to	
  add	
  value	
  include	
  the	
  dividend	
  yield	
  
of	
  the	
  S&P	
  50014,	
  the	
  P/E	
  1015,	
  Price	
  to	
  Peak	
  Earnings16,	
  P/E	
  10	
  adjusted	
  for	
  periods	
  of	
  high	
  and	
  low	
  
liquidity17,	
  P/B18,	
  change	
  in	
  liquidity19,	
  volatility20	
  21,	
  and	
  momentum22.	
  	
  	
  In	
  addition,	
  our	
  research	
  shows	
  
changes	
  in	
  credit	
  spreads	
  and	
  deterioration	
  in	
  industrial	
  economic	
  data	
  can	
  add	
  value	
  when	
  used	
  as	
  an	
  
indicator	
  to	
  lower	
  beta.	


Exhibit	
  8:	


Comparison	
  HFRI	
  MACRO	
  Index	
  vs	
  S&P	
  500	
  (Source:	
  	
  HFR)	


14
  	
  Ben	
  Stein	
  and	
  Phil	
  DeMuth,	
  Yes,	
  You	
  Can	
  Time	
  the	
  Market!	
  (Wiley,	
  April	
  2003).	
  
15
  	
  Robert	
  Shiller,	
  Homepage	
  of	
  Robert	
  Shiller,	
  http://www.econ.yale.edu/~shiller/	
  (August	
  2012).	
  
16
  	
  John	
  P.	
  Hussman,	
  Should	
  Come	
  as	
  No	
  Shock	
  to	
  Anyone,	
  http://hussmanfunds.com/wmc/wmc091116.htm	
  
(November	
  2009).	
  
17
  	
  Clarium	
  Capital,	
  A	
  Macro	
  Framework	
  for	
  Valuing	
  the	
  S&P	
  500	
  http://www.scribd.com/doc/14673020/A-­‐Macro-­‐
Framework-­‐for-­‐Equity-­‐Valuation	
  (2009).	
  
18
  	
  Goldman	
  Sachs,	
  “Global	
  Tactical	
  Asset	
  Allocation	
  (GTAA),”	
  Asset	
  Management	
  Primer	
  (2003).	
  
19
  	
  Lubos	
  Pastor	
  and	
  Robert	
  F.	
  Stambaugh,	
  “Liquidity	
  Risk	
  and	
  Expected	
  Stock	
  Returns,”	
  National	
  Bureau	
  of	
  
Economic	
  Research,	
  http://www.nber.org/papers/w8462.pdf	
  (September	
  2001).	
  
20
  Russell	
  Investments,	
  Viewpoint:	
  Volatility-­‐responsive	
  asset	
  allocation	
  
http://www.russell.com/Institutional/research_commentary/PDF/Volatility_responsive_asset_allocation_.pdf	
  
(August	
  2011).	
  
21
  	
  Goldman	
  Sachs,	
  “Global	
  Tactical	
  Asset	
  Allocation	
  (GTAA),”	
  Asset	
  Management	
  Primer	
  (2003).	
  
22
  	
  Mebane	
  T.	
  Faber	
  and	
  Eric	
  W.	
  Richardson,	
  The	
  Ivy	
  Portfolio:	
  How	
  to	
  Invest	
  Like	
  the	
  Top	
  Endowments	
  and	
  Avoid	
  
Bear	
  Markets	
  (Wiley,	
  April	
  2011).	
  

                                                                                                                                                                                                                                                              11	


Our	
  firm	
  has	
  developed	
  a	
  macro	
  model	
  that	
  measures	
  rates	
  of	
  change	
  in	
  credit	
  spreads	
  and	
  industrial	
  
economic	
  data.	
  	
  Back	
  tested	
  to	
  1976	
  the	
  model	
  adds	
  alpha	
  and	
  reduces	
  volatility	
  while	
  keeping	
  turnover	
  
at	
  bay.	
  	
  	
  Exhibit	
  9	
  shows	
  the	
  back-­‐tested	
  results	
  of	
  implementing	
  this	
  strategy	
  as	
  a	
  simple	
  beta	
  timing	
  
approach,	
  literally	
  taking	
  beta	
  from	
  1	
  to	
  0.	
  	
  The	
  strategy	
  is	
  either	
  fully	
  invested	
  in	
  the	
  S&P	
  500	
  or	
  in	
  
money	
  market	
  starting	
  in	
  1976.	
  	
  Over	
  the	
  36	
  year	
  period	
  this	
  macro	
  beta	
  timing	
  model	
  annualized	
  a	
  
compound	
  growth	
  rate	
  of	
  10.55%	
  while	
  the	
  S&P	
  500	
  achieved	
  7.4%.	
  	
  	
  In	
  addition,	
  the	
  model	
  effectively	
  
reduced	
  risk	
  and	
  did	
  so	
  with	
  only	
  9	
  roundtrip	
  trades	
  during	
  this	
  time.	


Exhibit	
  9:	
  	
  Macro	
  Timing	
  model	
  vs	
  S&P	
  500	
  growth	
  of	
  $1000	


Using	
  a	
  macro	
  overlay	
  to	
  determine	
  the	
  appropriate	
  amount	
  of	
  beta	
  risk	
  to	
  take	
  given	
  market	
  conditions	
  
this	
  model	
  adds	
  value	
  over	
  the	
  S&P	
  500	
  index	
  through	
  higher	
  returns	
  and	
  reduced	
  volatility.	
  	
  
Conceptually	
  it	
  makes	
  sense	
  an	
  index	
  weighting	
  portfolio	
  risk	
  according	
  to	
  indicators	
  of	
  market	
  risk	
  
would	
  add	
  value	
  over	
  and	
  above	
  a	
  traditional	
  index.	


Putting	
  it	
  All	
  Together:	


This	
  paper	
  has	
  discussed	
  various	
  techniques	
  that	
  can	
  be	
  used	
  to	
  systematically	
  add	
  value	
  through	
  the	
  
three	
  drivers	
  of	
  alpha.	
  But	
  when	
  used	
  together	
  the	
  results	
  are	
  even	
  more	
  impressive.	


Our	
  optimal	
  strategy	
  mix	
  takes	
  the	
  “best	
  of”	
  all	
  three	
  drivers	
  of	
  alpha.	
  	
  First,	
  we	
  take	
  advantage	
  of	
  
systematic	
  security	
  selection	
  through	
  alpha	
  drivers	
  by	
  maintaining	
  a	
  60%	
  allocation	
  in	
  the	
  S&P	
  500	
  Low	
  
Volatility	
  index.	
  	
  This	
  position	
  has	
  the	
  added	
  advantage	
  of	
  keeping	
  turnover	
  low,	
  the	
  risk	
  of	
  a	
  portfolio	
  

                                                                                                                                                                    12	


blow	
  up	
  low,	
  and	
  establishes	
  a	
  low	
  beta	
  floor	
  from	
  which	
  beta	
  may	
  be	
  increased	
  or	
  decreased	
  
accordingly.	
  	
  Second,	
  we	
  take	
  advantage	
  of	
  beta	
  selection	
  by	
  pre-­‐establishing	
  allocation	
  percentages	
  
and	
  beta	
  drivers.	
  	
  Thirdly,	
  we	
  take	
  advantage	
  of	
  beta	
  timing	
  via	
  a	
  systematic	
  macro	
  approach	
  that	
  
monitors	
  global	
  credit	
  spreads	
  and	
  changes	
  in	
  industrial	
  economic	
  data.	
  	
  Exhibit	
  10	
  shows	
  the	
  results	
  of	
  
combing	
  all	
  three	
  strategies	
  since	
  1991	
  (The	
  first	
  year	
  of	
  the	
  S&P	
  500	
  Low	
  Volatility	
  index.)	
  	
  For	
  this	
  
period	
  the	
  blended	
  strategy	
  delivered	
  a	
  15.22%	
  annualized	
  rate	
  of	
  return	
  versus	
  6.9%	
  for	
  the	
  S&P	
  500	
  
with	
  only	
  three	
  roundtrip	
  trades	
  (above	
  an	
  annual	
  rebalancing	
  trade).	


Exhibit	
  10:	
  Blended	
  Strategy	
  vs	
  S&P	
  500	


                                                                                                      BLENDED
                                                                      S&P 500                         STRATEGY
                               MAX DRAW
                               DOWN                                    56.78%                            29.83%
                               STANDARD
                               DEV                                     17.63%                            14.03%
                               SHARP RATIO                              0.23                              0.74
                               SORTINO
                               RATIO                                     0.28                               1.34

                               *assumes a risk free return of 3%


                                                                                                                                                              13	


For	
  allocation	
  constrained	
  portfolios	
  our	
  research	
  shows	
  that	
  using	
  the	
  beta	
  timing	
  model	
  discussed	
  
above	
  to	
  shift	
  beta	
  within	
  asset	
  classes	
  also	
  generated	
  alpha	
  while	
  lowering	
  volatility.	
  	
  The	
  degree	
  of	
  
outperformance	
  and	
  change	
  in	
  volatility	
  from	
  the	
  original	
  benchmark	
  depends	
  on	
  how	
  aggressive	
  of	
  a	
  
shift	
  is	
  made	
  which	
  is	
  an	
  individual	
  preference.	
  	
  For	
  instance,	
  following	
  the	
  technique	
  described	
  in	
  our	
  
beta	
  timing	
  section	
  above	
  to	
  increase	
  or	
  eliminate	
  exposure	
  to	
  high	
  yield	
  bonds	
  within	
  a	
  fully	
  invested	
  
bond	
  allocation	
  added	
  alpha.	
  	
  Likewise,	
  shifting	
  from	
  the	
  S&P	
  500	
  to	
  the	
  S&P	
  500	
  Low	
  Volatility	
  
considerably	
  reduced	
  volatility	
  and	
  generated	
  alpha	
  while	
  remaining	
  fully	
  invested	
  (See	
  Exhibit	
  10).	
  	
  
Even	
  within	
  sub	
  asset	
  classes,	
  like	
  small	
  cap	
  stocks	
  or	
  emerging	
  markets,	
  throttling	
  between	
  a	
  passive	
  
index	
  and	
  the	
  corresponding	
  low	
  volatility	
  index	
  increased	
  returns	
  and	
  limited	
  downside.	


Exhibit	
  10:	
  S&P	
  500	
  to	
  S&P	
  500	
  Low	
  Volatility	
  Index	
  vs	
  S&P	
  500	


       9000

       8000

       7000
                                                                                                                                                                                                                                                                                                            S&P 500 to
       6000                                                                                                                                                                                                                                                                                                 S&P 500 Low
                                                                                                                                                                                                                                                                                                            Volatility Index
       5000                                                                                                                                                                                                                                                                                                 S&P 500

       4000

       3000

       2000

       1000

          0
              11/19/1990
                           11/19/1991
                                        11/19/1992
                                                     11/19/1993


                                                                               11/19/1995
                                                                                            11/19/1996
                                                                                                         11/19/1997
                                                                                                                      11/19/1998
                                                                                                                                   11/19/1999
                                                                                                                                                11/19/2000
                                                                                                                                                             11/19/2001
                                                                                                                                                                          11/19/2002
                                                                                                                                                                                       11/19/2003


                                                                                                                                                                                                                 11/19/2005
                                                                                                                                                                                                                              11/19/2006
                                                                                                                                                                                                                                           11/19/2007
                                                                                                                                                                                                                                                        11/19/2008
                                                                                                                                                                                                                                                                     11/19/2009
                                                                                                                                                                                                                                                                                  11/19/2010
                                                                                                                                                                                                                                                                                               11/19/2011
                                                                  11/19/1994


                                                                                                                                                                                                    11/19/2004


Discussion:	


Discussed	
  above	
  are	
  a	
  multitude	
  of	
  investment	
  strategies	
  to	
  add	
  value	
  beyond	
  standard	
  indexing.	
  	
  Our	
  
firm	
  uses	
  two	
  basic	
  strategies	
  depending	
  on	
  an	
  individuals’	
  risk	
  tolerance	
  and	
  portfolio	
  constraints.	
  	
  For	
  
clients	
  that	
  desire	
  no	
  active	
  management	
  of	
  any	
  kind	
  we	
  deploy	
  a	
  multi-­‐asset	
  allocation,	
  following	
  the	
  
endowment	
  strategy,	
  while	
  targeting	
  low	
  volatility	
  within	
  each	
  asset	
  class.	
  	
  To	
  the	
  degree	
  we	
  are	
  free	
  to	
  
do	
  so	
  we	
  adjust	
  allocations	
  in-­‐line	
  with	
  our	
  macro	
  model.	
  	
  For	
  clients	
  that	
  seek	
  active	
  management	
  we	
  
deploy	
  the	
  blended	
  strategy	
  as	
  discussed	
  above.	


                                                                                                                                                                                                                                                                                                                          14	


For	
  both	
  of	
  these	
  strategies	
  there	
  is	
  a	
  clear	
  value	
  proposition.	
  	
  	
  By	
  avoiding	
  an	
  incentive	
  fee,	
  charging	
  a	
  
very	
  low	
  management	
  fee	
  and	
  utilizing	
  index	
  funds	
  we	
  are	
  able	
  to	
  pass	
  alpha	
  gains	
  along	
  to	
  the	
  client.	
  	
  
This	
  allows	
  us	
  to	
  avoid	
  the	
  use	
  of	
  leverage,	
  options,	
  or	
  deployment	
  of	
  high	
  beta	
  strategies	
  that	
  we	
  are	
  
inherently	
  risky.	


The	
  value	
  proposition	
  for	
  the	
  investor	
  is	
  further	
  enhanced	
  in	
  that	
  all	
  of	
  our	
  work	
  focuses	
  on	
  robust	
  
(long-­‐term)	
  strategies	
  versus	
  the	
  best	
  performing	
  (short-­‐term).	
  	
  For	
  instance,	
  none	
  of	
  the	
  macro	
  
indicators	
  analyzed	
  were	
  chosen	
  because	
  of	
  the	
  numbers	
  rather	
  they	
  were	
  chosen	
  for	
  their	
  qualitative	
  
attributes	
  and	
  then	
  tested	
  for	
  our	
  strategy.	
  	
  Similarly,	
  allocation	
  percentages	
  were	
  not	
  chosen	
  to	
  
optimize	
  returns	
  they	
  were	
  selected	
  with	
  the	
  aim	
  of	
  keeping	
  risk	
  within	
  reason.	
  	
  Indexes	
  that	
  were	
  
chosen	
  are	
  very	
  liquid,	
  stable,	
  and	
  general	
  (no	
  specialized	
  indexes).	
  	
  Finally,	
  everything	
  is	
  broken	
  down	
  
in	
  a	
  systematic	
  fashion.	
  	
  By	
  not	
  over-­‐optimizing	
  everything	
  our	
  model	
  is	
  highly	
  prepared	
  for	
  the	
  
uncertainty	
  of	
  the	
  future.	


As	
  a	
  final	
  point,	
  the	
  strategies	
  discussed	
  in	
  this	
  paper	
  flip	
  the	
  investment	
  model	
  on	
  its	
  head.	
  	
  Instead	
  of	
  
trying	
  to	
  price	
  stocks	
  or	
  the	
  market	
  itself,	
  our	
  blended	
  strategy	
  prices	
  risk	
  both	
  at	
  the	
  security	
  level	
  and	
  
at	
  the	
  macro	
  level.	
  	
  If	
  anything,	
  our	
  research	
  indicates	
  investors	
  routinely	
  take	
  too	
  much	
  risk.	
  	
  They	
  take	
  
too	
  much	
  risk	
  picking	
  stocks	
  which	
  is	
  why	
  low	
  volatility	
  strategies	
  outperform	
  the	
  CAPM	
  predicts	
  and	
  
they	
  take	
  too	
  much	
  risk	
  even	
  when	
  macro	
  risks	
  are	
  increasing.	
  	
  This	
  is	
  why	
  our	
  macro	
  model	
  reduces	
  
downside	
  volatility	
  and	
  generates	
  alpha.	
  	
  Investors	
  also	
  take	
  too	
  much	
  risk	
  when	
  developing	
  their	
  
investment	
  strategy	
  in	
  that	
  they	
  deploy	
  strategies	
  with	
  little	
  concern	
  for	
  beta	
  or	
  how	
  the	
  portfolio	
  will	
  
be	
  under	
  extreme	
  circumstances.	


Investors	
  have	
  a	
  seemingly	
  infinite	
  amount	
  of	
  choices	
  about	
  how	
  to	
  invest	
  their	
  hard	
  earned	
  dollars	
  yet	
  
many	
  of	
  them	
  continue	
  to	
  invest	
  in	
  strategies	
  that	
  offer	
  a	
  weak	
  value	
  proposition.	
  	
  This	
  paper	
  lays	
  out	
  a	
  
strategy	
  where	
  the	
  value	
  proposition	
  is	
  re-­‐established.	
  	
  	
  By	
  embracing	
  a	
  hybrid	
  model	
  of	
  portfolio	
  
management	
  investors	
  can	
  gain	
  the	
  best	
  of	
  indexing	
  and	
  macro	
  hedge	
  fund	
  models	
  while	
  alleviating	
  
some	
  of	
  the	
  biggest	
  problems.	
  	
  The	
  hybrid	
  portfolio	
  discussed	
  in	
  this	
  paper	
  offers	
  liquidity,	
  low	
  cost,	
  low	
  
turnover,	
  risk	
  reduction,	
  improved	
  alpha	
  and	
  a	
  better	
  alignment	
  of	
  portfolio	
  risk	
  and	
  macro-­‐economic	
  
risks.	


                                                                                                                                                                    15	


Mais conteúdo relacionado

Mais procurados

I fund brochure
I fund brochure I fund brochure
I fund brochure Mark Micek
 
Hff hedge funds101_01-2013
Hff hedge funds101_01-2013Hff hedge funds101_01-2013
Hff hedge funds101_01-2013MJK INC
 
Fmi10e abr ch06
Fmi10e abr ch06 Fmi10e abr ch06
Fmi10e abr ch06 safahaddad7
 
Wealth strategy understanding risks & portfolio creation
Wealth strategy  understanding risks & portfolio creationWealth strategy  understanding risks & portfolio creation
Wealth strategy understanding risks & portfolio creationSudhir Upadhyay
 
Investment strategies of famous investment gurus
Investment strategies of famous investment gurusInvestment strategies of famous investment gurus
Investment strategies of famous investment gurusHarish Manchala
 
Investment Portfolio Management PowerPoint Presentation Slides
Investment Portfolio Management PowerPoint Presentation Slides Investment Portfolio Management PowerPoint Presentation Slides
Investment Portfolio Management PowerPoint Presentation Slides SlideTeam
 
Hedge Fund Fees: An Overview
Hedge Fund Fees: An OverviewHedge Fund Fees: An Overview
Hedge Fund Fees: An OverviewManagedFunds
 
Portfolio construction
Portfolio        constructionPortfolio        construction
Portfolio constructionRavi Singh
 
How to Build an Investment Portfolio
How to Build an Investment PortfolioHow to Build an Investment Portfolio
How to Build an Investment PortfolioBeManaged
 
Hedge Funds: 101
Hedge Funds: 101Hedge Funds: 101
Hedge Funds: 101NICSA
 
hedge fund
 hedge fund hedge fund
hedge fund92_neil
 
Hedge funds. a basic overview
Hedge funds. a basic overviewHedge funds. a basic overview
Hedge funds. a basic overviewMalik Law Group
 
Investment financial instruments
Investment financial instrumentsInvestment financial instruments
Investment financial instrumentsA.W. Berry
 
Financial risk management ppt @ mba finance
Financial risk management  ppt @ mba financeFinancial risk management  ppt @ mba finance
Financial risk management ppt @ mba financeBabasab Patil
 

Mais procurados (20)

I fund brochure
I fund brochure I fund brochure
I fund brochure
 
Hff hedge funds101_01-2013
Hff hedge funds101_01-2013Hff hedge funds101_01-2013
Hff hedge funds101_01-2013
 
hedge funds
hedge fundshedge funds
hedge funds
 
ETFs apalancados by Direxion
ETFs apalancados by DirexionETFs apalancados by Direxion
ETFs apalancados by Direxion
 
Fmi10e abr ch06
Fmi10e abr ch06 Fmi10e abr ch06
Fmi10e abr ch06
 
Hedge Fund Strategies
Hedge Fund StrategiesHedge Fund Strategies
Hedge Fund Strategies
 
Wealth strategy understanding risks & portfolio creation
Wealth strategy  understanding risks & portfolio creationWealth strategy  understanding risks & portfolio creation
Wealth strategy understanding risks & portfolio creation
 
Investment strategies of famous investment gurus
Investment strategies of famous investment gurusInvestment strategies of famous investment gurus
Investment strategies of famous investment gurus
 
Investment Portfolio Management PowerPoint Presentation Slides
Investment Portfolio Management PowerPoint Presentation Slides Investment Portfolio Management PowerPoint Presentation Slides
Investment Portfolio Management PowerPoint Presentation Slides
 
Hedge Fund Fees: An Overview
Hedge Fund Fees: An OverviewHedge Fund Fees: An Overview
Hedge Fund Fees: An Overview
 
Hedge funds
Hedge fundsHedge funds
Hedge funds
 
Portfolio construction
Portfolio        constructionPortfolio        construction
Portfolio construction
 
How to Build an Investment Portfolio
How to Build an Investment PortfolioHow to Build an Investment Portfolio
How to Build an Investment Portfolio
 
Hedge Funds: 101
Hedge Funds: 101Hedge Funds: 101
Hedge Funds: 101
 
hedge fund
 hedge fund hedge fund
hedge fund
 
Hedge funds. a basic overview
Hedge funds. a basic overviewHedge funds. a basic overview
Hedge funds. a basic overview
 
Investment financial instruments
Investment financial instrumentsInvestment financial instruments
Investment financial instruments
 
Hedge Fund Vs Mutual Fund
Hedge Fund Vs Mutual FundHedge Fund Vs Mutual Fund
Hedge Fund Vs Mutual Fund
 
Financial risk management ppt @ mba finance
Financial risk management  ppt @ mba financeFinancial risk management  ppt @ mba finance
Financial risk management ppt @ mba finance
 
Emerald FOF Flyer - v2.0
Emerald FOF Flyer - v2.0Emerald FOF Flyer - v2.0
Emerald FOF Flyer - v2.0
 

Destaque

Mb Star C3 Pro – MB C3 Programmer Use Tips | VtoolShop
Mb Star C3 Pro – MB C3 Programmer Use Tips | VtoolShopMb Star C3 Pro – MB C3 Programmer Use Tips | VtoolShop
Mb Star C3 Pro – MB C3 Programmer Use Tips | VtoolShopAmy joe
 
Kliuch k yspexy
Kliuch k yspexyKliuch k yspexy
Kliuch k yspexyAlhionuska
 
FiNPLACE 2016. Размер имеет значение. Shukhrat Yakubov Google
FiNPLACE 2016. Размер имеет значение. Shukhrat Yakubov GoogleFiNPLACE 2016. Размер имеет значение. Shukhrat Yakubov Google
FiNPLACE 2016. Размер имеет значение. Shukhrat Yakubov GoogleShukhrat Yakubov
 
Putu Wahyuni Utari Dewi - 3249 - IT Teaching Media
Putu Wahyuni Utari Dewi - 3249 - IT Teaching MediaPutu Wahyuni Utari Dewi - 3249 - IT Teaching Media
Putu Wahyuni Utari Dewi - 3249 - IT Teaching Mediayuniutari
 
Phrasal verbs oficina flir
Phrasal verbs oficina flirPhrasal verbs oficina flir
Phrasal verbs oficina flirMary Aby
 
Module5 the school librarian, technology, and the future partc
Module5 the school librarian, technology, and the future partcModule5 the school librarian, technology, and the future partc
Module5 the school librarian, technology, and the future partccbgill38
 
Where do insects live
Where do insects liveWhere do insects live
Where do insects liveMika Agcaoili
 
Introduction to programming c and data structures
Introduction to programming c and data structuresIntroduction to programming c and data structures
Introduction to programming c and data structuresPradipta Mishra
 
Организация массовых и зрелищных мероприятий.
Организация массовых и зрелищных мероприятий.Организация массовых и зрелищных мероприятий.
Организация массовых и зрелищных мероприятий.deniskazakov3979
 
Технологии событийной индустрии для отелей и конференц залов
Технологии событийной индустрии для отелей и конференц заловТехнологии событийной индустрии для отелей и конференц залов
Технологии событийной индустрии для отелей и конференц заловdeniskazakov3979
 
Mc cormick mobilelearningcrashcourse_15.10.12
Mc cormick mobilelearningcrashcourse_15.10.12Mc cormick mobilelearningcrashcourse_15.10.12
Mc cormick mobilelearningcrashcourse_15.10.12Scott McCormick
 
Guia cuatro luz
Guia cuatro luzGuia cuatro luz
Guia cuatro luzLuzParraP
 
World of vertebrates
World of vertebratesWorld of vertebrates
World of vertebratesMika Agcaoili
 

Destaque (19)

Mb Star C3 Pro – MB C3 Programmer Use Tips | VtoolShop
Mb Star C3 Pro – MB C3 Programmer Use Tips | VtoolShopMb Star C3 Pro – MB C3 Programmer Use Tips | VtoolShop
Mb Star C3 Pro – MB C3 Programmer Use Tips | VtoolShop
 
Kliuch k yspexy
Kliuch k yspexyKliuch k yspexy
Kliuch k yspexy
 
FiNPLACE 2016. Размер имеет значение. Shukhrat Yakubov Google
FiNPLACE 2016. Размер имеет значение. Shukhrat Yakubov GoogleFiNPLACE 2016. Размер имеет значение. Shukhrat Yakubov Google
FiNPLACE 2016. Размер имеет значение. Shukhrat Yakubov Google
 
Travelling seeds
Travelling seedsTravelling seeds
Travelling seeds
 
2.4 designer head
2.4 designer head2.4 designer head
2.4 designer head
 
Wj 1983 06_s147
Wj 1983 06_s147Wj 1983 06_s147
Wj 1983 06_s147
 
Dataanalysis2
Dataanalysis2Dataanalysis2
Dataanalysis2
 
Hogyan dolgozunk
Hogyan dolgozunkHogyan dolgozunk
Hogyan dolgozunk
 
Putu Wahyuni Utari Dewi - 3249 - IT Teaching Media
Putu Wahyuni Utari Dewi - 3249 - IT Teaching MediaPutu Wahyuni Utari Dewi - 3249 - IT Teaching Media
Putu Wahyuni Utari Dewi - 3249 - IT Teaching Media
 
Phrasal verbs oficina flir
Phrasal verbs oficina flirPhrasal verbs oficina flir
Phrasal verbs oficina flir
 
Module5 the school librarian, technology, and the future partc
Module5 the school librarian, technology, and the future partcModule5 the school librarian, technology, and the future partc
Module5 the school librarian, technology, and the future partc
 
Where do insects live
Where do insects liveWhere do insects live
Where do insects live
 
Introduction to programming c and data structures
Introduction to programming c and data structuresIntroduction to programming c and data structures
Introduction to programming c and data structures
 
Организация массовых и зрелищных мероприятий.
Организация массовых и зрелищных мероприятий.Организация массовых и зрелищных мероприятий.
Организация массовых и зрелищных мероприятий.
 
Технологии событийной индустрии для отелей и конференц залов
Технологии событийной индустрии для отелей и конференц заловТехнологии событийной индустрии для отелей и конференц залов
Технологии событийной индустрии для отелей и конференц залов
 
Mc cormick mobilelearningcrashcourse_15.10.12
Mc cormick mobilelearningcrashcourse_15.10.12Mc cormick mobilelearningcrashcourse_15.10.12
Mc cormick mobilelearningcrashcourse_15.10.12
 
Guia cuatro luz
Guia cuatro luzGuia cuatro luz
Guia cuatro luz
 
Hrm10ech01
Hrm10ech01Hrm10ech01
Hrm10ech01
 
World of vertebrates
World of vertebratesWorld of vertebrates
World of vertebrates
 

Semelhante a Hybrid Solution to Portfolio Management

Reapproaching Divestment
Reapproaching DivestmentReapproaching Divestment
Reapproaching DivestmentJoli Holmes
 
Study on Mutual Fund is the Better Investment Plan
Study on Mutual Fund is the Better Investment PlanStudy on Mutual Fund is the Better Investment Plan
Study on Mutual Fund is the Better Investment PlanProjects Kart
 
RISK MANAGEMENT IN HEDGE FUNDS.pptx
RISK MANAGEMENT IN HEDGE FUNDS.pptxRISK MANAGEMENT IN HEDGE FUNDS.pptx
RISK MANAGEMENT IN HEDGE FUNDS.pptxuday231983
 
Mutual fund is the better investment plan
Mutual fund is the better investment planMutual fund is the better investment plan
Mutual fund is the better investment planProjects Kart
 
Performance of investment funds berhmani frigerio pan
Performance of investment funds berhmani frigerio panPerformance of investment funds berhmani frigerio pan
Performance of investment funds berhmani frigerio panBERHMANI Samuel
 
Comparative analysis of mutual funds june 2015 2018
Comparative analysis of mutual funds june 2015 2018Comparative analysis of mutual funds june 2015 2018
Comparative analysis of mutual funds june 2015 2018Vyas Ashutosh
 
AIMA-RSM Hedge Fund Survey FINAL
AIMA-RSM Hedge Fund Survey FINALAIMA-RSM Hedge Fund Survey FINAL
AIMA-RSM Hedge Fund Survey FINALAntonella Puca
 
MFA Hedge Funds 101
MFA Hedge Funds 101MFA Hedge Funds 101
MFA Hedge Funds 101ManagedFunds
 
Hedge Fund Strategy Due Diligence
Hedge Fund Strategy Due DiligenceHedge Fund Strategy Due Diligence
Hedge Fund Strategy Due DiligenceGeorgeWang927586
 
RISK MANAGEMNT IN MUTUAL FUNDS
RISK MANAGEMNT IN MUTUAL FUNDSRISK MANAGEMNT IN MUTUAL FUNDS
RISK MANAGEMNT IN MUTUAL FUNDSAbhay G
 
91506566 portfolio-management-process-of-a-financial-institution
91506566 portfolio-management-process-of-a-financial-institution91506566 portfolio-management-process-of-a-financial-institution
91506566 portfolio-management-process-of-a-financial-institutionMuhammad Waseem
 
Bilaspur_28042017fortheimportanceofmutualfundinindia.ppt
Bilaspur_28042017fortheimportanceofmutualfundinindia.pptBilaspur_28042017fortheimportanceofmutualfundinindia.ppt
Bilaspur_28042017fortheimportanceofmutualfundinindia.pptcoolgamelover95
 
ms mutual fund.ppt
ms mutual fund.pptms mutual fund.ppt
ms mutual fund.pptSahidKhan61
 
Bilaspur_28042017.ppt
Bilaspur_28042017.pptBilaspur_28042017.ppt
Bilaspur_28042017.pptdevl5
 
Mutual Funds.pptx
Mutual Funds.pptxMutual Funds.pptx
Mutual Funds.pptxLitty Sylus
 

Semelhante a Hybrid Solution to Portfolio Management (20)

Reapproaching Divestment
Reapproaching DivestmentReapproaching Divestment
Reapproaching Divestment
 
Study on Mutual Fund is the Better Investment Plan
Study on Mutual Fund is the Better Investment PlanStudy on Mutual Fund is the Better Investment Plan
Study on Mutual Fund is the Better Investment Plan
 
RISK MANAGEMENT IN HEDGE FUNDS.pptx
RISK MANAGEMENT IN HEDGE FUNDS.pptxRISK MANAGEMENT IN HEDGE FUNDS.pptx
RISK MANAGEMENT IN HEDGE FUNDS.pptx
 
Mutual fund is the better investment plan
Mutual fund is the better investment planMutual fund is the better investment plan
Mutual fund is the better investment plan
 
Performance of investment funds berhmani frigerio pan
Performance of investment funds berhmani frigerio panPerformance of investment funds berhmani frigerio pan
Performance of investment funds berhmani frigerio pan
 
Comparative analysis of mutual funds june 2015 2018
Comparative analysis of mutual funds june 2015 2018Comparative analysis of mutual funds june 2015 2018
Comparative analysis of mutual funds june 2015 2018
 
AIMA-RSM Hedge Fund Survey FINAL
AIMA-RSM Hedge Fund Survey FINALAIMA-RSM Hedge Fund Survey FINAL
AIMA-RSM Hedge Fund Survey FINAL
 
MFA Hedge Funds 101
MFA Hedge Funds 101MFA Hedge Funds 101
MFA Hedge Funds 101
 
Alternative Solutions
Alternative SolutionsAlternative Solutions
Alternative Solutions
 
Hedge Fund Strategy Due Diligence
Hedge Fund Strategy Due DiligenceHedge Fund Strategy Due Diligence
Hedge Fund Strategy Due Diligence
 
RISK MANAGEMNT IN MUTUAL FUNDS
RISK MANAGEMNT IN MUTUAL FUNDSRISK MANAGEMNT IN MUTUAL FUNDS
RISK MANAGEMNT IN MUTUAL FUNDS
 
SmarterMoney+ Review 2 Spring 2014
SmarterMoney+  Review 2 Spring 2014SmarterMoney+  Review 2 Spring 2014
SmarterMoney+ Review 2 Spring 2014
 
91506566 portfolio-management-process-of-a-financial-institution
91506566 portfolio-management-process-of-a-financial-institution91506566 portfolio-management-process-of-a-financial-institution
91506566 portfolio-management-process-of-a-financial-institution
 
Indu finance
Indu financeIndu finance
Indu finance
 
Bilaspur_28042017fortheimportanceofmutualfundinindia.ppt
Bilaspur_28042017fortheimportanceofmutualfundinindia.pptBilaspur_28042017fortheimportanceofmutualfundinindia.ppt
Bilaspur_28042017fortheimportanceofmutualfundinindia.ppt
 
MUTUAL FUND ICCMAI BILSPUR.pptx
MUTUAL FUND  ICCMAI BILSPUR.pptxMUTUAL FUND  ICCMAI BILSPUR.pptx
MUTUAL FUND ICCMAI BILSPUR.pptx
 
Mutual fund.ppt
Mutual fund.pptMutual fund.ppt
Mutual fund.ppt
 
ms mutual fund.ppt
ms mutual fund.pptms mutual fund.ppt
ms mutual fund.ppt
 
Bilaspur_28042017.ppt
Bilaspur_28042017.pptBilaspur_28042017.ppt
Bilaspur_28042017.ppt
 
Mutual Funds.pptx
Mutual Funds.pptxMutual Funds.pptx
Mutual Funds.pptx
 

Mais de Ben Esget

Crossing the United States Policy Void
Crossing the United States Policy VoidCrossing the United States Policy Void
Crossing the United States Policy VoidBen Esget
 
Successful Investing in a Low Growth Economy: A Historical Perspective
Successful Investing in a Low Growth Economy: A Historical PerspectiveSuccessful Investing in a Low Growth Economy: A Historical Perspective
Successful Investing in a Low Growth Economy: A Historical PerspectiveBen Esget
 
Potash Market Snapshot
Potash Market SnapshotPotash Market Snapshot
Potash Market SnapshotBen Esget
 
BERNANKE GOES GANGNAM STYLE
BERNANKE GOES GANGNAM STYLEBERNANKE GOES GANGNAM STYLE
BERNANKE GOES GANGNAM STYLEBen Esget
 
Mineral Royalty Stream Financing
Mineral Royalty Stream FinancingMineral Royalty Stream Financing
Mineral Royalty Stream FinancingBen Esget
 
5% is the new 1%
5% is the new 1%5% is the new 1%
5% is the new 1%Ben Esget
 
Let them eat McCake
Let them eat McCakeLet them eat McCake
Let them eat McCakeBen Esget
 
U.S. Fiscal Impasse
U.S. Fiscal ImpasseU.S. Fiscal Impasse
U.S. Fiscal ImpasseBen Esget
 
E.U. Economic Forum
E.U. Economic ForumE.U. Economic Forum
E.U. Economic ForumBen Esget
 
Libor Scandal
Libor ScandalLibor Scandal
Libor ScandalBen Esget
 
Bend it like Bernanke
Bend it like BernankeBend it like Bernanke
Bend it like BernankeBen Esget
 
Happy 4th of July!
Happy 4th of July!Happy 4th of July!
Happy 4th of July!Ben Esget
 
Last 15 Years on Wall Street - FULL
Last 15 Years on Wall Street - FULLLast 15 Years on Wall Street - FULL
Last 15 Years on Wall Street - FULLBen Esget
 
THE LAST 15 YEARS ON WALL STREET PART III
THE LAST 15 YEARS ON WALL STREET PART IIITHE LAST 15 YEARS ON WALL STREET PART III
THE LAST 15 YEARS ON WALL STREET PART IIIBen Esget
 
THE LAST 15 YEARS ON WALL STREET PART II
THE LAST 15 YEARS ON WALL STREET PART IITHE LAST 15 YEARS ON WALL STREET PART II
THE LAST 15 YEARS ON WALL STREET PART IIBen Esget
 
THE LAST 15 YEARS ON WALL STREET PART I
THE LAST 15 YEARS ON WALL STREET PART ITHE LAST 15 YEARS ON WALL STREET PART I
THE LAST 15 YEARS ON WALL STREET PART IBen Esget
 
The Average Investor Experience
The Average Investor ExperienceThe Average Investor Experience
The Average Investor ExperienceBen Esget
 

Mais de Ben Esget (18)

Crossing the United States Policy Void
Crossing the United States Policy VoidCrossing the United States Policy Void
Crossing the United States Policy Void
 
Successful Investing in a Low Growth Economy: A Historical Perspective
Successful Investing in a Low Growth Economy: A Historical PerspectiveSuccessful Investing in a Low Growth Economy: A Historical Perspective
Successful Investing in a Low Growth Economy: A Historical Perspective
 
Potash Market Snapshot
Potash Market SnapshotPotash Market Snapshot
Potash Market Snapshot
 
BERNANKE GOES GANGNAM STYLE
BERNANKE GOES GANGNAM STYLEBERNANKE GOES GANGNAM STYLE
BERNANKE GOES GANGNAM STYLE
 
Mineral Royalty Stream Financing
Mineral Royalty Stream FinancingMineral Royalty Stream Financing
Mineral Royalty Stream Financing
 
5% is the new 1%
5% is the new 1%5% is the new 1%
5% is the new 1%
 
Let them eat McCake
Let them eat McCakeLet them eat McCake
Let them eat McCake
 
U.S. Fiscal Impasse
U.S. Fiscal ImpasseU.S. Fiscal Impasse
U.S. Fiscal Impasse
 
E.U. Economic Forum
E.U. Economic ForumE.U. Economic Forum
E.U. Economic Forum
 
Libor Scandal
Libor ScandalLibor Scandal
Libor Scandal
 
TAXMAGEDDON
TAXMAGEDDONTAXMAGEDDON
TAXMAGEDDON
 
Bend it like Bernanke
Bend it like BernankeBend it like Bernanke
Bend it like Bernanke
 
Happy 4th of July!
Happy 4th of July!Happy 4th of July!
Happy 4th of July!
 
Last 15 Years on Wall Street - FULL
Last 15 Years on Wall Street - FULLLast 15 Years on Wall Street - FULL
Last 15 Years on Wall Street - FULL
 
THE LAST 15 YEARS ON WALL STREET PART III
THE LAST 15 YEARS ON WALL STREET PART IIITHE LAST 15 YEARS ON WALL STREET PART III
THE LAST 15 YEARS ON WALL STREET PART III
 
THE LAST 15 YEARS ON WALL STREET PART II
THE LAST 15 YEARS ON WALL STREET PART IITHE LAST 15 YEARS ON WALL STREET PART II
THE LAST 15 YEARS ON WALL STREET PART II
 
THE LAST 15 YEARS ON WALL STREET PART I
THE LAST 15 YEARS ON WALL STREET PART ITHE LAST 15 YEARS ON WALL STREET PART I
THE LAST 15 YEARS ON WALL STREET PART I
 
The Average Investor Experience
The Average Investor ExperienceThe Average Investor Experience
The Average Investor Experience
 

Último

Unveiling Business Expansion Trends in 2024
Unveiling Business Expansion Trends in 2024Unveiling Business Expansion Trends in 2024
Unveiling Business Expansion Trends in 2024Champak Jhagmag
 
Economics, Commerce and Trade Management: An International Journal (ECTIJ)
Economics, Commerce and Trade Management: An International Journal (ECTIJ)Economics, Commerce and Trade Management: An International Journal (ECTIJ)
Economics, Commerce and Trade Management: An International Journal (ECTIJ)ECTIJ
 
The Triple Threat | Article on Global Resession | Harsh Kumar
The Triple Threat | Article on Global Resession | Harsh KumarThe Triple Threat | Article on Global Resession | Harsh Kumar
The Triple Threat | Article on Global Resession | Harsh KumarHarsh Kumar
 
Bladex 1Q24 Earning Results Presentation
Bladex 1Q24 Earning Results PresentationBladex 1Q24 Earning Results Presentation
Bladex 1Q24 Earning Results PresentationBladex
 
Vp Girls near me Delhi Call Now or WhatsApp
Vp Girls near me Delhi Call Now or WhatsAppVp Girls near me Delhi Call Now or WhatsApp
Vp Girls near me Delhi Call Now or WhatsAppmiss dipika
 
Call Girls Near Delhi Pride Hotel, New Delhi|9873777170
Call Girls Near Delhi Pride Hotel, New Delhi|9873777170Call Girls Near Delhi Pride Hotel, New Delhi|9873777170
Call Girls Near Delhi Pride Hotel, New Delhi|9873777170Sonam Pathan
 
Stock Market Brief Deck FOR 4/17 video.pdf
Stock Market Brief Deck FOR 4/17 video.pdfStock Market Brief Deck FOR 4/17 video.pdf
Stock Market Brief Deck FOR 4/17 video.pdfMichael Silva
 
2024 Q1 Crypto Industry Report | CoinGecko
2024 Q1 Crypto Industry Report | CoinGecko2024 Q1 Crypto Industry Report | CoinGecko
2024 Q1 Crypto Industry Report | CoinGeckoCoinGecko
 
Overview of Inkel Unlisted Shares Price.
Overview of Inkel Unlisted Shares Price.Overview of Inkel Unlisted Shares Price.
Overview of Inkel Unlisted Shares Price.Precize Formely Leadoff
 
cost of capital questions financial management
cost of capital questions financial managementcost of capital questions financial management
cost of capital questions financial managementtanmayarora23
 
Call Girls Near Golden Tulip Essential Hotel, New Delhi 9873777170
Call Girls Near Golden Tulip Essential Hotel, New Delhi 9873777170Call Girls Near Golden Tulip Essential Hotel, New Delhi 9873777170
Call Girls Near Golden Tulip Essential Hotel, New Delhi 9873777170Sonam Pathan
 
Tenets of Physiocracy History of Economic
Tenets of Physiocracy History of EconomicTenets of Physiocracy History of Economic
Tenets of Physiocracy History of Economiccinemoviesu
 
NO1 Certified Best Amil In Rawalpindi Bangali Baba In Rawalpindi jadu tona ka...
NO1 Certified Best Amil In Rawalpindi Bangali Baba In Rawalpindi jadu tona ka...NO1 Certified Best Amil In Rawalpindi Bangali Baba In Rawalpindi jadu tona ka...
NO1 Certified Best Amil In Rawalpindi Bangali Baba In Rawalpindi jadu tona ka...Amil baba
 
Market Morning Updates for 16th April 2024
Market Morning Updates for 16th April 2024Market Morning Updates for 16th April 2024
Market Morning Updates for 16th April 2024Devarsh Vakil
 
Financial analysis on Risk and Return.ppt
Financial analysis on Risk and Return.pptFinancial analysis on Risk and Return.ppt
Financial analysis on Risk and Return.ppttadegebreyesus
 
Governor Olli Rehn: Dialling back monetary restraint
Governor Olli Rehn: Dialling back monetary restraintGovernor Olli Rehn: Dialling back monetary restraint
Governor Olli Rehn: Dialling back monetary restraintSuomen Pankki
 
Financial Preparation for Millennia.pptx
Financial Preparation for Millennia.pptxFinancial Preparation for Millennia.pptx
Financial Preparation for Millennia.pptxsimon978302
 
The Core Functions of the Bangko Sentral ng Pilipinas
The Core Functions of the Bangko Sentral ng PilipinasThe Core Functions of the Bangko Sentral ng Pilipinas
The Core Functions of the Bangko Sentral ng PilipinasCherylouCamus
 
Economic Risk Factor Update: April 2024 [SlideShare]
Economic Risk Factor Update: April 2024 [SlideShare]Economic Risk Factor Update: April 2024 [SlideShare]
Economic Risk Factor Update: April 2024 [SlideShare]Commonwealth
 
原版1:1复刻温哥华岛大学毕业证Vancouver毕业证留信学历认证
原版1:1复刻温哥华岛大学毕业证Vancouver毕业证留信学历认证原版1:1复刻温哥华岛大学毕业证Vancouver毕业证留信学历认证
原版1:1复刻温哥华岛大学毕业证Vancouver毕业证留信学历认证rjrjkk
 

Último (20)

Unveiling Business Expansion Trends in 2024
Unveiling Business Expansion Trends in 2024Unveiling Business Expansion Trends in 2024
Unveiling Business Expansion Trends in 2024
 
Economics, Commerce and Trade Management: An International Journal (ECTIJ)
Economics, Commerce and Trade Management: An International Journal (ECTIJ)Economics, Commerce and Trade Management: An International Journal (ECTIJ)
Economics, Commerce and Trade Management: An International Journal (ECTIJ)
 
The Triple Threat | Article on Global Resession | Harsh Kumar
The Triple Threat | Article on Global Resession | Harsh KumarThe Triple Threat | Article on Global Resession | Harsh Kumar
The Triple Threat | Article on Global Resession | Harsh Kumar
 
Bladex 1Q24 Earning Results Presentation
Bladex 1Q24 Earning Results PresentationBladex 1Q24 Earning Results Presentation
Bladex 1Q24 Earning Results Presentation
 
Vp Girls near me Delhi Call Now or WhatsApp
Vp Girls near me Delhi Call Now or WhatsAppVp Girls near me Delhi Call Now or WhatsApp
Vp Girls near me Delhi Call Now or WhatsApp
 
Call Girls Near Delhi Pride Hotel, New Delhi|9873777170
Call Girls Near Delhi Pride Hotel, New Delhi|9873777170Call Girls Near Delhi Pride Hotel, New Delhi|9873777170
Call Girls Near Delhi Pride Hotel, New Delhi|9873777170
 
Stock Market Brief Deck FOR 4/17 video.pdf
Stock Market Brief Deck FOR 4/17 video.pdfStock Market Brief Deck FOR 4/17 video.pdf
Stock Market Brief Deck FOR 4/17 video.pdf
 
2024 Q1 Crypto Industry Report | CoinGecko
2024 Q1 Crypto Industry Report | CoinGecko2024 Q1 Crypto Industry Report | CoinGecko
2024 Q1 Crypto Industry Report | CoinGecko
 
Overview of Inkel Unlisted Shares Price.
Overview of Inkel Unlisted Shares Price.Overview of Inkel Unlisted Shares Price.
Overview of Inkel Unlisted Shares Price.
 
cost of capital questions financial management
cost of capital questions financial managementcost of capital questions financial management
cost of capital questions financial management
 
Call Girls Near Golden Tulip Essential Hotel, New Delhi 9873777170
Call Girls Near Golden Tulip Essential Hotel, New Delhi 9873777170Call Girls Near Golden Tulip Essential Hotel, New Delhi 9873777170
Call Girls Near Golden Tulip Essential Hotel, New Delhi 9873777170
 
Tenets of Physiocracy History of Economic
Tenets of Physiocracy History of EconomicTenets of Physiocracy History of Economic
Tenets of Physiocracy History of Economic
 
NO1 Certified Best Amil In Rawalpindi Bangali Baba In Rawalpindi jadu tona ka...
NO1 Certified Best Amil In Rawalpindi Bangali Baba In Rawalpindi jadu tona ka...NO1 Certified Best Amil In Rawalpindi Bangali Baba In Rawalpindi jadu tona ka...
NO1 Certified Best Amil In Rawalpindi Bangali Baba In Rawalpindi jadu tona ka...
 
Market Morning Updates for 16th April 2024
Market Morning Updates for 16th April 2024Market Morning Updates for 16th April 2024
Market Morning Updates for 16th April 2024
 
Financial analysis on Risk and Return.ppt
Financial analysis on Risk and Return.pptFinancial analysis on Risk and Return.ppt
Financial analysis on Risk and Return.ppt
 
Governor Olli Rehn: Dialling back monetary restraint
Governor Olli Rehn: Dialling back monetary restraintGovernor Olli Rehn: Dialling back monetary restraint
Governor Olli Rehn: Dialling back monetary restraint
 
Financial Preparation for Millennia.pptx
Financial Preparation for Millennia.pptxFinancial Preparation for Millennia.pptx
Financial Preparation for Millennia.pptx
 
The Core Functions of the Bangko Sentral ng Pilipinas
The Core Functions of the Bangko Sentral ng PilipinasThe Core Functions of the Bangko Sentral ng Pilipinas
The Core Functions of the Bangko Sentral ng Pilipinas
 
Economic Risk Factor Update: April 2024 [SlideShare]
Economic Risk Factor Update: April 2024 [SlideShare]Economic Risk Factor Update: April 2024 [SlideShare]
Economic Risk Factor Update: April 2024 [SlideShare]
 
原版1:1复刻温哥华岛大学毕业证Vancouver毕业证留信学历认证
原版1:1复刻温哥华岛大学毕业证Vancouver毕业证留信学历认证原版1:1复刻温哥华岛大学毕业证Vancouver毕业证留信学历认证
原版1:1复刻温哥华岛大学毕业证Vancouver毕业证留信学历认证
 

Hybrid Solution to Portfolio Management

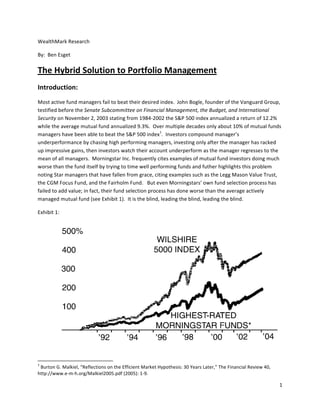
  • 1. WealthMark  Research   By:    Ben  Esget   The  Hybrid  Solution  to  Portfolio  Management       Introduction:   Most  active  fund  managers  fail  to  beat  their  desired  index.    John  Bogle,  founder  of  the  Vanguard  Group,   testified  before  the  Senate  Subcommittee  on  Financial  Management,  the  Budget,  and  International   Security  on  November  2,  2003  stating  from  1984-­‐2002  the  S&P  500  index  annualized  a  return  of  12.2%   while  the  average  mutual  fund  annualized  9.3%.    Over  multiple  decades  only  about  10%  of  mutual  funds   managers  have  been  able  to  beat  the  S&P  500  index1.    Investors  compound  manager’s   underperformance  by  chasing  high  performing  managers,  investing  only  after  the  manager  has  racked   up  impressive  gains,  then  investors  watch  their  account  underperform  as  the  manager  regresses  to  the   mean  of  all  managers.    Morningstar  Inc.  frequently  cites  examples  of  mutual  fund  investors  doing  much   worse  than  the  fund  itself  by  trying  to  time  well  performing  funds  and  futher  highlights  this  problem   noting  Star  managers  that  have  fallen  from  grace,  citing  examples  such  as  the  Legg  Mason  Value  Trust,   the  CGM  Focus  Fund,  and  the  Fairholm  Fund.      But  even  Morningstars’  own  fund  selection  process  has   failed  to  add  value;  in  fact,  their  fund  selection  process  has  done  worse  than  the  average  actively   managed  mutual  fund  (see  Exhibit  1).    It  is  the  blind,  leading  the  blind,  leading  the  blind.   Exhibit  1:                                                                                                                               1  Burton  G.  Malkiel,  “Reflections  on  the  Efficient  Market  Hypothesis:  30  Years  Later,”  The  Financial  Review  40,   http://www.e-­‐m-­‐h.org/Malkiel2005.pdf  (2005):  1-­‐9.   1    
  • 2. Morningstar  4  and  5  star  funds  versus  the  Wilshire  5000  index  *based  on  equal  investment  in  55   funds,  after  expenses,  loads  and  redemption  fees.   Source:  Hulbert  Financial  Digest   Exhibit  2  shows  historically  hedge  funds  have  achieved  higher  returns  than  traditional  indexes,  especially   when  adjusted  for  risk.      From  1994-­‐2011  hedge  funds  returned  9.07%  annualized  while  stocks  and   bonds  returned  7.18%  and  6.25%  annualized,  respectively.           Exhibit  2:     Source:  Center  for  Hedge  Fund  Research   Hedge  funds  come  with  unique  problems  that  do  not  make  the  extra  alpha  achieved  risk  free.    One  of   the  major  problems  with  hedge  funds  is  the  extreme  fee  structure.    Traditionally  hedge  funds  have   charged  a  2%  management  fee  and  a  20%  incentive  fee.    Fees  have  been  coming  down  over  the  last  18   years,  but  during  those  18  years  hedge  funds  pocketed  28.1%  of  profits  generated  in  the  portfolios2.       Hedge  funds  generally  use  leverage  to  enhance  returns  both  directly  and  at  the  security  level.    They   deploy  leverage  directly  by  accessing  lines  of  credit  and  indirectly  through  use  of  options  and  futures.    In   addition,  hedge  funds  are  usually  not  transparent  and  quite  often  illiquid.    This  creates  a  very  unique   situation  where  there  is  a  disjoint  in  distribution  of  information  between  the  potential  investor  and  the   fund  manager  as  to  how  much  risk  is  involved  with  the  fund,  and  how  robust  the  funds  strategy  is  going   forward.    Warren  Buffett  is  famous  for  saying  “When  the  tide  goes  out  you  see  who  is  swimming   naked.”    During  the  economic  collapse  of  2008  many  hedge  fund  investors  were  dismayed  to  discover                                                                                                                             2  Laurence  Fletcher,  Managers  Pocket  28%  of  Hedge  Fund  Profits  –  Study,   http://www.reuters.com/article/2012/04/24/us-­‐hedgefunds-­‐study-­‐idUSBRE83N0JR20120424  (April  2012).   2    
  • 3. their  funds  using  copious  leverage  and  many  funds  “locked”  assets  allowing  liquidity  at  the  managers’   discretion.    Hedge  funds  also  display  massive  variance  of  the  individual  fund’s  performance.    Unlike   mutual  funds  where  most  simply  underperform  an  index,  hedge  funds  often  completely  collapse  or   experience  massive  losses.    Finally,  hedge  funds  are  required  by  law  to  set  net  worth  minimums,  limit   their  number  of  investors  and  are  restricted  in  how  they  market  in  an  effort  to  protect  unsophisticated   investors  from  risk.    To  offset  these  government  interventions  hedge  funds  usually  set  high  minimum   investment  amounts  to  maximize  their  assets  per  fund.       Overall,  the  portfolio  management  industry  lacks  a  clear  value  proposition  for  the  investor.    Where   outperformance  is  seen  it  is  often  overpriced,  difficult  to  predict  going  forward,  and  comes  with  unique   characteristics  which  generally  involve  excess  risk.    A  new  style  of  portfolio  management  is  needed  that   eliminates  these  issues  and  restores  the  investor  value  proposition.   Alpha  demystified:   There  are  three  key  ways  portfolio  managers  can  add  alpha  outside  of  employing  leverage.       1. Security  selection   2. Market  timing     3. Beta  selection     Source:  Investcorp   Security  selection  can  be  any  individual  investment  form  of  holding,  including  but  not  limited  to,  an   individual  stock,  bond,  index,  piece  of  real  estate,  an  option  or  a  futures  contract.    Beta  timing  is  the   practice  of  moving  allocations  within  a  portfolio  as  a  way  of  increasing  or  decreasing  risk.    Beta  selection   is  the  fund  managers’  choice  of  how  much  risk  in  relation  to  the  market  to  take.       The  vast  majority  of  portfolio  managers  attempt  to  add  value  through  only  one  or  two  of  these   methods.    Most  managers  often  do  so  in  a  discretionary  way  and,  as  discussed  above,  either  come  up   short  or  create  a  portfolio  exposed  to  very  unique  risks  and  exorbitant  fees.    In  order  to  combat  these   issues  we  recommend  systematically  adding  value  through  all  three  drivers  of  alpha.   Eliminating  Forced  and  Unforced  Errors:   3    
  • 4. In  investing,  like  baseball,  there  are  forced  and  unforced  errors.    Forced  errors  are  defined  as:  a  miss   caused  by  an  opponent’s  good  play.    Unforced  errors  are  defined  as:  an  error  in  service  or  a  return  shot   that  cannot  be  attributed  to  any  factor  other  than  poor  judgment  and  execution  by  the  player3.     Investors  can  greatly  reduce  unforced  errors  by  taking  a  systematic  approach  to  investing  because  it   greatly  reduces  the  chance  of  making  mistakes.    Indexes  are  a  great  example  of  this  since  indexes  are  a   manmade  systematized  approach  to  investing.    Individual  investors  like  mutual  fund  managers  often  fail   to  outperform  the  S&P  500  which  is  a  manmade  index.    Some  indexes  however  have  actually  fared   better  than  the  S&P  500.      Since  its’  inception  the  NASDAQ  index  has  outperformed  the  S&P  500  albeit   with  much  higher  volatility  (See  Exhibit  3).    Since  1990  the  global  bond  index  has  outperformed  the  S&P   500,  but  did  have  very  long  periods  of  underperformance  (See  Exhibit  2).   Exhibit  3:     The  probability  of  making  a  forced  error  goes  up  as  the  volume  of  trades  and  transactions  increase   because  there  is  a  chance  that  your  positioning  will  be  incorrect.    Each  transaction  exponentially   increases  the  odds  of  mistakes  compounding  while  every  transaction  increases  tax  liability  and   transaction  costs.    For  these  reason  robust  investment  strategies  should  not  only  be  systematic  but  will   have  a  better  chance  at  future  success  if  they  are  semi-­‐passive  with  limited  trading  limiting  the   opportunities  for  forced  or  unforced  errors.    Warren  Buffet  states  that  as  he  gets  older  his  holding  times   get  longer  and  longer  because  “When  you  sell  you  have  to  be  right  twice,  once  when  you  sell  and  once   when  you  buy  again.”                                                                                                                             3  Wikipedia,  Glossary  of  Tennis  Terms  -­‐  Unforced  Error,  http://en.wikipedia.org/wiki/Unforced_error#U.   4    
  • 5. Lunch:    Not  Free,  but  More  of  It:   Academic  and  Industry  research  reveal  four  aspects  of  stocks  that  display  a  persistent  and  robust  ability   to  generate  alpha  systematically:   1. Value   2. Momentum   3. Dividends     4. Volatility   The  vast  majority  of  academic  and  industry  research  is  in  the  area  of  valuation.    Over  time  value  stocks   have  outperformed  other  stocks  whether  you  define  value  as  EV/EBITDA  (Enterprise  Value/  Earnings   Before  Interest,  Taxes,  Depreciation  and  Amortization,  EV/GP  (Enterprise  Value/Gross  Profit),  P/E  (Price   to  Earnings),  P/B  (Price  to  Book),  or  EV/FCF  (Enterprise  Value/Free  Cash  Flow).   Exhibit  4:     Source:    Gray  and  Carlisle,  “Quantitative  Value”,  Due  2013     Many  mutual  fund  managers  and  some  hedge  fund  managers  classify  themselves  as  value  investors.     Yet,  even  as  value  stocks  outperform  the  index  most  of  these  managers  fall  short.    Interestingly,  there  is   a  large  body  of  research  indicating  that  the  belief  humans  add  value  above  and  beyond  a  quantitative   model  is  incorrect.    The  data  shows  that  quant  models  are  the  ceiling  of  performance  and  human   5    
  • 6. decisions  not  only  don’t  enhance  performance  but  actually  diminish  it.4    Perhaps  it  is  cognitive   dissidence,  perhaps  it  is  the  high  level  of  testosterone  on  Wall  Street5,  or  perhaps  it  is  boyhood  fantasies   of  becoming  Warren  Buffet,  but  whatever  the  reason,  money  managers  seem  incapable  of  accepting  a   passive  approach  to  value.     Momentum  investment  strategies,  also  known  as  trend  following,  have  been  well  documented  as  a  way   to  add  alpha.    For  years  trend  followers  established  themselves  as  managed  futures  hedge  funds  but   more  recently  this  strategy  has  been  established  as  a  value  added  way  to  buy  stocks.    In  their  research   paper  “Does  Trend  Following  Work  on  Stocks?”  Willcox  and  Critenden  show  that  using  momentum  as   criteria  to  buying  and  selling  stocks  added  substantial  value  over  the  basic  index  (See  exhibit  5).     Exhibit  5:       Source:    Blackstar  Equity.     Equity  research  from  Goldman  Sachs  and  Dorsey  Wright  show  similar  results  both  on  a  hypothetical   back  tested  basis  and  on  a  real  time  performance  basis.                                                                                                                               4  EYQUM  Investment  Management,  The  Case  for  Quantitative  Value  Investment,   http://www.scribd.com/doc/97001708/Case-­‐for-­‐Quantitative-­‐Value-­‐Eyquem-­‐Global-­‐Strategy-­‐20120613  (June   2012).   5  Sylvia  Ann  Hewlett,  Harvard  Business  Review:  Too  Much  Testosterone  on  Wall  Street?,   http://blogs.hbr.org/hbr/hewlett/2009/01/too_much_testosterone_on_wall.html  (January  2009).   6    
  • 7. Picking  stocks  based  on  dividend  yield  is  another  way  to  systematically  enhance  returns.    Similar  to  value   investing,  dividends  appear  to  add  incrementally  more  value  (See  Exhibit  6).    In  the  “Little  Book  of  Big   Dividends”,  Carlson  shows  that  not  only  does  buying  stocks  in  accordance  with  the  dividend  yield  add   value  but  more  value  can  be  added  when  run  through  an  algorithm  for  safety  as  well.    Professor  Jeremy   Siegel’s  research  shows  that  dividend  stocks  have  added  additional  alpha  going  back  as  far  as  data  exists   (1800’s).               Exhibit  6:   +   Source:  Credit  Suisse,  2011     In  recent  years  the  concept  of  a  low  volatility,  or  low  beta  index  (also  called  low-­‐variance,)  has  gained   popularity  as  a  wave  of  academic  research  shows  this  strategy  to  add  alpha.    One  of  the  more   interesting  aspects  of  low  volatility  stocks  is  that  they  appear  to  have  a  bimodal  distribution  of  beta   depending  on  market  conditions.    During  bull  markets  low  volatility  stocks  have  historically  had  a  beta   close  to  1  and  often  outperform  the  market  as  a  whole  during  this  period6.    During  bear  markets  low   volatility  stocks  have  historically  displayed  low  beta  and  have  proven  a  natural  hedge  against                                                                                                                             6  Pim  van  Vliet,  “Ten  Things  You  Should  Know  About  Low-­‐Volatility  Investing,”  The  Journal  of  Investing  (Winter   2011):  141-­‐143.   7    
  • 8. drawdowns7.    In  1990,  S&P  started  its  own  index  that  tracks  the  100  lowest  volatility  stocks  within  the   S&P  500  for  the  last  trading  year  and  the  results  are  impressive  (See  Exhibit  7).    Other  researchers  have   looked  back  further,  using  back-­‐tested  hypothetical  indexes.    This  work  showed  similar  results  to  that  of   S&P.    One  of  the  more  interesting  pieces  of  research  was  published  in  the  Journal  of  Portfolio   Management  in  1991  entitled  “Beta  and  Return”  by  Fisher  Black.    They  show  from  1926  to  1991  “low-­‐ beta  stocks  did  better  than  the  CAPM  (Capital  Asset  Pricing  Model)  predicts,  and  high  beta  stocks  did   worse.”    He  explains  how  this  anomaly  is  not  decreasing  in  significance  but  rather  is  increasing,  “If   anything,  the  pattern  looks  stronger  (from  1965-­‐1991)  than  it  did  for  1926-­‐1965  period.”    Interestingly,   in  1991  Black  conceded  he  had  no  way  of  knowing  if  low  volatility  stocks  would  continue  to  outperform   going  forward,  but  we  can  now  see  they  definitely  have.    Similar  results  have  been  shown  by  Robeco   Asset  Management,  Russell  Investments,  and  Thorley  and  Perry  of  BYU.     Exhibit  7:       Source:  S&P  Research     Investors  should  consider  several  things  when  deciding  if  and  how  to  use  any  of  the  four  strategies  listed   above.    The  most  important  considerations  are  the  likelihood  that  a  strategy  will  continue  to  work  going   forward,  the  investor’s  ability  to  stick  with  the  strategy  and  the  turnover  within  the  strategy.      It  should   come  as  no  surprise  that  each  of  the  strategies  discussed  above  is  not  a  free  lunch.    Each  strategy  has   long  periods  of  time  where  it  underperforms  other  indexes,  sometimes  significantly.    At  points  of   underperformance  the  investor  must  decide  whether  to  stick  with  a  strategy  based  on  its  long-­‐term   merits  or  throw  in  the  towel  for  a  different  strategy.    In  my  opinion,  this  is  the  number  one  reason                                                                                                                             7  Pim  van  Vliet,  Low-­volatility  investing:  a  long-­term  perspective,   http://www.robeco.com/professionals/insights/quantitative-­‐investing/low-­‐volatility-­‐investing/low-­‐ volatility-­‐investing-­‐a-­‐long-­‐term-­‐perspective.jsp  (January  2012).   8    
  • 9. investors  fail  to  achieve  above  average  performance.      This  dilemma  is  toughest  with  momentum   strategies  because  they  are  notoriously  volatile  (sharp  and  sudden  losses  known  as  drawdowns)  and   have  high  transaction  volumes  leading  to  a  higher  chance  of  errors.    Drawdowns  are  a  measure  of   investor  pain,  and  human  psychology  is  such  that  investors  often  evaluate  how  much  pain  is  worth  a   unit  of  gain.    Large  drawdowns  coupled  with  high  transaction  volumes  will  make  this  strategy  difficult  for   most  investors  to  stick  with.    Value,  Dividends,  and  Low  Volatility  strategies  are  all  lower  turnover  giving   the  investor  a  better  chance  of  sticking  with  the  strategy.         Only  a  Low  Volatility  portfolio  by  design  will  limit  downside  risk.    The  degree  to  which  value  stocks  and   high  dividend  portfolios  limit  downside  risk  is  much  more  uncertain.    Examining  the  market  crash  of   2008,  value  metrics  showed  bank  stocks  to  be  significantly  undervalued  and  banks  appeared  on  most   dividend  screens  as  the  highest  yielding  stocks.    Of  course,  bank  stocks  were  some  of  the  hardest  hit   during  the  2008  market  collapse  leaving  many  of  these  portfolios  significantly  underperforming  other   indexes  and  investors  facing  the  dilemma  discussed  above.    The  S&P  Low  Volatility  index  however,by   design  is  low  volatility  and  experiences  significantly  less  downside.    The  S&P  500  Low  Volatility  index   includes  a  high  degree  of  value  stocks  and  both  currently  and  historically  boosts  a  higher  dividend  yield   than  the  S&P  500  index.    Low  volatility  portfolios  have  the  advantage  of  being  value  oriented  and  high   yielding;  but  value  portfolios  and  high  yielding  portfolios  do  not  necessarily  boast  low  volatility.    Low   volatility  portfolios  have  conceptual  advantages  as  well,  primarily,  because  they  are  difficult  to  arbitrage   away.    Not  only  do  the  portfolios  tend  to  favor  some  of  the  largest  most  liquid  stocks  in  the  world  these   portfolios  are  not  designed  to  “outperform”  but  rather  reduce  volatility.    In  a  world  where  portfolio   managers  are  paid  handsomely  for  outperformance  it  is  irrational  for  portfolio  managers  to  focus  on  a   strategy  that  is  not  designed  for  explicit  outperformance  (never  mind  the  difficulty  marketing  such  a   strategy  during  a  raging  bull  market)  thus  creating  a  situation  where  a  known  driver  of  alpha  is  left   underutilized.         Picking  Your  Poison:     Choosing  how  much  risk  to  accept  during  portfolio  construction  is  like  choosing  poison;  at  some  point   any  amount  of  incremental  risk  will  sting.    The  world  of  beta  is  infinite,  ranging  from;  cash  with  a  beta  of   zero  to  penny  stocks  and  options  often  approaching  Vegas  odds.    Choosing  the  right  amount  of   incremental  risk  is  an  extremely  complex  concept  where  even  the  best  portfolio  managers  quite  often   underestimate  the  extremities  within  markets89.    One  of  the  best  ways  to  construct  a  robust  portfolio  is   to  find  a  baseline  beta  for  your  portfolio  and  incrementally  add  or  subtract  beta  accordingly.    In  a   portfolio  where  only  broad  based  liquid  indexes  are  used,  securities  and  allocations  should  be   preselected  in  a  way  to  systematically  increase  or  reduce  risk.    By  preselecting  betas  and  asset  allocation   for  robust  portfolio  performance  under  periods  of  extreme  market  duress,  the  portfolio  manager  has  a   higher  probability  of  avoiding  the  large  losses  seen  by  many  hedge  funds  as  well  as  creating  a  strategy   that  is  easier  for  investors  to  stick  with.     The  beta  of  the  S&P  Low  Volatility  index  is  .57  while  that  of  the  S&P  500  is  1  .  This  means  for  every  1%   the  S&P  500  moves,  the  Low  Volatility  index  moves  .57%,  on  a  daily  basis.    We  set  a  baseline  beta  to  be   that  of  the  S&P  Low  Volatility  index.    Thus,  any  incremental  increase  or  decrease  in  beta  from  this                                                                                                                             8  Roger  Lowenstein,  When  Genius  Failed:  The  Rise  and  Fall  of  Long-­‐Term  Capital  Management  (Random  House   Trade  Paperbacks,  2001).   9  Nassim  Nicholas  Taleb,  The  Black  Swan:  Second  Edition:  The  Impact  of  the  Highly  Improbable:  With  a  new  section:   "On  Robustness  and  Fragility  (Random  House  Trade  Paperbacks;  2  edition,  May  2010).   9    
  • 10. starting  point  must  be  justified  and  should  be  done  in  a  very  controlled  way.    To  reduce  beta  we   incrementally  add  portions  of  the  Barclays  bond  aggregate  and  to  increase  beta  we  incrementally  add   portions  of  the  NASDAQ  index,  up  to  60%.    The  beta  of  the  Barclays  bond  aggregate  against  the  S&P  500   is  .17  with  a  .20  correlation  and  the  beta  of  the  NASDAQ  against  the  S&P  500  is  1.18  with  a  correlation   of  .9210.    Notice,  the  highest  beta  we  are  willing  to  accept  in  any  portion  of  our  portfolio  is  only  1.18  and   this  is  blended  with  an  index  with  a  beta  of  .57  bringing  the  overall  maximum  portfolio  beta  to  .814   (much  lower  than  the  S&P  500).    For  reference  the  S&P  High  Beta  index  has  a  beta  of  1.7  and  the  Oil   Service  Sector  index  has  a  beta  of  1.4711.  The  standard  deviation  of  the  S&P  Low  Volatility  index,  the   Barclays  Bond  Aggregate  index  and  the  NASDAQ  are,  11.37%,  2.86%  and  18.43%,  respectively.    By   systematically  controlling  the  beta  in  the  portfolio,  the  portfolio  manager  increases  the  probability  of   avoiding  extreme  losses,  enhancing  investors’  ability  to  stick  with  the  portfolio  during  extreme   conditions,  the  probability  or  repeatability  of  performance,  and  alpha.         Macro  Advantage:     Beta  timing  has  a  terrible  reputation  littered  with  high  frequency  trading  styles  and  massive  losses  but   let  us  be  clear,  any  type  of  portfolio  change  is  beta  timing.    The  decision  to  rebalance  a  portfolio,  sell  one   stock  and  buy  another,  or  implement  tactical  asset  allocation  are  all  decision  that  involve  changing  the   beta  mix  of  a  portfolio  and  are  therefore  market  timing.    As  discussed  above,  such  decisions  can  be   made  in  a  systematic  way  or  in  a  haphazard  way.      Even  indexes  perform  some  market  timing  when  they   rebalance  the  indices.    In  its  purest  form,  beta  timing  is  going  from  100%  in  the  S&P  500  to  100%  cash,   moving  beta  from  1  to  0;  any  other  portfolio  reconstruction  is  simply  the  same  thing  to  a  lesser  degree.         Macro  strategies  can  increase  alpha  while  reducing  risk  (See  Exhibit  8).    Macro  strategies  add  value  via   careful  beta  timing  and  controlling  risk  via  VaR  (Value  at  Risk)  methodologies  but,  as  discussed  above,   often  deploy  leverage  and  liberal  use  of  options.    The  power  of  Macro  strategies  are  found  in  deep   seeded  human  responses  and  tendencies  and  will  not  be  easily  arbitraged  away.    In  fact,  as  the  world   becomes  more  efficient  at  a  micro  (bottom-­‐up)  level,  the  world  has  become  increasingly  inefficient  at   the  macro  level  (top  down).    To  defend  this  point  famed  investor  Peter  Thiel  points  out  “in  the  last  30   years  we  have  had  more  boom/bust  cycles  than  in  the  history  of  the  stock  market.”    Even  in  the  face  of   less  efficient  markets  at  the  macro  level  investors  often  still  cling  to  passive  indexes.    This  behavior   creates  alpha  generating  opportunities  for  those  willing  and  capable  to  exploit  systematic  macro  factors.     Human  biases,  including  confirmation,  optimism,  loss  aversion,  the  planning  fallacy,  herding,  recency   bias,  cognitive  dissidence,  and  the  story  bias12,  all  create  unique  behavioral  economic  tendencies  that   cause  investors  to  make  forced  and  unforced  errors13.    These  errors  can  be  exploited  through  systematic   macroeconomic  models  and  because  they  are  deeply  ingrained  in  humanity  they  are  not  easily   arbitraged  away,  although  some  conceptually  offer  a  higher  probability  of  success  going  forward  than   others.    But  can  a  macro  strategy  add  beta  timing  value  to  index  funds?                                                                                                                                   10  Bill  Harding  and  Marta  Norton,  In  Practice:  A  New  Guardrail  Against  Risk,   http://www.morningstar.com/advisor/t/42987553/in-­‐practice-­‐a-­‐new-­‐guardrail-­‐against-­‐risk.htm  (February  2011).   11  Yahoo  Finance,  Market  Vectors  Oil  Services  ETF  (OIH),  http://finance.yahoo.com/q?s=oih&ql=1  (August  2012).   12  Barry  Ritholtz,  Investors  10  Most  Common  Mistakes,  http://www.ritholtz.com/blog/2012/07/investors-­‐10-­‐most-­‐ common-­‐mistakes/  (July  2012).   13  Michael  m.  Pompain,  CFA,  Readings  7-­‐9  Portfolio  Management  Study  Session  Chapter  3  Level  III  CFA  Study   Material-­‐Behavioral  Finance,  Individual  Investors,  and  Institutional  Investors.       10    
  • 11. There  is  a  good  deal  of  research  that  shows  very  simplistic  macro  overlays  are  effective  in  adding  value   to  a  buy  and  hold  index  strategy.    Beta  timing  indicators  shown  to  add  value  include  the  dividend  yield   of  the  S&P  50014,  the  P/E  1015,  Price  to  Peak  Earnings16,  P/E  10  adjusted  for  periods  of  high  and  low   liquidity17,  P/B18,  change  in  liquidity19,  volatility20  21,  and  momentum22.      In  addition,  our  research  shows   changes  in  credit  spreads  and  deterioration  in  industrial  economic  data  can  add  value  when  used  as  an   indicator  to  lower  beta.           Exhibit  8:     Comparison  HFRI  MACRO  Index  vs  S&P  500  (Source:    HFR)                                                                                                                               14  Ben  Stein  and  Phil  DeMuth,  Yes,  You  Can  Time  the  Market!  (Wiley,  April  2003).   15  Robert  Shiller,  Homepage  of  Robert  Shiller,  http://www.econ.yale.edu/~shiller/  (August  2012).   16  John  P.  Hussman,  Should  Come  as  No  Shock  to  Anyone,  http://hussmanfunds.com/wmc/wmc091116.htm   (November  2009).   17  Clarium  Capital,  A  Macro  Framework  for  Valuing  the  S&P  500  http://www.scribd.com/doc/14673020/A-­‐Macro-­‐ Framework-­‐for-­‐Equity-­‐Valuation  (2009).   18  Goldman  Sachs,  “Global  Tactical  Asset  Allocation  (GTAA),”  Asset  Management  Primer  (2003).   19  Lubos  Pastor  and  Robert  F.  Stambaugh,  “Liquidity  Risk  and  Expected  Stock  Returns,”  National  Bureau  of   Economic  Research,  http://www.nber.org/papers/w8462.pdf  (September  2001).   20 Russell  Investments,  Viewpoint:  Volatility-­‐responsive  asset  allocation   http://www.russell.com/Institutional/research_commentary/PDF/Volatility_responsive_asset_allocation_.pdf   (August  2011).   21  Goldman  Sachs,  “Global  Tactical  Asset  Allocation  (GTAA),”  Asset  Management  Primer  (2003).   22  Mebane  T.  Faber  and  Eric  W.  Richardson,  The  Ivy  Portfolio:  How  to  Invest  Like  the  Top  Endowments  and  Avoid   Bear  Markets  (Wiley,  April  2011).   11    
  • 12. Our  firm  has  developed  a  macro  model  that  measures  rates  of  change  in  credit  spreads  and  industrial   economic  data.    Back  tested  to  1976  the  model  adds  alpha  and  reduces  volatility  while  keeping  turnover   at  bay.      Exhibit  9  shows  the  back-­‐tested  results  of  implementing  this  strategy  as  a  simple  beta  timing   approach,  literally  taking  beta  from  1  to  0.    The  strategy  is  either  fully  invested  in  the  S&P  500  or  in   money  market  starting  in  1976.    Over  the  36  year  period  this  macro  beta  timing  model  annualized  a   compound  growth  rate  of  10.55%  while  the  S&P  500  achieved  7.4%.      In  addition,  the  model  effectively   reduced  risk  and  did  so  with  only  9  roundtrip  trades  during  this  time.         Exhibit  9:    Macro  Timing  model  vs  S&P  500  growth  of  $1000         Using  a  macro  overlay  to  determine  the  appropriate  amount  of  beta  risk  to  take  given  market  conditions   this  model  adds  value  over  the  S&P  500  index  through  higher  returns  and  reduced  volatility.     Conceptually  it  makes  sense  an  index  weighting  portfolio  risk  according  to  indicators  of  market  risk   would  add  value  over  and  above  a  traditional  index.         Putting  it  All  Together:     This  paper  has  discussed  various  techniques  that  can  be  used  to  systematically  add  value  through  the   three  drivers  of  alpha.  But  when  used  together  the  results  are  even  more  impressive.           Our  optimal  strategy  mix  takes  the  “best  of”  all  three  drivers  of  alpha.    First,  we  take  advantage  of   systematic  security  selection  through  alpha  drivers  by  maintaining  a  60%  allocation  in  the  S&P  500  Low   Volatility  index.    This  position  has  the  added  advantage  of  keeping  turnover  low,  the  risk  of  a  portfolio   12    
  • 13. blow  up  low,  and  establishes  a  low  beta  floor  from  which  beta  may  be  increased  or  decreased   accordingly.    Second,  we  take  advantage  of  beta  selection  by  pre-­‐establishing  allocation  percentages   and  beta  drivers.    Thirdly,  we  take  advantage  of  beta  timing  via  a  systematic  macro  approach  that   monitors  global  credit  spreads  and  changes  in  industrial  economic  data.    Exhibit  10  shows  the  results  of   combing  all  three  strategies  since  1991  (The  first  year  of  the  S&P  500  Low  Volatility  index.)    For  this   period  the  blended  strategy  delivered  a  15.22%  annualized  rate  of  return  versus  6.9%  for  the  S&P  500   with  only  three  roundtrip  trades  (above  an  annual  rebalancing  trade).         Exhibit  10:  Blended  Strategy  vs  S&P  500           BLENDED S&P 500 STRATEGY MAX DRAW DOWN 56.78% 29.83% STANDARD DEV 17.63% 14.03% SHARP RATIO 0.23 0.74 SORTINO RATIO 0.28 1.34 *assumes a risk free return of 3%       13    
  • 14.       For  allocation  constrained  portfolios  our  research  shows  that  using  the  beta  timing  model  discussed   above  to  shift  beta  within  asset  classes  also  generated  alpha  while  lowering  volatility.    The  degree  of   outperformance  and  change  in  volatility  from  the  original  benchmark  depends  on  how  aggressive  of  a   shift  is  made  which  is  an  individual  preference.    For  instance,  following  the  technique  described  in  our   beta  timing  section  above  to  increase  or  eliminate  exposure  to  high  yield  bonds  within  a  fully  invested   bond  allocation  added  alpha.    Likewise,  shifting  from  the  S&P  500  to  the  S&P  500  Low  Volatility   considerably  reduced  volatility  and  generated  alpha  while  remaining  fully  invested  (See  Exhibit  10).     Even  within  sub  asset  classes,  like  small  cap  stocks  or  emerging  markets,  throttling  between  a  passive   index  and  the  corresponding  low  volatility  index  increased  returns  and  limited  downside.     Exhibit  10:  S&P  500  to  S&P  500  Low  Volatility  Index  vs  S&P  500     9000 8000 7000 S&P 500 to 6000 S&P 500 Low Volatility Index 5000 S&P 500 4000 3000 2000 1000 0 11/19/1990 11/19/1991 11/19/1992 11/19/1993 11/19/1995 11/19/1996 11/19/1997 11/19/1998 11/19/1999 11/19/2000 11/19/2001 11/19/2002 11/19/2003 11/19/2005 11/19/2006 11/19/2007 11/19/2008 11/19/2009 11/19/2010 11/19/2011 11/19/1994 11/19/2004   Discussion:     Discussed  above  are  a  multitude  of  investment  strategies  to  add  value  beyond  standard  indexing.    Our   firm  uses  two  basic  strategies  depending  on  an  individuals’  risk  tolerance  and  portfolio  constraints.    For   clients  that  desire  no  active  management  of  any  kind  we  deploy  a  multi-­‐asset  allocation,  following  the   endowment  strategy,  while  targeting  low  volatility  within  each  asset  class.    To  the  degree  we  are  free  to   do  so  we  adjust  allocations  in-­‐line  with  our  macro  model.    For  clients  that  seek  active  management  we   deploy  the  blended  strategy  as  discussed  above.         14    
  • 15. For  both  of  these  strategies  there  is  a  clear  value  proposition.      By  avoiding  an  incentive  fee,  charging  a   very  low  management  fee  and  utilizing  index  funds  we  are  able  to  pass  alpha  gains  along  to  the  client.     This  allows  us  to  avoid  the  use  of  leverage,  options,  or  deployment  of  high  beta  strategies  that  we  are   inherently  risky.         The  value  proposition  for  the  investor  is  further  enhanced  in  that  all  of  our  work  focuses  on  robust   (long-­‐term)  strategies  versus  the  best  performing  (short-­‐term).    For  instance,  none  of  the  macro   indicators  analyzed  were  chosen  because  of  the  numbers  rather  they  were  chosen  for  their  qualitative   attributes  and  then  tested  for  our  strategy.    Similarly,  allocation  percentages  were  not  chosen  to   optimize  returns  they  were  selected  with  the  aim  of  keeping  risk  within  reason.    Indexes  that  were   chosen  are  very  liquid,  stable,  and  general  (no  specialized  indexes).    Finally,  everything  is  broken  down   in  a  systematic  fashion.    By  not  over-­‐optimizing  everything  our  model  is  highly  prepared  for  the   uncertainty  of  the  future.     As  a  final  point,  the  strategies  discussed  in  this  paper  flip  the  investment  model  on  its  head.    Instead  of   trying  to  price  stocks  or  the  market  itself,  our  blended  strategy  prices  risk  both  at  the  security  level  and   at  the  macro  level.    If  anything,  our  research  indicates  investors  routinely  take  too  much  risk.    They  take   too  much  risk  picking  stocks  which  is  why  low  volatility  strategies  outperform  the  CAPM  predicts  and   they  take  too  much  risk  even  when  macro  risks  are  increasing.    This  is  why  our  macro  model  reduces   downside  volatility  and  generates  alpha.    Investors  also  take  too  much  risk  when  developing  their   investment  strategy  in  that  they  deploy  strategies  with  little  concern  for  beta  or  how  the  portfolio  will   be  under  extreme  circumstances.     Investors  have  a  seemingly  infinite  amount  of  choices  about  how  to  invest  their  hard  earned  dollars  yet   many  of  them  continue  to  invest  in  strategies  that  offer  a  weak  value  proposition.    This  paper  lays  out  a   strategy  where  the  value  proposition  is  re-­‐established.      By  embracing  a  hybrid  model  of  portfolio   management  investors  can  gain  the  best  of  indexing  and  macro  hedge  fund  models  while  alleviating   some  of  the  biggest  problems.    The  hybrid  portfolio  discussed  in  this  paper  offers  liquidity,  low  cost,  low   turnover,  risk  reduction,  improved  alpha  and  a  better  alignment  of  portfolio  risk  and  macro-­‐economic   risks.           15