
Recommended
Recommended
More Related Content
What's hot
What's hot (20)
Viewers also liked
Similar to Rt I Allentown Pete&C 2009
Similar to Rt I Allentown Pete&C 2009 (20)
Recently uploaded
Recently uploaded (20)
Rt I Allentown Pete&C 2009
- 1. Jeff Baird Instructional Software Project Manager Technology and Response to Intervention (RtI)
- 2. 2 Allentown School District Technology and Response to Intervention (RtI) 1. RtI Report Overview 2. RtI Report Logistics 3. Additional Related Reports 4. ASD Future plans 5. RtI Summary
- 3. 3 Paperwork
- 4. 4 Local Test Scores State Test Scores Demographics Interventions ASD Data Warehouse ASD Data Warehouse
- 5. 5 Wait To Fail Model Which of these students will drop out of school in 6 years? How long will you wait to offer help? What if you wait too long?
- 6. Allentown School District Technology and Response to Intervention (RtI) RtI Report Overview
- 7. 7 RtI Report Goals Organize data efficiently Monitor student performance Monitor students' response to specific interventions Identify patterns and critical decision points Create qualitative/quantifiable data Provide easily accessed and relevant reports Proactively identify At Risk Students
- 9. 9 Utilizing RtI Report in the Overall Process Monitor Assessment Data -PSSA -4Sight -DIBELS -GRL -Rigby -WIDA Monitor Demographic Data School Moves Attendance Discipline Data is refreshed nightly (DOD)
- 10. 10 Utilizing RtI Report in the Overall Process cont… Implement scientifically proven interventions Follow explicit rules to decide when students are not making sufficient progress or responding to the intervention
- 11. 11 RtI Report Uses Foundation of IST Process Grade Level Team Meetings Universal Screener for RtI process Universal screener for ASD 9th and 10th grade students Twilight School Evaluates student progress in ASD Twilight Program Update Teachers at regular intervals
- 12. 12 RtI Report Uses cont… Allows measurable checkpoints to baseline At Risk factors Allows schools at beginning of year to be proactive Classroom Group Makeup Appropriate Services Title I Interventions
- 13. Allentown School District Technology and Response to Intervention (RtI) RtI Report Logistics
- 14. 14 Creating a RtI Report
- 19. 19 Move Points 1 Move = 1 point Over 2 year time period
- 20. 20 Attendance Points 0-9 absences = 0 points 10 absences = 1 point 15 absences = 1 point 20 absences = 1 point And on…
- 21. 21 Suspension Points In School Suspension = 1 point Out of School Suspension = 2 point
- 22. 22 Assessment Points Most Recent Assessment Advanced Scoring = 0 point Proficient Scoring = 0 point Basic Scoring = 1 point Below Basic = 2 point
- 23. 23 Course Grades by Rating Period Secondary only Most Recent Rating Period D = 1 point F = 2 point
- 24. 24 Total RtI Points Points subtotaled by (adding shortly): Behavioral- Moves, Attendance, Discipline Academic-Assessments and Course Grades High Points = High Area of Concern Low Points = Low Area of Concern
- 25. Allentown School District Technology and Response to Intervention (RtI) Additional Related Reports Student Profile Report
- 26. 26 Drill Down to Student Profile Report
- 27. Allentown School District Technology and Response to Intervention (RtI) Future Plans
- 28. 28 RtI Version II Add: Grade Retention Add PSSA Science Monitor and Adjust Point Distribution Conduct long term validation of Point Distribution Add: Subtotals based on: Behavior Academic
- 30. 30 TetraData DASH Data updated daily (DOD) Easy to use front-end of Data Warehouse Puts timely data and reports: Point and Click
- 31. Allentown School District Technology and Response to Intervention (RtI) RtI Summary
- 32. 32 80/20 Rule (Then & Now) Then: spent 80% collecting data Then: spent 20% analyzing data Now: spend 20% collecting data Now: spend 80% analyzing and formulating: Data Driven Decisions
- 33. 33 Deborah Hartman Director of Special Education Allentown SD "Everyone tells educators "work smarter, not harder" as they wrestle to manage all the new regulations and educational innovations. A group of educators applied their technology skills and educational background to do just that. The TetraData Custom Report system assists colleague educators by putting meaningful bits of data at their fingertips. Tetra Data Custom Reports, developed by the Accountability and Assessment Dept , has the potential to help school systems, large and small, to virtually track student performance indicators and sort at-risk learners to the most able learner within seconds. This system gets an A+ for its teacher friendly appeal as the District embarks on the new framework of Response to Intervention."
- 34. 34 Tom Smith Lead Reading Teacher: Cleveland Elementary The RTI (Response to Intervention) is a powerful and promising approach to data analysis. It can provide a useful measure of the impact of interventions. Perhaps more importantly, it could be used longitudinally to anticipate and prevent problems. If a student’s score rises significantly, a counselor could investigate and help connect the student with appropriate services before the student reaches a crisis stage. A school district that is constantly putting out fires could be transformed into one that anticipates and prevents problems.
- 35. 35 ASCD Express Association for Supervision and Curriculum Development http://www.ascd.org/ascd_express/vol4/406_holben.aspx
- 36. 36 Not with RtI!Wait To Fail?
- 37. Allentown School District: Technology and Response to Intervention (RtI) Questions? http://peteandc2009.ning.com/forum /topics/al10-technology-and-response
- 38. 38 ASD Contact Information Dr. Diane Holben: Director of Accountability and Assessment holbend@allentownsd.org 484-765-4180 Jeff Baird: Instructional Software Project Manager bairdj@allentownsd.org 484-765-4060 Robin Powlus: Ast. Director of Accountability and Assessment powlusr@allentownsd.org 484-765-4053
Editor's Notes
- Our presentation will demonstrate the development process and the actual integration and utilization of what we at ASD are calling the RtI Report. (Response to Intervention) Which is authorized through IDEA (Individuals with Disabilities Education Act (IDEA ) We expect this report to be vital in being proactive in the identification and evaluation of At Risk students. Supplemental reports Student Profile Report Class roster Assessments Demographics Organizational
- As we moved into the process of making data driven decisions we felt that there was more we could do to help the schools with their data. As an old Special Education Teacher in my former life, I knew the pitfalls schools faced with kids falling through the cracks. We had an idea to see if Tetradata could help us with the process.
- Response to Intervention is an integrated approach to service delivery that encompasses general, remedial, and special education for academic and behavioral concerns. It is a multi-tier model that coordinates educational resources. Each tier represents an increasing intensity of resources and services matched to student needs. COMPONENTS: Early intervening support Universal assessments to progress monitor student growth - Screening - Diagnostic - Progress Monitoring Data-based decision
- Response to Intervention is an integrated approach to service delivery that encompasses general, remedial, and special education for academic and behavioral concerns. It is a multi-tier model that coordinates educational resources. Each tier represents an increasing intensity of resources and services matched to student needs. COMPONENTS: Early intervening support Universal assessments to progress monitor student growth - Screening - Diagnostic - Progress Monitoring Data-based decision
- Our next project will be the development of a Gifted RtI Report that will assist us in the identification process, the ongoing evaluation process and the summary process of our Gifted Program.
- Our next project will be the development of a Gifted RtI Report that will assist us in the identification process, the ongoing evaluation process and the summary process of our Gifted Program.
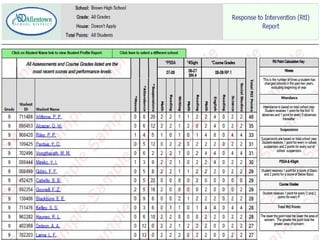
- The chart to the right appears on each RtI Report page so the user can have an understanding of what the points are telling them. It is important to remember that points or point totals do not represent a total of incidents or absences, etc, but is an accumulation of various categories that have various points assigned to a particular range of factors.
- The chart to the right appears on each RtI Report page so the user can have an understanding of what the points are telling them. It is important to remember that points or point totals do not represent a total of incidents or absences, etc, but is an accumulation of various categories that have various points assigned to a particular range of factors.
- The move factor takes into account over a two year period and assigns points for any move that is not part of a normal school year move Example: move from grade 5 Dodd to Grade 6 South Mountain, no point would be assigned
- The chart to the right appears on each RtI Report page so the user can have an understanding of what the points are telling them. Absences that accumulate 0-9 0point 10 1 point 15 1 point 20 1 point 25 1 point 30 1 point 35 1 point 40 1 point 45 1 point 50 1 point 55 1 point Total so far is 10 points
- The chart to the right appears on each RtI Report page so the user can have an understanding of what the points are telling them. It is important to remember that points or point totals do not represent a total of incidents or absences, etc, but is an accumulation of various categories that have various points assigned to a particular range of factors.
- PSSA Performance Level: Major State high stakes test 4Sight Performance Level benchmark assessment performance predictor of PSSA performance Course Grades (Secondary Only) Local Assessments: DIBELS, Rigby, GRL,WIDA- ESL language
- Point out that no grades are used for elementary grades, currently secondary only. The chart to the right appears on each RtI Report page so the user can have an understanding of what the points are telling them. It is important to remember that points or point totals do not represent a total of incidents or absences, etc, but is an accumulation of various categories that have various points assigned to a particular range of factors.
- Point out that no grades are used for elementary grades, currently secondary only. The chart to the right appears on each RtI Report page so the user can have an understanding of what the points are telling them. It is important to remember that points or point totals do not represent a total of incidents or absences, etc, but is an accumulation of various categories that have various points assigned to a particular range of factors.
- Retention: We will be adding Retention into the point structure- Point structure will be more heavily weighted. Interventions: We will be adding various local and Title I interventions such as Reading Recovery, Soar to Success, etc. We will both list them and allocate points for them as well. These are programs we offer to assist and remediate students with various academic difficulties. We want to not only identify and track what interventions what students are taking but also the success or failure of these interverntions.
- Retention: We will be adding Retention into the point structure- Point structure will be more heavily weighted. Interventions: We will be adding various local and Title I interventions such as Reading Recovery, Soar to Success, etc. We will both list them and allocate points for them as well. These are programs we offer to assist and remediate students with various academic difficulties. We want to not only identify and track what interventions what students are taking but also the success or failure of these interverntions.