More Related Content
Similar to Financials for a Takeaway Outlet
Similar to Financials for a Takeaway Outlet (20)
More from Babar Malik (7)
Financials for a Takeaway Outlet
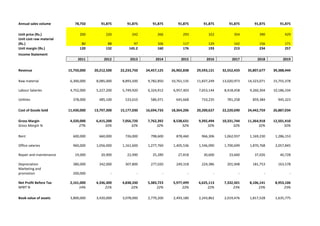
- 1. Annual sales volume 78,750 91,875 91,875 91,875 91,875 91,875 91,875 91,875 91,875 Unit price (Rs.) 200 220 242 266 293 322 354 390 429 Unit cost raw material (Rs.) 80 88 97 106 117 129 142 156 171 Unit margin (Rs.)120132145.2160176193213234257Income Statement201120122013201420152016201720182019Revenue 15,750,000 20,212,500 22,233,750 24,457,125 26,902,838 29,593,121 32,552,433 35,807,677 39,388,444 Raw material 6,300,000 8,085,000 8,893,500 9,782,850 10,761,135 11,837,249 13,020,973 14,323,071 15,755,378 Labour Salaries 4,752,000 5,227,200 5,749,920 6,324,912 6,957,403 7,653,144 8,418,458 9,260,304 10,186,334 Utilities 378,000 485,100 533,610 586,971 645,668 710,235 781,258 859,384 945,323 Cost of Goods Sold 11,430,000 13,797,300 15,177,030 16,694,733 18,364,206 20,200,627 22,220,690 24,442,759 26,887,034 Gross Margin 4,320,000 6,415,200 7,056,720 7,762,392 8,538,631 9,392,494 10,331,744 11,364,918 12,501,410 Gross Margin %27%32%32%32%32%32%32%32%32%Rent 600,000 660,000 726,000 798,600 878,460 966,306 1,062,937 1,169,230 1,286,153 Office salaries 960,000 1,056,000 1,161,600 1,277,760 1,405,536 1,546,090 1,700,699 1,870,768 2,057,845 Repair and maintenance 19,000 20,900 22,990 25,289 27,818 30,600 33,660 37,026 40,728 Depreciation 380,000 342,000 307,800 277,020 249,318 224,386 201,948 181,753 163,578 Marketing and promotion 200,000 - - - - - - - - Net Profit Before Tax 2,161,000 4,336,300 4,838,330 5,383,723 5,977,499 6,625,113 7,332,501 8,106,141 8,953,106 NPBT %14%21%22%22%22%22%23%23%23%Book value of assets 3,800,000 3,420,000 3,078,000 2,770,200 2,493,180 2,243,862 2,019,476 1,817,528 1,635,775 <br />