Fundamentals Of Hydronic System Design
•
13 gostaram•17,763 visualizações

This document provides an agenda for a class on hydronic system design fundamentals. The agenda includes: 1. A short introductory class on very basic hydronic system concepts and taking notes. 2. A general class covering: - Design problem analysis - System design and calculations - Pump selection - Control and system balancing - Advanced concepts 3. Review of key hydronic system design concepts like Bernoulli's equation, pressure units, and air management in hydronic systems. 4. Overview of the closed loop hydronic system design method including calculating facility load, selecting heat transfer devices, calculating system flows, schematically designing piping, and addressing piping configurations.

Recomendados
Mais conteúdo relacionado
Mais procurados
Mais procurados (20)
Destaque
Destaque (20)
Mais de ASHRAE Region VI
Mais de ASHRAE Region VI (12)
Último
Último (20)
Fundamentals Of Hydronic System Design
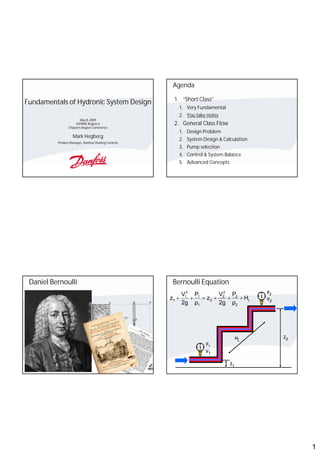
- 1. Agenda 1. “Short Class” Fundamentals of Hydronic System Design 1. Very Fundamental 2. You take notes May 8, 2009 ASHRAE Region 6 2. General Class Flow Chapters Region Conference 1. Design Problem Mark Hegberg 2. System Design & Calculation Product Manager, Danfoss Heating Controls 3. Pump selection 4. Control & System Balance 5. Advanced Concepts Daniel Bernoulli Bernoulli Equation V12 P1 V2 P P2 z1 z 2 2 2 HL V2 2g ρ1 2g ρ2 HL Z2 P1 V1 Z1 1
- 2. Bernoulli’s Equation... Pressure Units • Elevation - Potential Energy Of The System, Lifting The Fluid Standard 14.7 PSIA • Fluid Velocity: Kinetic Energy and Effects of Gravity or Atmospheric • Pressure & Density: Flow Energy Work Done On Pressure 0 PSIG Surroundings By Fluid Z Elevation V2 Fluid Velocity In Pipe 2g Perfect 0 PSIA P Pressure or Vacuum -? PSIG ρ Fluid Density HL Head Loss Hair Gear Spring Units: Pointer • Inches Difference • Feet Link In Length • Millimeters Bourdon • Meters Tube Sector Liquid Fill & Pinion • Water • Oil Stationary • Mercury Socket Pressure Connection 2
- 3. Pressure • Or Another Way Of Looking At It; 1' 1' 62.34 Lb. 1Ft 2 Ft 3 144 In2 Water 1' 62.34 Lb Lb. 0.443 12" In2 or 2.31Ft Or: 0.433 psi / Ft. 12" Ft 1PSI • A 231 Foot Long Manometer Is Inconvenient for Measuring 100 PSI, and In The Old Days A Common Dense Fluid Was Mercury... 1' Standard 14.7 PSIA Atmospheric or 1' 844.87 Lb. 1Ft 2 0 PSIG Pressure Ft 3 144 In2 Mercury 1' 844.87 Lb Lb. ≈30 In Hg 5.87 In2 or 0.17 Ft 12" Ft 1PSI 0 PSIA Perfect or or 12" Vacuum -? PSIG 2.04 In Hg 1PSI 3
- 4. Standard Atmospheric Pressure Standard 14.7 PSIA Atmospheric or Lb Lb In Hg 1 0 PSIG 14.7 2 11 2 2.04 7 In Hg Pressure in in PSI 2 ≈30 In Hg 11 PSIA Perfect 0 PSIA Perfect or Vacuum -? PSIG Vacuum Pressure Static Pressure • For this class our reference will be; • Static Pressure Is The Elevation • It’s Created By The Weight Of A Vertical Column Of Water 4
- 5. And That Other Unit of Measure? Feet of Head Feet of Head Why Use Pump Head? Pump Rated For 30 Ft Head @ Flow Density = 62.34 lbs/cu ft Density = 60.13 lbs/cu ft Density = 57.31 lbs/cu ft • Remember Bernoulli Really Described Energy 62.34 144 = 0.43 psi/ft 2.3 ft / psi 60.13 144 = 0.41 psi/ft 2.44 ft / psi 57.31 144 = 0.40 psi/ft 2.5 ft / psi • Pumps Do "Work" On The Water 30 ft X .43psi/ft =12.9psi 30 ft X .41psi/ft =12.3psi 30 ft X .40psi/ft =12.0psi 12.9 psi X 2.3 ft/psi = 30 ft 12.3 psi X 2.44 ft/psi = 30 ft 12.0 psi X 2.5 ft/psi = 30 ft • Work Is Measured In Ft-Lbs • Water Is Measured In Pounds 92.9 psi 92.3 psi 92.0 psi Ft - Lb P=12.9 P=12.3 P=12.0 Lb 80.0 psi 80.0 psi 80.0 psi Water @ 60 F Water @ 200 F Water @ 300 F 5
- 6. Review Design Problem • Pumps Do The Work: They Add Energy To the Fluid System • Three Story Building – We “Pump” Pounds of Fluid – Four Zones Per Floor – Work Measured In Foot-Pounds – Each Zone 14 Tons Air Conditioning – Foot-Pounds of Work Per Pound Fluid Pumped – 168 Total Tons • Pounds Cancel; We’re Left With Feet or “Head” – Evaluate at Constant Entering Air 78½°F DB, • “Density Independent” 65½°F WB • Three Components To Total Head (Work) – 42°F EWT, 16 ½°F ΔT – Elevation, Velocity, Pressure • Work Done on System Components – Head or Pressure Losses Develop “Flat” Layout 6
- 7. Closed Loop Hydronic System Design Method Air Management How Does It Work? • Air Is In Water, and Goes 1. Calculate Facility Load Into and Comes Out Of • Pumps Provide Solution As A Function Of Set Space Design Criteria Differential Pressure By Pressure & Temperature Converting Electrical Building Code Requirements Energy To Move Water ASHRAE Requirements Standard 62.2; Air/Ventilation Requirements Standard 90.1; Energy Pump Standard 55; Thermal Comfort Coil Standard 111; Test & Balance • Adds Heat Guideline 1; Commissioning • Rejects Heat Examine Load Requirements • Changes Water Temperature Source Zone Distribution • BTU/Hour Pipes HVAC Method • Pipes & Coils Provide “Resistance” You Use Diversity; Do Not Use Diversity When Sizing Pipes & Pumps Energy In Form of Pressure To Move Water System Load System Impacts • •ASHRAE’s Latest: 1998 “Cooling && ASHRAE’s Latest: 1998 “Cooling Heating Load Calculation • Heat Transfer Becomes Water Flow Heating Load Calculation Principles” (RP-875) Pedersen, Principles” (RP-875) Pedersen, – Over Estimation Causes Over Calculation of Flow Fisher, Spitler, Liesen Fisher, Spitler, Liesen • •Air Conditioning Contractors of – Energy Efficiency Impacted Air Conditioning Contractors of America America – Leads To Bigger Coils & Oversized Control Valves • •Manufacturer Load Programs Manufacturer Load Programs • Controllability Impacted – System Load – System Load – Block Load • Changes Desired Coil Performance – Block Load • •“Old” Carrier Manual “Engineering “Old” Carrier Manual “Engineering Guide for System Design” (1963) Guide for System Design” (1963) 7
- 8. Closed Loop Hydronic System Design Method Calculate Flow 2. Select Heat Transfer Devices Source; Desired System Operating Differential • Flow Temperature Load; Coil that offers required performance at calculated gain conditions Heating, Cooling & De-Humidification Operating system differential temperature Q m cP ΔT 3. Calculate and “Analyze” System Flows lb. min Btu Q 8.34 60 GPM 1 (TLvg TEnt ) Total System Flow gal hr lbm F Zone Flow Q 500 Flow T Can the required operating differential temperature be achieved? Alternative piping and pumping considerations Required Water Flow Thank You! Scott Blackmore & B&G System Syzer Q 500 q ! T (14 12,000) 500 q 16.5 (14 12,000) • Scale 1 q 20 gpm • Align 16½°F ΔT 500 16.5 • 168(,000) • 80 GPM / Floor • Read Flow • 240 GPM Building 8
- 9. 240 160 80 Hydronic Coil Heat Transfer 40 40 40 80 80 80 20 20 20 20 20 20 40 40 40 40 40 40 • Air Side Heat Transfer • Water Side Heat Transfer 20 20 20 20 20 20 q UA( LMTD ) q=mcp(t2-t1) 80 80 80 40 40 40 Where LMTD is the air- water log mean Where t is the water temperature difference temperature rise 240 160 80 2 Pipe Control Hot 120% Water Hot Water Coil Heat Transfer Hot Water Coil Heat Transfer Performance Vs. Water Side ΔT Performance Vs. Water Side ΔT Coil M C 97.5% 100% The coil Heat The coil performance Transfer performance is not linear is not linear % Heat Transfer 80% T °Δ T 20 T °Δ t1 60 60% Al t2 Al 40% 20% 75% 90% Design Design 0% Flow Flow % Water Flow 9
- 10. Coil Heat Transfer General Coil Notes 100% 4 Row Tot Total Heat Transfer 90% 4 Row Sens 4 Row Lat • Traditionally, sensible heat transfer is 80% 5 Row Tot 5 Row Sens controlled by throttling flow 5 Row Lat 100% • Coil performance tends to be non-linear Percentage Heat Transfer 6 Row Tot 70% 6 Row Sens 6 Row Lat Sensible Heat Transfer 60% – More non linear with low water ΔT (6ºF) 50% – More linear with higher water ΔT (16ºF) 40% 50% • Coil pressure drop affects 30% – Main & branch pipe sizing 100% 20% – Control valve operation (valve authority) 10% 50% – System balance Latent Heat Transfer 0% 0% 0% 10% 20% 30% 40% 50% 60% 70% 80% 90% 100% Percentage Water Flow Rate 4. Schematically Design Piping General Notes: Air Bind Select Terminals / Heat Transfer Coils Component Drops • Adequate Operating Differential To Create Flow Note Coil Characteristic for Temperature Drop Locate Terminals / Heat Transfer Coils Address Area Fit Constraints 1½’ – Size of Unit 3’ Air – Area of Application Water Examine Piping Geography A B Develop Pipe Sizing Criteria Select Control Valve Supply Main Return Main Examine Valve Authority 10
- 11. General Notes: Air Bind General Notes: Air Bind • Adequate Operating Differential To Create Flow 1½’ 3’ Air 3’ Water Riser Water Level 1’ Displaced By 1’ B Supply Main Return Main B B Supply Main Return Main B ΔH A to B = 1’ ΔH A to B = 5’ General Notes: Air Bind Ensure Adequate Differential Potential For Air Binding Low Pressure Drop Low Pressure Drop High Pressure Drop 3’ Supply Main A B Supply Main Return Main B ΔH ΔH A to B = 5’ B Return Main 11
- 12. Avoid Ghost Flow Circuits Piping Configuration • Single Pipe Systems – Single Load – Multiple Load Open • Two Pipe Systems (Supply & Return) A – Constant Flow Single & Multiple Load – Variable Flow Single & Multiple Load Closed B • Hybrid Systems – Bypass Systems – Primary-Secondary-Tertiary Single Pipe System Single Pipe Grid Coil • Depending On “T” Advantages: Branch Loss – General Guidance: “B” • Simple System! Length Should Be Twice That of “A” • Less Costly Piping – High Potential of Air B Binding In Grid Disadvantages: – Raising Water Temperature To Compensate Causes Panel • Simple System! Flux To Be Too High • Zone Temperature Control • Guidance: Intertwined Matched Tagged To Serpentine Coils (Most Pex Source Production A Based Systems Wind Up This Way) 12
- 13. Closed Loop Circulating System Two Pipe, Direct Return Definition: Elevation Differences Do Not Cause Flow Definition: Contact With Air At One Location Or Less Two Pipe Distribution System Two Pipe Variable Flow Riser (Main) Distribution System Supply Advantages: Disadvantages: Old Balancing Technique; • 2:1- BRPDR 90% design Branch • Water Flow Is Variable • Chiller Sees Variable Flow flow at all terminals – Saves Pump HP • Flow Through Coil Is • 1:1- 80% • Water Coil Provides Better Throttled Creating Variable Control of Temperature & Return Water Temperature Humidity To Chiller • Temperature To Each Coil Is • Must Balance Coil Branches Return Constant Per Chiller In Relation To Each Other Riser (Main) 13
- 14. 2 Pipe Direct Return Has Unequal Differential Pressures Two Pipe Constant Flow Distribution System Advantages: 100% Supply • Source Sees “Constant” Flow • Water Coil Provides Better Control of Temperature & Humidity • Temperature To Coil Is Constant ΔP3 T Per Source Head ΔP1 ΔP2 Disadvantages: • Water Flow Is “Constant” • Flow Through Coil Is Throttled Creating Variable Return Water Return Temperature To Source • More Components: Valves 0 • Must Balance Coil Bypass Pipe ΔP Distance From Pump Two Pipe Variable Flow Reverse Return System 2 Pipe Reverse Return Has More Equal Differential Pressures 100% ΔP1 ΔP2 ΔP3 Head 0 Distance From Pump 14
- 15. Applying Reverse Return Calculating Friction Head Loss • Loads Should All Be Within 25% Of Each Other • hf = Energy Lost Through Friction Expressed As Fluid • If Zone Control Is Used, All Branches Should Feet Of Head, Feet Of Fluid L V 2 Flowing Be In Similar Zones hf f D 2g • f= Friction Factor • You May Still Have To Balance System • L= Length Of Pipe Darcy-Weisbach Eqn. • D= Pipe Diameter • V= Fluid Average Velocity, Ft/Sec (Flow / Pipe Area) • g= gravitational constant 5. Size Piping & Calculate Drops Design Criteria For Balanced Piping Size Pipes In Branches First 2-10 FPS / 1’-4.5’ P Per 100’ (Steel) Determine Highest Branch Drop & Length Examine Pressure Drops Closely For Hydronic Balance Add Coil Drop – Branch To Riser Pressure Drop Ratio Helps System Balance In Tolerance Valve Drop Equal To Coil & Pipe or PICV pressure drop • 4:1 95% Design Flow All Circuits Select Branch To Riser Pressure Drop Ratio • 2:1 90% Design Flow Calculate Mains • 1:1 80% Design Flow Divide Worst Branch PD By Ratio, and Then 2 (S&R) • Constant Speed Pump Divide Riser Total Drop By Pipe Length (Target Design Rate) Examine Target Rate • Issues – Within ASHRAE Guidelines – Equipment Room Piping – Enough Pipe Length vs. TEL Of Fittings Size Risers – Variable Speed Calculate System & Branch Drops 15
- 16. 240 160 80 240 GPM 160 80 40 100’ 20’ 20’ 100’ B 20’ C 20’ 40 GPM 1 40 40 40 30’ 30’ A 80 80 80 80 3 30’ 30’ 20’ 20 20 20 20 20 20 4 20 20 5 6 2 30’ 30’ 30’ Source Source 40 40 40 40 40 40 40 GPM 40 GPM 30’ 30’ 30’ 7 8 20 20 20 20 20 20 F 10 20 20 9 30’ 80 80 GPM 11 80 80 30’ 40 40 40 30’ 30’ 40 GPM 100’ E 20’ D 20’ 12 240 160 80 240 GPM 160 80 Flow Segment A B C 1-2 2-3 3-4-6 3-5-6 6-7 2-8 8-10-11 8-9-11 11-7 7-12 D E F Calculate Friction Losses Size Length HF Rate HF Friction Loss Fittings • Know Length Of Pipe Service Valves Coil Control Valve – Work Darcy-Weisbach Equation Balance Valve Source – Use Design Tool Total • Count Fittings Path Path Total A-1-2-3-4-6-7-12-F – Example: I’m applying stock head loss A-1-2-3-5-6-7-12-F A-1-2-8-10-11-7-12-F A-1-2-8-9-11-7-12-F – You In Practice: Don’t do this! • Determine Branch & Riser Losses A-B-1-2-3-4-6-7-12-E-F A-B-1-2-3-5-6-7-12-E-F A-B-1-2-8-10-11-7-12-E-F A-B-1-2-8-9-11-7-12-E-F A-B-C-1-2-3-4-6-7-12-D-E-F – Coils, Specialty Devices A-B-C-1-2-3-5-6-7-12-D-E-F A-B-C-1-2-8-10-11-7-12-D-E-F – Trying To Get Rough Cut for Control & Balance Valves A-B-C-1-2-8-9-11-7-12-D-E-F 16
- 17. Copper Pipe Friction Loss Friction Loss Charts Head Loss Due To Friction, Ft. Per 100 Ft. Pipe • Published by ASHRAE & Hydraulic Institute • D/W Eqn. Add 15%! Add 15%! Volumetric Flow Rate, GPM 2” 3¼ Scale 2 Pipe Sizing Scale 3 Velocity Check 17
- 18. 2” 3.6 Pipe Sizes ½”-2” Fitting Pressure Loss Fitting Loss Pictogram • Variety of Fitting Loss Methodologies Accuracy Varies Widely Elbow Equivalents (Least Accurate) Total Equivalent Length “K” Factor (Current ASHRAE Recommendation) V2 Hf = K 2g 18
- 19. Fitting Pressure Loss How Do Fitting Drops Stack Up? Rahmeyer “K” hf hf % TEL hf % K hf Over Over GPM TEL “K” “K” K2 K2 hf 2” 90° Steel Elbow (K=1) 15 .04 .03 26 .505 98 <3FPS 20 .07 .03 127 .535 -18 • 1961 H/I TEL 8.5’ 25 .11 .09 24 .535 51 30 .15 .13 18 .543 56 • ASHRAE - H/I “K” Factor 35 .20 .17 15 .552 57 40 .26 .23 15 .561 55 • ASHRAE RP-968 45 .33 .29 15 .57 53 50 .39 .35 .626 45 >11FPS – (Rahmeyer); K Factor varies 10 widely as a function of 116 1.9 1.91 0 .71 41 velocity • Organize through spreadsheet Moving Towards Pump Selection… SEGMENT A B C 1-2 2-3 3-4-6 3-5-6 6-7 2-8 8-10-11 8-9-11 11-7 7-12 D E F Flow 240 160 80 80 40 20 20 40 40 20 20 40 80 80 160 240 Size Length 4" 100' 3" 20' 2.5" 20' 2.5 30 1.5 1.25 1.25 1.5 30 60 60 30 1.5 30 1.25 60 1.25 60 1.5 30 2.5 30 2.5" 20' 3" 4" 20' 100' • Friction Losses Unaccounted for; HF Rate 3 5.5 4.5 4.5 12.5 9 9 12.5 12.5 9 9 12.5 4.5 4.5 5.5 3 – Control Valve Friction Loss 3 1.1 0.9 1.35 3.75 5.4 5.4 3.75 3.75 5.4 5.4 3.75 1.35 0.9 1.1 3 Fittings 2 2 2 2 2 2 2 2 2 2 2 2 Service Valves 2 2 2 2 2 2 2 2 2 2 2 2 2 2 2 2 Coil 17 17 17 17 Control Valve • Need to understand “controls” Balance Valve Source – Balance Valve 30 Total 5 3.1 2.9 3.35 7.75 26.4 26.4 7.75 7.75 26.4 26.4 7.75 5.35 4.9 5.1 37 PATH TOTAL • Need to understand “balance” A-1-2-3-4-6-7-12-F 5 3.35 7.75 26.4 7.75 5.35 37 92.6 A-1-2-3-5-6-7-12-F – Suction Diffuser 5 3.35 7.75 26.4 7.75 5.35 37 92.6 A-1-2-8-10-11-7-12-F 5 3.35 7.75 26.4 7.75 5.35 37 92.6 A-1-2-8-9-11-7-12-F 5 3.35 7.75 26.4 7.75 5.35 37 92.6 A-B-1-2-3-4-6-7-12-E-F A-B-1-2-3-5-6-7-12-E-F 5 3.1 3.35 7.75 26.4 7.75 5.35 5.1 37 100.8 • Should understand pumps 5 3.1 3.35 7.75 26.4 7.75 5.35 5.1 37 100.8 A-B-1-2-8-10-11-7-12-E-F 5 3.1 3.35 7.75 26.4 7.75 5.35 5.1 37 100.8 A-B-1-2-8-9-11-7-12-E-F 5 3.1 3.35 7.75 26.4 7.75 5.35 5.1 37 100.8 – Pump Discharge Valve(s) A-B-C-1-2-3-4-6-7-12-D-E-F 5 3.1 2.9 3.35 7.75 26.4 7.75 5.35 4.9 5.1 37 108.6 A-B-C-1-2-3-5-6-7-12-D-E-F A-B-C-1-2-8-10-11-7-12-D-E-F 5 3.1 2.9 3.35 7.75 26.4 7.75 5.35 4.9 5.1 37 108.6 • Should understand pumps and systems 5 3.1 2.9 3.35 7.75 26.4 7.75 5.35 4.9 5.1 37 108.6 A-B-C-1-2-8-9-11-7-12-D-E-F 5 3.1 2.9 3.35 7.75 26.4 7.75 5.35 4.9 5.1 37 108.6 19
- 20. Room Air Re-circulated Automated Control Heated Room Controller Unit Heater Control Signal Actuator Hot Water Coil Blower Add Valves Automated Control Theory Energy is lost Energy is lost Disturbances proportionally to proportionally to the outside the outside Heat Gains • Solar temperature temperature • Change Weather q = UA(Ti-TO) ) q = UA(T -T i O • People Manipulate Coil Control Water Blower Temperature The controller output signal Flow Process The controller output signal acts in a proportional manner acts in a proportional manner to the difference in the actual to the difference in the actual from the desired temperature from the desired temperature adding what is lost adding what is lost 20
- 21. Theory A Fairly Simple Concept... Disturbances • Unaccounted for Changes In • We control for comfort as indicated by Heat Gains Differential Head • Friction Head Loss temperature Water Flow Distribution Air Flow • Pressure Control – Humidity Control “Implied” By Coil Selection Dynamics • Various levels of implementation Manipulate Coil – Economic Criteria Control Water Blower Temperature – Process Criteria Flow Process – Paradigm Criteria Proportional Control Proportional Control SP + e t K Ke e ns MV - e po 0-10 VDC Output es Output Error 0-10 VDC rR Signal SP Control Signal ea Lin “Control Theory” e - Error y 0-10 VDC t Output 0-10 VDC SP Control Signal Room Controller Room Controller Actuated Valve Actuated Valve 21
- 22. Proportional Control Traditional 2 Way Valve Temperature Control M C • Controller controls y because response t is predictable 0-10 VDC Output 0-10 VDC SP Control Signal T • Variable coil flow Room Controller • Variable system y flow • “Why” variable (y-yi)=K(t-ti) speed pumping Actuated Valve can be used y = Valve Position yi = Initial Valve Position t = Temperature ti = Initial Temperature K = Constant (gain) Valve Characteristic • ASHRAE Research (RP-5) Boiled It Down To This 100% – Just About Every HVAC Text On Valves Uses This Type of Figure Quick Opening 90% – The Coil Gain (Proportional Band) Isn’t the Same As The 80% Controllers… Why We Use An Equal Percentage Valve 70% Controlled Coil Characteristic Valve Characteristic Relationship % Branch Flow 60% Linear n 50% Ga i 40% in Ga 30% in Ga 20% Gain 10% Equal Percentage 0% 0% 20% 40% 60% 80% 100% % Valve Lift Source: ASHRAE Handbook 22
- 23. Linear Stem Valves (Globe) Controllability ~ Constants • Constant Differential Pressure Keeps Predictable Flow Characteristic Coil 1% 8% To Select Properly; • Required Flow Rate (GPM) • Select Differential Pressure TC Valve – Magnitude Depends On; Throttle In • Control; Open-Closed/Modulating Here 90% Time • Hydraulic Design Philosophy; Balanced, Unbalanced, Branch & Riser Pressure Drops • Pump Control; Constant vs. Variable Speed • Required Valve Authority – Consider Characteristic Requirement Adjustment Proportional Action THROTTLING % 100 0% 10% 100% • Two Position POSITION OF CONTROLLED DEVICE Room Temperature 75 Set Point % OF STROKE 50 25 Valve Position Open 0 0 25 50 75 100 CONTROLLED VARIABLE % OF CONTROLLER SCALE 23
- 24. Proportional Action Valve Description • Proportional Positioning • Many terms describe valves Room Temperature • Flow Coefficient Set Offset Point – CV – Rangeability Open Valve Position Closed Control Valve Integration Flow Coefficient EQUAL PERCENTAGE CHARACTERISTIC 100 75 % OF FLOW 50 25 y 0 0 25 50 75 100 ΔP q CV % OF VALVE STROKE SG 24
- 25. Flow Coefficient Rangeability Max Flow Q q 500(t ent t lvg ) Heat Transfer Min Flow • With & W/O Actuator ΔP Units = PSI • Without Actuator, 30:1 Flow q CV • With Actuator, 100+:1 SG Water = 1 • Globe Valves “De-Facto” Standard • Ball Valve… Calculate Desired Live with Available The Goal; Make the red line straight and 100% to 100% Authority 100% istic Ch ar act er • Valve authority affects controllability C oil 80% • The Controller cannot control properly ic ist = PMIN / PMAX rity er ct t ho ra ha 60% Au lC Return Supply % ro tic nt 50 Co ris te 40% ac ar Ch PENT % Eq 20% PMAX PMIN Maximum Valve Stroke 0% 0% 20% 40% 60% 80% 100% 120% 140% PLVG 25
- 26. Valve Authority Valve Characteristic and Authority 100% Return Supply 90% 80% .1 70% = β % Branch Flow .3 60% .50 β= 1. 0 50% = β β= 40% CV2 CV1 CV2 30% Constant Flow Coefficient 20% Valve Specification C V1 C V2 Valve Specification Pipe 10% • Modified Equal Percentage Valve • Modified Equal Percentage Valve • Globe Pattern C VSYS • Globe Pattern Coil • 2” Size • 2” Size • 30:1 Rangeability Service Valves 0% • 30:1 Rangeability Balancing Valves Variable: Control Valve C2 C2 V1 V2 0% 20% 40% 60% 80% 100% % Valve Lift Selection Understand Hydraulics • Required Flow Rate (GPM) 100% • Select Differential Pressure ΔP1 ΔP2 – Magnitude Depends On; • Control; Open-Closed/Modulating Head • Hydraulic Design Philosophy; Balanced, ΔP1+ΔP2 ΔP2 ΔP3 Unbalanced, Branch & Riser Pressure Drops • Pump Control; Constant vs. Variable Speed • Required Valve Authority – Consider Characteristic Requirement 0 • Solve Algebraically Distance From Pump 26