SlideShare uma empresa Scribd logo
1 de 64
Baixar para ler offline
Public and Private Funding
of Basic Education
in Zambia
Implications of
Budgetary Allocations
for Service Delivery
Jishnu Das, The World Bank
Stefan Dercon, Oxford University
James Habyarimana, Harvard University
Pramila Krishnan, Cambridge University
Africa Region Human Development
Working Paper Series
The World Bank
Copyright © 2004
Human Development Sector
Africa Region
The World Bank
ii
The views expressed herein are those of the authors
and do not necessarily reflect the opinions or policies of
the World Bank or any of its affiliated organizations.
Cover Design by Word Express
Interior Design by Jennifer Vito
Cover photo: Drawing by Josephine Ngoma, Student, Namanongu School, Chongwe District.
Contents
iii
Foreword ......................................................................................................................................................v
Abstract ...................................................................................................................................................... vii
Acknowledgments ..................................................................................................................................... viii
Abbreviations and Acronyms ...................................................................................................................... ix
Executive Summary ......................................................................................................................................x
1. Introduction ........................................................................................................................................... 17
2. Zambian Education during the 1990s ................................................................................................... 19
3. Tracking Methodology ........................................................................................................................... 22
4. School Characteristics of the Sample .................................................................................................... 26
5. Expenditure Tracking at Provincial, District, and School Levels ........................................................... 29
6. Leakage of Nonsalary and Payroll Funds............................................................................................... 37
7. Equity in Education Funding .................................................................................................................. 43
8. Private Expenditures for Education ...................................................................................................... 51
9. Discussion and Conclusions .................................................................................................................. 59
Bibliography ............................................................................................................................................... 60
Appendix.................................................................................................................................................... 62
Tables
Table 1. Enrollment Rates, 1992–2001
Table 2. Structure of Resource and Funding Flows in Zambia
Table 3. Enrollment, Urbanization, and Poverty
Table 4. Mean Math and English Scores, by Province
Table 5a. School Enrollment and Staffing
Table 5b. Infrastructure
Table 5c. Key Performance Indicators
Table 5d. Household Indicators
Table 6. Cash Received by Province Education Offices
Table 7. Funding Sources at Province Education Office Level, June 2001–June 2002
Table 8. Funding Disbursed to Districts, January 2002–June 2002
Table 9. Cash Received by Districts
Table 10. Funding Sources at the District Level
Table 11. Tracking of Resources, June 2001–June 2002
Table 12. Tracking of Resources from the District Level to Schools, 2001–2002
iv
Table 13a. Disbursement of Fixed-Grant Allocations, by Province
Table 13b. Disbursement of Salaries, by Province
Table 13c. Disbursements of Rule-Based Allowances, by Province
Table 14. Percentage of Schools That Receive No Funds, by Source and Location
Table 15. Average Amounts Conditional on Receipts, by Province
Table 16. Discretionary Transfers to Teachers, by Province
Table 17. School and District Characteristics, by Province
Table 18. Enrollment, Urbanization, Wealth, and Distance
Table 19a. Equity in Rule-Based Funding at the District Level
Table 19b. Equity in Rule-Based Funding at the School Level
Table 20a. Equity in Discretionary Funding at the District Level
Table 20b. Equity in Discretionary Funding at the School Level
Table 20c. Equity in Discretionary Funding at the School Level, by Location
Table 21a. Equity in Per-Pupil Staff Remuneration at the School Level
Table 21b. Equity in Per-Pupil Staff Remuneration, Class Size and Salaries
Table 22. Decomposing the Decline in Fees
Table 23. Public and Private Sources of Funding
Table 24. Equity in Public and Private Funding at the School Level
Table 25. Fee and Nonfee Expenditures, by Province
Table 26. Equity in Public and Private Spending
Table 27. Substitutability between Public and Private Spending
Table 28. Household Expenditure and Public Funding
Table A1. Variables Used in Construction of the Asset Index
Figures
Figure 1. Funding Flows across Centralized and Decentralized Provinces
Figure 2. Characteristics of School Enrollment in Zambia
Figure 3. Funding Flows across Centralized and Decentralized Provinces
Figure 4. Funding Disbursement in Centralized and Decentralized Provinces
Figure 5. Variation in District Receipts
Figure 6. Inequalities in Public Funding in Zambian Basic Education
Figure 7. Declining Fees since 2000
Figure 8. Fee Decline by Province and Location
Figure 9. The Relationship between PTA Fees and Wealth, 2000–2002
Figure 10. Household Spending on Education by Wealth Terciles
Figure 11. Lorenz Curves of Inequalities in Public and Private Funding
Figure A1. Asset Index Characteristics for All-Sample
Figure A2. Asset Index Characteristics for Rural Sample
Figure A3. Distribution of Wealth in All-Sample and Separated by Location
Figure A4. Comparison of All-Sample and Rural Index
Foreword
v
E
ducation is at the center of many poverty re-
duction strategies. Yet too often, education
services fail to improve outcomes for a vari-
ety of reasons. Budgetary allocations often favor the
better-off, limiting poor people’s access to services
or preventing improvements in quality. In many poor
countries improvements in educational outcomes call
for institutional—not merely managerial—reforms.
Such reforms include bottom-up measures to give
users a stronger voice and more power over pro-
viders. They also include top-down measures to
ensure better monitoring of providers and introduce
effective incentives for improving staff performance.
Both types of reform depend on a body of system-
atic information on performance, incentives, and
other aspects of frontline service delivery. This in-
formation is indispensable for catalyzing and guiding
the institutional reforms needed to improve educa-
tion and educational outcomes—yet little of these
essential data are currently available.
To help fill this gap, the Development Research
Group of the World Bank is carrying out, in collabo-
ration with local institutions and Bank operations, a
multicountry study of education service delivery in
Laos, Pakistan, Papua New Guinea, Uganda, as well
as Zambia, the subject of this paper. The purpose of
the research is to understand the relationship be-
tween funding and educational outcomes by track-
ing funding and resources and relating them at dif-
ferent levels of the delivery system to outcomes in
different institutional and organizational contexts.
The education research program pilots the Quan-
titative Service Delivery Survey (QSDS), in which the
school is the primary unit of observation. Beyond its
use in analyzing provision of services, the QSDS fits
well into the larger goal of impact evaluation. When
combined with household surveys, it allows explo-
ration of interactions between frontline providers
and users of services. By adding surveys of local poli-
ticians and officials, it can also shed light on the po-
litical economy of service delivery and on interac-
tions between providers and policymakers.
The Education Service Delivery Study (ESD) in
Zambia carefully examines the structure of funding
and service delivery to better understand the rela-
tionship between educational inputs and outcomes.
It specifically takes into account linkages that may
arise among different players involved in the deliv-
ery of education (for instance, the province educa-
tion office, the district education office, schools, par-
ent teachers associations, and pupils) and seeks to
examine the ways through which these players re-
spond to changes in the institutional setting and fund-
ing structure. The ESD addresses these important
issues through the careful measurement of school
inputs both at the school and the household level, as
well as educational outcomes, through tests admin-
istered to the same pupils at two different times (in
collaboration with the Examination Council of Zam-
bia).
The Government of the Republic of Zambia (GRZ)
has long recognized the importance of education.
Nevertheless, a sharp decline from the mid-1980s
onward in copper prices has led to a commensurate
decline in GNI per capita, from $590 in 1975 to $300
in 2000, and this has presented several obstacles for
vi
the education sector. The government, along with a
consortium of donors, has been working closely to
improve educational outcomes. The Education Ser-
vice Delivery Study addresses important issues re-
garding the link between this effort and educational
outcomes.
This report provides a detailed evaluation of pub-
lic expenditure. It includes both a public expendi-
ture tracking and a funding-equity exercise. The
tracking exercise provides information on the ex-
tent to which educational expenditures earmarked
under the central budget actually reach schools, and
the funding-equity exercise examines whether such
funding can be regarded as progressive—to what
extent, if any, do poorer schools receive a greater
share of public funding than their richer counterparts,
and if so, how does this funding impact inequality in
educational expenditure? The evaluation provides a
complete picture of funding to primary and basic
schools based on allocated and discretionary bud-
getary components, and household contributions to
education expenses.
This report makes three contributions to the
understanding of education funding in the Zambian
context. First, it shows that funding characteristics
are closely linked to the type of disbursement. Funds
allocated according to a clear, predefined rule reach
schools with little evidence of diversion. A signifi-
cant proportion of funds allocated at the discretion
of district and provincial educational offices, how-
ever, are retained at higher levels of the hierarchy.
Second, rule-based allocations have led to greater
per-pupil funding for poorer and more rural schools.
These allocations, however, are the only progressive
disbursements in the survey. The disbursement of
discretionary allocations is neutral with respect to
wealth, and per-pupil staff allocations are higher in
urban and richer schools. Once all sources of public
funding are factored into the analysis, public school
funding in Zambia is regressive, with almost 30 per-
cent higher allocations to richer schools.
Third, private expenditures at the level of the
household have a critical impact on equity in educa-
tional funding. In fact, the inequality in public expen-
diture is dominated by the large share of private
expenditures in overall educational spending. More-
over, these expenditures adjust to school funding,
decreasing when funding rises. The magnitude of
these adjustments appear to be the same across rich
and poor households, suggesting that higher public
funding may be useful in decreasing inequality across,
but not within, communities.
The findings are highly relevant for educational
reforms being undertaken in many developing coun-
tries to improve educational outcomes. My hope is
that by offering a new perspective from the front
lines of education, this paper will make a useful con-
tribution to the reform agenda for improving educa-
tion services for poor people in Zambia and else-
where.
Birger J. Fredriksen
Senior Education Advisor
Human Development Department
Africa Region
Abstract
T
his report presents findings from a survey
of 182 primary (grades 1-7) and basic (grades
1-9) schools carried out in Zambia in 2002.
It describes and analyzes resource flows to these
schools from three sources: rule-based funding from
the center, discretionary funding from district and
provincial education offices, and household spend-
ing on education.
Rule-based funds reached schools exactly as ear-
marked. The rule-based component of funding was
highly progressive, as the same amount was dis-
bursed to all schools irrespective of enrollment. Since
small schools tend to have poorer student bodies,
the rule-based allocation per pupil translated to more
funding for poorer students.
Discretionary funds, controlled by the province
and district education offices, reached only 25 per-
cent of schools. The discretionary funds were wealth
neutral. Even shares were distributed to schools with
poor and nonpoor students.
Household educational expenditures show that
nonfee expenditures by the family are seven times
the corresponding expenditure on fees, making
them the main source of inequalities in private ex-
penditure. Once private expenditure is factored
into the analysis, the nonprogressive nature of the
public education funding system worsens: the share
of educational expenditures for the poorest 50 per-
cent of the population declines from 40 to 34 per-
cent. Furthermore, when examining substitution
between private expenditures and public funding,
there is strong evidence that households decrease
expenditures when public funding increases.
Although public funding could address inequali-
ties in educational spending with progressive allo-
cation across villages and schools, the desired im-
pact of such redistributions may be less than imag-
ined due to the crowding-out of private expendi-
tures. The report suggests that increases in fund-
ing may not be the optimal way to improve educa-
tional attainment. It might be more beneficial to
concentrate instead on providing inputs that house-
holds cannot supply on their own, such as high-
quality teachers.
vii
Acknowledgments
T
his study would not have been possible
without the support and guidance of a
number of institutions and individuals. We
would especially like to thank Hinh Dinh and Bruce
N. Jones for their keen interest and suggestions at
every stage of the project, Ritva Reinikka for her
continued support and encouragement, and Keith
Wood and Richard Arden at DFID for funding the
survey. The study relied on critical support from our
Zambian counterparts, particularly Clement
Siamatowe at the World Bank; RuralNet Associates
and Professor Mwanawina at the University of Zam-
bia for their excellent support and survey work in the
field; Joe Kanyika, Teza Nakazwe, C. T. Sakala, and
Arnold Chengo at the Examination Council of Zam-
bia and Ministry of Education; the Permanent Secre-
tary of the Ministry of Education, Barbara Y. Chilangwa;
and J. Chiwele from the Accountant General’s office.
Finally, Mushiba Nyamazana has been an integral part
of this study from its inception; he helped design the
surveys used in the study and provided invaluable in-
sight into the educational system.
viii
Abbreviations and Acronyms
BESSIP Basic Education Sub-Sector Investment Program
DEO District Education Office (Officer)
ESD Education Service Delivery
ESDS Education Service Delivery Survey
GDP Gross Domestic Product
GNI Gross National Investment
GRZ Government of the Republic of Zambia
HIPC Debt Initiative for Heavily Indebted Poor Countries (World Bank)
IRT Item Response Theory
LCMS Living Conditions Monitoring Survey
NGO Nongovernmental organization
PAGE Program for the Advancement of Girls’ Education
PEO Province Education Office (Officer)
PTA Parent Teachers Association
QSDS Quantitative Service Delivery Survey
ix
Executive Summary
T
he link between education and develop-
ment provides a strong case for allocating
public expenditures to the education sector.
However, allocating more central budgetary re-
sources to the education sector will not necessarily
deliver better outcomes. Budgetary resources may
not reach the intended beneficiaries, and even if they
do, these resources may not lead to the desired
outcomes. This report examines the structure of
funding and service delivery in Zambia using a re-
cently completed Educational Service Delivery Sur-
vey (ESDS).
The Government of the Republic of Zambia
(GRZ) has long recognized the importance of edu-
cation. Nevertheless, a sharp decline from the mid-
1980s onward in copper prices has led to a com-
mensurate decline in GNI per capita from $590 in
1975 to $300 in 2000, and this has presented sev-
eral obstacles for the education sector. The govern-
ment and a consortium of donors have been work-
ing together to improve educational outcomes in
Zambia. The survey and study ask two questions:
What is the current record of the education sector
in delivering services to the intended recipients? Have
the changes undertaken by the Ministry of Educa-
tion had the desired consequences in terms of edu-
cational outcomes?
The report focuses on a detailed evaluation of
public expenditure—through both a tracking and a
funding-equity exercise—to gauge the extent to
which educational expenditures earmarked under
the central budget actually reach schools, as well as
the extent to which such funding can be regarded as
progressive. Of the four issues that concern us dur-
ing this exercise, the first three relate to the public
funding of education and the last examines private
educational funding and its relationship to public ex-
penditure. These issues are as follows:
• What percentage of resources is spent at each
level of the administrative hierarchy?
• To what extent is variation in funding across
districts and schools explained by funding for-
mulas that relate budgetary allocation to dis-
trict and school characteristics such as enroll-
ment or the number of schools?
• To the extent that there is variation in funding
across districts and schools, what is the rela-
tionship between this variation and character-
istics of districts and schools? (For instance,do
richer districts and schools systematically re-
ceive more funds?)
• How important is private funding in the provi-
sion of education and how does this compo-
nent of funding relate to equity in the overall
funding of education?
In Zambia public funding for education flows to
schools through a three-tiered administrative hierar-
chy involving the province offices, the district offices,
and schools. Moreover, funds do not necessarily flow
in a top-down manner; at each tier of the hierarchy,
funds may come directly from the government or
x
from international and national donors. In our analy-
sis, we classify these funds into four categories:
• Rule-based allocations to schools. A fixed-
grant of $600 or $650 is allocated to each
school, depending on the type of school. The
grant is not a per-pupil allocation and it is inde-
pendent of the enrollment in the school.
• Discretionary allocations to schools. Such
funds are allocated at the discretion of districts
and provinces and are over and above the rule-
based allocation.
• Rule-based allocations to teachers. Teachers
are paid directly via deposit slips through a cen-
tralized payroll in Zambia. This money does not
pass through the province or district offices.
• Discretionary allocations to teachers. In ad-
dition to salaries and monthly allowances,
teachers are entitled to one-time benefits,
such as leave benefits, transfer benefits (paid
when a teacher switches schools), and funeral
benefits. The payment of such benefits is left
to the discretion of the provincial and district-
level administration.
It is also necessary to distinguish between prov-
inces with and without district education boards. Al-
though districts receive money directly from the GRZ,
both for rule-based and discretionary allocations, all
money for discretionary allocations is first transferred
to the concerned province, and from there moves on-
ward to the district. For this reason, provinces with
district education boards are referred to as decentral-
ized provinces and those without district education
boards are referred to as centralized provinces. In the
study sample there are two of each: Lusaka and
Copperbelt provinces are decentralized and Northern
and Eastern province are centralized. Figure 1 shows
howfundsareallocatedacrossbothtypesofprovinces.
EXPENDITURE TRACKING
The tracking exercise follows all nonsalary funding
flows through the administrative hierarchy (recall that
xi
Figure 1. Funding Flows across Centralized and Decentralized Provinces
Note: Decentralized provinces are Lusaka and Copperbelt. Centralized provinces are Northern and Eastern.
Ministry of
Education
(Centralized)
(Decentralized)
District
(Centralized)
District
(Decentralized)
SchoolsHouseholds
Discretionary flows
Rule-based flows
Case IV donors
(primarily the Program
for Advancement of
Girl’s Education
Ministry of
Education
(Centralized)
(Decentralized)
District
(Centralized)
District
(Decentralized)
SchoolsHouseholds
Discretionary flows
Rule-based flows
Case IV donors
(primarily the Program
for Advancement of
Girl’s Education
Province Province
Leakage =
This report, however, goes beyond an estimate
of leakage based on allocated funds to provide a com-
plete picture of the funding of educational institu-
tions. It examines all sources of funding for the school.
For example, in the case of discretionary compo-
nents the rule-based methodology fails (since there
is no rule about the amounts that schools are sup-
posed to receive, it is not possible to determine what
constitutes leakage in the system). After tracking the
amounts that schools receive, it’s possible to exam-
ine the equity implications of such allocations. The
section on leakage establishes the following:
• Rule-based allocations to schools in the
Zambian educational system seem to
work efficiently. There is little evidence to
suggest that funds earmarked for disburse-
ments do not reach intended beneficiaries.
Specifically, more than 90 percent of all
schools (95 percent in all provinces except
Lusaka) had received the rule-based allocation
at the time of the survey, and delays in disburse-
ment rather than leakage of funds was a more
likely explanation in the case of schools that had
not received the grant (this grant was disbursed
two months prior to the survey).
• Rule-based allocations to teachers—sala-
ries and clearly defined allowances—are
disbursed efficiently. There is some evidence
of delays in the updating of the payroll sys-
tem, as well as significant arrears in the case
of allowances that are not clearly specified. In
the case of salaries, 95 percent of teachers had
no outstanding amounts. For allowances
where there is a clear specification based on
location (hardship allowance in rural locations)
or status (teacher trainee allowance), less than
15 percent of payments were overdue by six
months or more. However, in the case of over-
time allowances (which must be filed every
term), and allowances that resulted from a
change in the status of the teacher (such as
added tasks with commensurate allowances),
50 percent of payments were overdue. For all
allowances there is considerable evidence that
payroll goes from the center directly to teachers). The
expenditure flows can be characterized as follows:
• On average, K 28,000 per pupil enters the edu-
cational system for the four provinces surveyed.
This amount hides a significant degree of varia-
tion among provinces with, for instance, East-
ern Province (K 44,300) receiving more than
double the per-pupil funding received by
Copperbelt (K 19,000).
• Of this amount, discretionary funds at the level
of the province and district account for 70 per-
cent of all funding and rule-based funds accounts
for the remaining 30 percent. Thus rule-based
funds allocated through the fixed-school grant
of $600 ($650) account for less than one-third
of all the funding received.1
• Between one-sixth and one-third of total fund-
ing in the system eventually reaches the schools.
Again, there are significant differences between
provinces, with 34 percent of provincial-level
funds reaching schools in Copperbelt, and only
14 percent reaching schools in Lusaka.
• Although decentralization has shifted spending
from the provincial to the district level, it has
not resulted in greater disbursements to
schools. The differences between centralized
and decentralized provinces up to the level of
the district are as follows: centralized provinces
spend more than decentralized provinces at the
provincial level. Thus, in Eastern (38 percent)
and Northern (18 percent) province a far higher
percentage of funding is spent at the provincial
level compared to Copperbelt (9 percent) and
Lusaka (5 percent). However, extra funding that
reaches the districts in decentralized provinces
results in higher spending only at the district
level and is not associated with greater funding
to schools.
LEAKAGE
Following the methodology used in Uganda (Ablo
and Reinikka 2000), the definition of leakage in the
Zambian educational system is the ratio of what
schools actually receive to what they were supposed
to receive. The equivalent of per-pupil funding in
Uganda is the fixed-school grant in Zambia. Thus leak-
age for rule-based allocations is defined as follows:
xii
amount received by school
$600 ($650 for basic schools)
lags in updating the payroll regularly result in
delays of one to three months in payment.
• For discretionary allocations to schools,
the positive results obtained earlier no
longer hold: less than 25 percent of
schools receive any funding from discre-
tionary sources. The crucial importance of
rule-based funding at the level of the school is
also highlighted by the change in the relative
share by source as we move down the admin-
istrative hierarchy. At the level of the province,
the share of rule-based allocations in total fund-
ing ranges from 8 to 40 percent, with a median
of 12 percent. Moving down to the districts,
this share increases to between 19 and 63 per-
cent, with a median of 44 percent. Finally, at
the level of the school this share ranges from 2
to 100 percent, with a median of 99 percent.
More than 75 percent of all schools received
cash resources only from rule-based sources
in the current year.
• For discretionary allocations to teachers
there are substantial amounts overdue
for one-time benefits and payments. In
some provinces the overdue payments
amount to three times the monthly salary of
the teacher.
• Discretionary funding disbursed to schools
tend to be one of two types. Small sums are
disbursed under the UNICEF-administered
Program for the Advancement of Girls’ Educa-
tion (PAGE) or larger sums are received from
district offices. The high variation in the amounts
received is significant. Conditional on a school
receiving such funding, it could account for as
much as 60 times what it would get under the
fixed-allocation grant.
This suggests two potential explanations for the pat-
terns of discretionary funding and school expenditure:
• Schools are provided discretionary funds for
large expenditures on a rotating basis. For in-
stance, if a school were rehabilitated every
10 years only 10 percent of schools in any
given year would receive money for capital
expenditures. In addition, the amounts of
such expenditures received would be large
compared to amounts received for recurrent
spending. According to this hypothesis, the
pattern of funding and expenditure observed
is a reflection of the lumpy nature of big invest-
ments.
• Since rule-based funding is clearly defined and
transparent, it is extremely difficult for any politi-
cal economy considerations (such as capture of
funds by elites) to impact school allotments. Dis-
cretionary funding is not associated with any such
rule. So the pattern of funding observed is a re-
flection of the difference between rules and dis-
cretion. The few schools that receive large
amountsarespecialschoolsthathavegreaterbar-
gainingpowerwithintheadministrativestructure.
The section on equity turns to exactly this con-
cern and relies on the following observation: if the
first explanation is correct it is unlikely that the flow
of discretionary funds to schools will be correlated
with wealth. If schools are provided with capital
expenditure funds on a rotating basis, it seems natu-
ral to assume that the sample of schools receiving
such funding will be a mix of schools in rich and
poor areas.2
Consequently, systematic differences
in funding by wealth levels would lead to an expla-
nation based on the difference between rules and
discretion, rather than one based on a distinction
between one-time and recurrent expenditures.
EQUITY
The examination of funding equity in the education
system follows rule-based and discretionary allocations
separately, and focuses on the relationship between
the type of funding and following related variables:
• Urbanization. Do urban schools and urban-
ized districts receive more than their rural coun-
terparts?
• Wealth. Do richer schools and districts receive
more than their poorer counterparts?
• Distance to administrative offices. Do schools
that are closer to administrative offices receive
more than those farther away?
The main findings are summarized below.
• Equity of rule-based funds. Rule-based funds
are progressive, with greater per-pupil amounts
xiii
allocated to less urban and poorer schools and
districts. This result is entirely due to the inverse
relationship between school size and wealth
and urbanization. Thus, schools in rural areas
tend to be smaller and poorer whereas schools
in urban areas tend to be larger and richer. Since
rule-based funds are allocated per school rather
than per student, poorer and more rural schools
receive greater funding per pupil. The same logic
applies at the district level, where those with
smaller average enrollments will receive higher
funding.3
Thus, poorer schools receive four times
the rule-based allocation of richer schools and
rural schools receive three times the allocation
of urban schools.
• Equity of discretionary funds. There is no
evidence that discretionary funds are distrib-
uted in a progressive manner, with poorer
schools receiving more than their richer
counterparts. If anything, discretionary fund-
ing within rural areas has a higher probabil-
ity of being disbursed to wealthier schools,
while allocations in urban areas are wealth
neutral.
• Equity of staff compensation. The data show
that the per-pupil compensation of staff is
higher in richer and more urban schools, and
this arises primarily from higher class sizes and
the extensive use of teacher-trainees in rural
areas.
• Overall equity in funding. Since discretion-
ary disbursements can be very large, once
these are accounted for the progressive na-
ture of the rule-based allocations disappears.
At best, funding that flows from the district to
the school is wealth neutral (with no signifi-
cant differences in received amounts across
rich and poor schools), and at worse it is re-
gressive for rural and progressive for urban
schools. Once staff compensation is factored
into the analysis, the results show that the only
progressive component of the education sys-
tem is the rule-based allocation. Once per-
pupil teacher funding is added in, the entire
education funding system becomes regressive
with poorer schools (K 14,531 per pupil) re-
ceiving less than richer schools (K 19,826 per
pupil).
PRIVATE SPENDING
This then opens up the question of household in-
puts into education. If there are huge funding differ-
entials between schools (for instance, the rule-based
component implied that per-pupil funding could vary
from K 1,889 to over K 8,000 depending on school
size), do households adjust contributions to account
for the level of school receipts from the public fund-
ing system? If yes, how does this household spending
impact on funding equity in the education system? The
report presents some preliminary results relating to
both household contributions to school funding, as
well as household private expenditure on education
that complements the construction of the public ex-
penditure system presented here.
Theissueofhouseholdcontributionstoschoolfund-
ing is at an important juncture in Zambia. Anecdotal evi-
dence from a number of studies during the 1990s sug-
gested that schools had started charging higher Parent
Teachers Association (PTA) fees, and a concurrent de-
cline in net enrollment during the same time period led
to an correlation between lower enrollment and high
PTA fees. Consequently, in April 2002 (three months
prior to the fielding of the ESDS) PTA fees were abol-
ished for primary and basic schools and the government
reiterated its commitment to free basic education.
With this background in mind, the key findings
regarding household contributions to school fund-
ing follow:
• The announcement seemed to have had the
desired effect. PTA fees decreased to less than
30 percent of 2000 values, although this decline
is concentrated primarily in the urban areas of
Lusaka and Copperbelt. The gradient between
PTA fees and school wealth has also declined
sharply during the same period.
• For all provinces, but especially for Eastern and
Northern provinces, public funds are the most
important source of financial flows to the
school, comprising 96 percent of the total fund-
ing of the schools in Eastern province (the most
reliant on public funds) and 82 percent in Lusaka
province (the least reliant).
• Since the contribution of households to school
funding is small, the addition of private funds
should not alter the results regarding equity in
school funding obtained in the previous section,
and this is indeed the case. Thus, the difference in
xiv
private contributions between schools with
poorer and richer households is only K 1,300 per
pupil compared to K 3,100 for public funding.
• Examining only private contributions to school
funds can be misleading if most inequality in
private expenditure is at the level of the house-
hold,i.e.,throughprivate,household-levelnonfee
spending (purchase of textbooks). The final sec-
tion examines this aspect of educational funding.
• Nonfee expenditures are seven times the cor-
responding expenditure on school fees. Thus,
nonfee expenditures are the main source of
inequalities in private expenditure. When such
private spending is included in the total funding
picture, the nonprogressive nature of the pub-
lic funding system worsens: the share of edu-
cational expenditures for the poorer 50 per-
cent of the population declines from 40 to 34
percent once private expenditures are factored
into the analysis.
• There isstrongevidencethathouseholdsdecrease
spendingwhenpublicfundingincreases. Thissug-
gests that, although public funding could address
inequalities in educational spending by progres-
sive allocation across villages and schools, the de-
sired impact of such redistributions may be less
than imagined due to the crowding-out of private
expenditures.
DISCUSSION AND CONCLUSIONS
This report makes three contributions to the
understanding of education funding in the Zambian
context. First, it shows that funding characteristics
are closely linked to the type of funding and the way
it is disbursed. In the case of rule-based funding, the
disbursement system seems to works efficiently and
there is no evidence that such funds are diverted
from their stated purpose. The majority of discre-
tionary funds, however, are spent at the district and
provincial levels, and less than 20 percent is allocated
to schools.
Second, analyzing funding equity using the
wealth of pupils in the school shows that the spe-
cific rule used in the case of rule-based allocations
has led to greater per-pupil funding for poorer and
more rural schools. However, these allocations are
the only progressive disbursements. Per-pupil staff
allocations are higher in urban and richer schools.
For discretionary allocations there is evidence of
higher disbursements to richer schools within ru-
ral areas, and wealth-neutral allocations within ur-
ban areas. Once all sources of public funding are
factored into the analysis, public school funding in
Zambia is regressive, with almost 30 percent higher
allocations to richer schools.
Third, the report shows how private expendi-
ture at the level of the household impacts equity in
education funding. It argues that nonfee expendi-
tures incurred by households, rather than contri-
butions to school funds through PTA and other fees,
are the major source of inequalities in the current
environment. Moreover, it find evidence that house-
holds decrease private contributions when public
funds to the schools increase.
If the government wishes to allocate higher fund-
ing to poorer schools, these findings suggest that a
greater percentage of all funding allocation should
be rule-based. It was initially thought that the pro-
cess of decentralization would partially fulfill this
need, since more money would flow directly to the
districts, making accountability and therefore dis-
bursements higher. Unfortunately decentralization
seems to have only shifted spending from the prov-
ince to the district, and, in terms of funding equity,
it is precisely at the district level that richer schools
are receiving higher discretionary funds than their
poorer counterparts.
Even if rule-based funding were to increase,
three subsidiary implications need to be carefully
evaluated. First, the current rule-based allocation
implies that schools fare better in terms of per-pu-
pil funding if they decrease enrollments. A more
common funding rule (used, for instance, in Uganda)
is based on transfers that increase the number of
enrolled children (such as $1 per enrolled child).
There is unfortunately no guarantee such a scheme
would work as well as the current, unambiguous
rule. One suggestion would be to continue with the
current rule (which also has the desired equity im-
plications), but to monitor enrollment carefully
through regular data collection under the school
census.
Second, an increase in public funds to schools
crowds out private spending. Although the results
presented here are preliminary, there is evidence
that this crowding-out can be fairly large. Thus,
xv
public funds may be far more effective at address-
ing inequalities across rather than within villages. This
would suggest targeting at the level of schools, with
greater funding to poorer regions.
Third, the crowding-out of private expenditures
by public funding implies that rule-based funds may
not have the desired impact on learning achieve-
ment. Since for every dollar of school funding, pri-
vate funding decreases, the true increase in total
funds available for education is much less than the
additional dollar. This would suggest that increases
in funding may not be the optimal way to improve
educational attainment. It might be more benefi-
cial to concentrate instead on providing inputs that
households cannot supply on their own, such as
high-quality teachers.4
NOTES
1. In Kwacha terms, schools receive either K 2.6 mil-
lion or K 3.0 million. We use the dollar equivalents at the
exchange rate of $1=K4,400.
2. Unless of course, rich schools systematically de-
preciate their infrastructure faster than poor schools, but
this does seem unlikely a priori.
3. Consider two districts each with 100 schools but
average enrollments of 50 (district A) and 100 (district
B). Since the rule-based allocation is a fixed per-school
grant, both districts receive exactly the same allocation.
However, since district A has a smaller number of stu-
dents than district B, the average per-pupil grant will be
much higher in district A compared to district B.
4. This argument will be developed fully in another
report on the relationship between schooling inputs and
learning achievement.
Introduction
1
T
he importance of education for development
provides a strong case for allocating public
expenditures to the education sector. But
simply allocating more central budgetary resources
to the education sector may not deliver better out-
comes. Budgetary resources may not reach the in-
tended beneficiaries, and even if they do, these re-
sources may not lead to the desired outcomes. This
report examines the structure of funding and ser-
vice delivery in Zambia using a recently completed
Educational Service Delivery Survey (ESDS).
The Government of the Republic of Zambia
(GRZ) has long recognized the importance of edu-
cation. It set up universities immediately following
independence and has focused more recently on
attaining equity and quality in primary education.
Nevertheless, a sharp decline in copper prices since
the mid-1980s (the main export) and a commensu-
rate decline in GNP per capita (from $590 in 1975
to $300 in 2000) has presented several obstacles for
the education sector.
To overcome these obstacles, the government and
a consortium of donors have been working together
to improve educational outcomes in the country. Some
of these changes are directly related to overall financ-
ing of education and others aim to improve the deliv-
ery of education by changing the administrative and
institutional structure of education delivery.
The Education Service Delivery Study (ESD) is
designed to examine the structure of funding and
implications for service delivery, and the relation-
ship between public expenditure and educational
outcomes. Specifically, it tries to answer two ques-
tions: (1) What is the current record of the educa-
tion sector in delivering services to the intended re-
cipients? (2) Have the changes undertaken by the
Ministry of Education had the desired consequences
in terms of educational outcomes?
The study specifically takes into account linkages
that may arise among the different players involved
in the delivery of education (for instance, the district
education office, Parent Teachers Associations, the
provincial education office, schools, and pupils) and
examines the way these players respond to changes
in the institutional setting and funding structure.5
The
ESD addresses these issues through the careful mea-
surement of school inputs (the subject of this re-
port), and educational outcomes through tests ad-
ministered to the same pupils at two different times
in collaboration with the Examination Council of
Zambia (another report).
This report focuses on public and private expen-
diture at the school level. It provides a detailed evalu-
ation of public expenditure through a tracking and a
funding-equity exercise, which gauges the extent to
which educational expenditures earmarked under the
central budget actually reaches schools, as well as the
extent to which such funding can be regarded as pro-
gressive. A related body of work in Uganda (Ablo and
Reinikka 2000; Reinikka and Svensson 2002) shows
that the traditional view of the government as a be-
nevolent agent is highly simplistic—public funding may
not matter simply because it does not reach grassroot
levels of the administrative structure.
17
18 • AFRICA REGION HUMAN DEVELOPMENT WORKING PAPER SERIES
Of the four questions that repeatedly concern us
during this exercise, the first three relate to the public
funding of education and the last examines private
educational funding and its relationship to public ex-
penditure.
• What percentage of resources is spent at each
level of the administrative hierarchy?
• To what extent is variation in funding across
districts and schools explained by funding for-
mulas that relate budgetary allocation to dis-
trict and school characteristics, such as enroll-
ment or the number of schools?
• To the extent that there is variation in funding
across districts and schools, what is the rela-
tionship between this variation and character-
istics of districts and schools? (For instance, do
richer districts and schools systematically re-
ceive more funds?)
• How important is private funding in the provi-
sion of education and how does this compo-
nent of funding relate to equity in the overall
funding of education?
The findings from this report provide the basis
for the second component of the ESD study (an-
other report), which relates the availability of fund-
ing to improvements in learning outcomes in Zam-
bian schools. The main concern in addressing this
set of issues arises from the observation that
lower school funding does not in itself imply
worse outcomes. Problems of inappropriate use
may be worse at the level of the school or higher
levels of the administration may be better able to
use available resources. The second component of
the study on enrollment and learning outcomes will
make some welfare statements regarding the find-
ings of the current report.
This report is structured as follows. Section 2 pro-
vides a brief history of education in Zambia during
the 1990s. Section 3 describes the methodology, and
section 4 describes the school sample. Funding flows
are examined in section 5, and section 6 discusses
leakage. Section 7 addresses the equity aspects of
education funding and examines the association be-
tween funding and school and district characteris-
tics. Section 8 presents preliminary results from the
related household survey on private expenditures.
Section 9 concludes.
NOTES
5. Todd and Wolpin (2003) illustrate this kind of link-
age. An intriguing aspect of the link between public ex-
penditure and education is that it is extremely hard to
demonstrate any effect of increased funding to schools
on learning by pupils (see for instance, Hanushek 1986).
Todd and Wolpin argue that a potential reason for this
(weak) relationship is that households change their be-
havior with the level of public funding; when public ex-
penditure is high, households spend less and vice versa,
keeping the overall level of schooling inputs for the child
constant.
Zambian Education during the 1990s
2
A
decline in copper prices has been accompa-
nied by a commensurate decrease in income
and government resources. Since 1998 do-
mestic financing fell from 2.3 percent of GDP to only
2.1 percent in 1999, and although the share of pri-
mary education has increased from 54 to 57 per-
cent over the same time period, net funding for pri-
mary education has declined (World Bank 2001;
Siamatowe 2002). Equally important, actual overall
expenditure has declined during the past six years,
from US$ 97 million in 1996 to US$ 74 million in
2000 (Siamatowe 2002). As a result, average real per
capita government education expenditure in 1996–
98 was only 73 percent of its 1990–92 level, declin-
ing further to an average of 60 percent of this level
by 1999–2000.6
This decline in funding seems to have
had a number of undesirable impacts.
First, primary school enrollment is currently low,
and there is strong evidence that it has fallen in the
last decade. Table 1 shows that net enrollment
Table 1. Enrollment Rates, 1992–2001
(percent)
Enrollment rates 1992 1996 2001
Net (Gross) enrollment rate (Primary)
Female 66 57 60
(92) (77) (78)
Male 65 54 60
(107) (86) (90)
Net (Gross) enrollment rate (Secondary)
Female 6 12 16
(9) (16) (24)
Male 8 11 16
(16) (23) (29)
School participation rate (Primary)
Female 77 68 67
Male 77 66 67
School participation rate (Secondary)
Female 46 45 48
Male 65 61 66
Data sources: Analysis based on Demographic and Health Surveys (1992, 1996, and 2000). The net enrollment rate and
gross enrollment rates follow standard definitions. The school participation rate (primary) is defined as the percentage of
children between 7 and 13 years of age enrolled in school at the time of the survey. The secondary participation rate uses the
age group 14 to 18 instead.
19
20 • AFRICA REGION HUMAN DEVELOPMENT WORKING PAPER SERIES
stood at 60 percent in 2001, with limited gender
disparity at the primary school level.7
These levels
are similar to Kenya, higher than Mozambique, but
below levels typically attained in other Southern Af-
rican countries.8
Net primary school enrollment rates
for both girls and boys over the last decade have
declined by 5 percent. Although declines of a similar
magnitude are found in other African countries like
Botswana and Lesotho, the decline in Zambia is
larger than in comparable countries, such as
Mozambique or Tanzania (UNESCO Edstats 2002).
Figure 2 shows further characteristics of school
enrollment in Zambia based on age-specific enroll-
ment rates (Filmer and Pritchett 1999). The indi-
vidual curves show the proportion of children en-
rolled in school at the time of survey, where the pri-
mary data is based on the Demographic and Health
Surveys from 1992 and 1996. Net enrollments are
substantially higher in urban areas, and the differ-
ences in enrollment between the poor and the rich
are also substantial.9
Moreover, the curves clearly
show delayed enrollment among all income groups
in Zambia. Even among the rich (1996 survey), en-
rollment is less than 50 percent for children aged
seven or less. Finally, in every income group across
rural and urban locations there has been a decline in
enrollment between 1992 and 1996, and this decline
appears to be particularly severe for middle-income
groups.
Other characteristics based on the Living Condi-
tions Monitoring Survey (LCMS) data (World Bank
1998) show further problems with grade-specific
enrollment rates in grade 1 and grade 7, and pro-
gression rates between grade 8 and 9. The LCMS
data show rapid declines in enrollment over the
years, suggesting substantial dropout. While 90 per-
cent net enrollment at grade 1 is achieved, this fig-
ure is 34 percentage points lower by grade 7. Fur-
ther, the progression rate from grade 7 to 8 ap-
pears to be only 33 percent. Data comparability
Figure 2. Characteristics of School Enrollment in Zambia
Source: Based on Filmer and Pritchett (1999).
1992
1996
1992
1996
1992
1996
Low income
0
0.2
0.4
0.6
0.8
11
6 7 8 9 10 11 12 13 146 11 12 136
Rural
Proportioncurrently
enrolled
0
0.2
0.4
0.6
0.8
11
6 7 8 9 10 11 12 13 146 11 12 136
Age
0
0.2
0.4
0.6
0.8
11
6 7 8 9 10 11 12 13 146 11 12 136
Urban
Middle incomeHigh income
0
0.2
0.4
0.6
0.8
11
6 7 8 9 10 11 12 13 146 11 12 136
Age
0
0.2
0.4
0.6
0.8
11
6 7 8 9 10 11 12 13 146 11 12 136
Age
Percentcurrently
enrolled
AgeAge
1992
1996
1992
1996
1992
1996
Low income
0
0.2
0.4
0.6
0.8
11
0
0.2
0.4
0.6
0.8
11
6 7 8 9 10 11 12 13 146 11 12 136
Rural
Proportioncurrently
enrolled
0
0.2
0.4
0.6
0.8
11
0
0.2
0.4
0.6
0.8
11
6 7 8 9 10 11 12 13 146 11 12 136
Age
0
0.2
0.4
0.6
0.8
11
0
0.2
0.4
0.6
0.8
11
6 7 8 9 10 11 12 13 146 11 12 136
Urban
Middle incomeHigh income
0
0.2
0.4
0.6
0.8
11
0
0.2
0.4
0.6
0.8
11
6 7 8 9 10 11 12 13 146 11 12 136
Age
0
0.2
0.4
0.6
0.8
11
0
0.2
0.4
0.6
0.8
11
6 7 8 9 10 11 12 13 146 11 12 136
Age
Percentcurrently
enrolled
AgeAge
PUBLIC AND PRIVATE FUNDING OF BASIC EDUCATION IN ZAMBIA • 21
appears difficult, but this latter figure appears to
be lower than most other African countries, es-
pecially in Southern Africa.10
This suggests that in
Zambia, in addition to declining enrollments over
the last decade, there seems to be a particular
problem with pupil retention within the primary
education system and progression after grade 7.
Since 1998, however, the government in col-
laboration with a consortium of donors has
worked actively to reverse steadily declining out-
comes in the education sector. Specifically, the
government’s Basic Education Sub-Sector Invest-
ment Program (BESSIP) was the subject of a Joint
Appraisal in September 1998, and donors made
new financing commitments in support of BESSIP
beginning in 1999. This collaboration has resulted
in changes both in the funding of education and
the administrative structure of education delivery
(decentralizing decisions and funding to the district
level through district education boards is one such
example), teacher deployment, and the ability of
schools to levy fees and contributions. This re-
port examines whether further changes can be
made to the institutional structure of education
delivery to improve outcomes in the education
sector.
NOTES
6. World Bank data based on Government of Zambia
Financial Statements.
7. Depending on the sources used, net enrollment
varies from 68 to 72 percent, so that 72 percent repre-
sents an upper bound.
8. See, for example, online educational databases such
as World Development Indicators (World Bank) and
Edstats (UNESCO)).
9. These two statistics are not unrelated, since rural
poverty is still substantially higher than urban poverty (83
versus 56 percent) despite some recent increases in ur-
ban poverty (World Bank 2001).
10. For instance, this is lower than Mozambique for
1990 (39 percent), but higher than Tanzania in 1998 (14
percent).
Tracking Methodology
3
T
he tracking exercise was designed to collect
information on the effectiveness of funding
programs in reaching their intended benefi-
ciaries, and the relationship between increased fund-
ing at the central level and educational outcomes in
schools. The survey was carried out at various lev-
els of the administrative structure, including the prov-
ince office (immediately below the Ministry of Edu-
cation), the district office, schools, and households.
The tracking exercise follows the flow of funds and
educational resources from the Ministry of Educa-
tion to the province education office and then on-
ward to the district education office and the schools.
While in theory such an exercise may seem relatively
straightforward, the complexity of funding flows and
the multiplicity of sources at each level of the ad-
ministration for educational funding and materials
makes this exercise challenging.
In the Zambian education sector, funding to
schools has three separate components. The first is
a per-school grant of $600 (for primary) and $650
(for basic) schools.11
The second is the money dis-
bursed by districts (and in some cases provinces),
presumably using some notion of need at the level
of the school. The third is remuneration of staff
through salaries and benefits. What does this fund-
ing structure imply for the tracking of public expen-
ditures?
In the Uganda study (Ablo and Reinikka 2000),
the government used a clearly defined rule to allo-
cate funds to schools. Schools were allocated $1 for
each enrolled child. In this context, leakage in public
funding was defined as the ratio of what a school
actually received to what the school was supposed
to receive. The per-school grant in Zambia corre-
sponds exactly to the per-pupil grant in Uganda.
Analogous to the Uganda study, leakage in rule-based
allocations in Zambia can be defined as follows:
Leakage =
Unlike the Uganda study, however, this report
goes beyond an estimate of leakage in allocated
funds. It uses an innovative approach to provide a
complete picture of the funding for educational in-
stitutions by examining all sources of funding for the
school. In the case of the fixed grant and the salary
component, the Uganda methodology is used to de-
termine leakage in the system. But in the case of
discretionary components, this methodology fails since
there is no rule about the amounts that schools are
supposed to receive. Therefore, it is not possible to
benchmark the amounts that schools actually receive
or determine what constitutes leakage in the sys-
tem.
This problem is addressed by classifying funding
flows into the rule-based component (the $600 fixed
grant), the discretionary component (infrastructure
and other grants), and the payroll component, and
focusing on three related issues:
• The pure tracking exercise first asks how much
money per pupil is available at each level of the
delivery chain (see section 5). This addresses the
issue of the percentage of spending undertaken
22
amount received by school
$600 ($650 for basic schools)
PUBLIC AND PRIVATE FUNDING OF BASIC EDUCATION IN ZAMBIA • 23
at different levels of the hierarchy and the
amount that finally reaches the schools.
• The estimate of leakage focuses on the rule-
based allocations and payroll components (see
section 6).12
• Equity in funding examines the degree to which
variation in funding across districts and schools
is explained by funding rules (see section 7). To
the extent that there is excess variation after ac-
counting for differences due to funding rules, the
relationship between this excess variation and
district and school characteristics is analyzed.
The entire equity exercise is made possible
through the careful data collection on the household
assets of pupils in the school. Such data is normally
not available as part of expenditure tracking surveys.
This report shows that the regular collection and
analysis of this information has important repercus-
sions for policies regarding the delivery of educa-
tion.
Educational funding in Zambia derives both from
domestic (GRZ) funding and funding from donors.
In the case of donors, funds are divided into four
categories: donor funds bracketed as Case I, Case II
or Case III, which are controlled by the Ministry of
Education, and Case IV donors that administer funds
directly.13
While most funding is theoretically ob-
tained from the GRZ, a clear distinction at all levels
of the administration is maintained throughout the
report between BESSIP funding (the program linked
to the consortium of donors that form Case I–Case
III) and other GRZ funding.
To better understand the flow of funds and re-
sources, it is useful to build classifications based on
the type of resource (fund) and the underlying ad-
ministrative structure, and the level of discretion at
each level of the administration to allocate and dis-
tribute such flows. Resources and funds are divided
into three categories: educational materials (such as
textbooks), monetary (only cash), and payroll (re-
muneration of staff). The four provinces of the sur-
vey are divided in two categories: provinces with dis-
trict education boards (henceforth decentralized prov-
inces—Lusaka and Copperbelt in the sample) and
provinces without district education boards (hence-
forth centralized provinces—Northern and Eastern
in the sample).14
Using this typology, school funding is composed
of five types of funds and resources:
• Cash flows: fixed-grant component. The
fixed-grant component (also referred to as the
BESSIP grant) is the per-school allocation of ei-
ther $600 or $650, and no level of the adminis-
tration has discretion over the amount dis-
bursed. No information is required for the dis-
bursement of funds as in the per-pupil allotment
in Uganda, where data is required on enroll-
ments in the school, and which may be subject
to distortions at the level of the school or dis-
trict. The fixed-grant is a rule-based component
of school funding.
• Cash flows: infrastructure grants. Schools also
receive money for rehabilitation of classrooms
or for new construction (infrastructure). This
money is disbursed through the microprojects
unit of the Zambian Social Investment Fund, but
the district retains considerable discretion over
disbursement. Such grants are part of the dis-
cretionary component of school funding.
• Cash flows: other grants. Schools may re-
ceive additional money from the GRZ or Case
IV donors (mostly funding through the Program
for Advancement of Girls’ Education), and these
resources are distributed entirely at the discre-
tion of the district. Consequently, as with (2)
above, these grants are classified as a discre-
tionary component of school funding.
• Flows of educational materials. Schools may
receive educational materials such as textbooks
and chalk, again allocated at the discretion of
the district, with some input from the provinces
and the Ministry of Education. Although it is
technically possible to track such resource
flows, the procurement of educational materi-
als had not yet been completed at the time of
the survey (midway through the academic year).
As a result, schools received such materials spo-
radically and in very small quantities. This com-
ponent is excluded from the exercise.
• Payment of staff. Staff remuneration can be
thought of as arising from rule-based and dis-
cretionary components. Specifically, the salaries
and allowances of teachers are paid through the
centralized payroll system. Neither provinces
nor districts have discretion over the salary or
24 • AFRICA REGION HUMAN DEVELOPMENT WORKING PAPER SERIES
allowances that a teacher receives, so this is
identified as a rule-based component of staff
payment. On the other hand, payments of
one-time benefits (detailed below) are left to
the discretion of districts and provinces, so this
is identified as a discretionary component.
Since most staff remuneration is a direct flow
from the center to the teachers payroll funds
are omitted from the tracking exercise,15
and
this component in discussed in the sections on
leakage and funding equity. The structure of fund-
ing flows is summarized in table 2.
SUMMARY
Funding flows to schools in Zambia are divided
into a rule-based component and a discretionary
component to track and analyze the level of expen-
ditures at each level of the administrative hierarchy.
a. Northern and Eastern province in the ESDS.
Table 2. Structure of Resource and Funding Flows in Zambia
Ministry of
Education/ Ministry
of Finance
Does
province
have
discretion?
(centralized)a
Does province
have
discretion?
(decentralized)
Does district
have
discretion?
(centralized)
Does district
have
discretion?
(centralized)
What can the
school/teachers
expect to
receive?
Flows of
educational
materials
(discretionary)
Handles
procurement and
distributes to
provinces/districts
YES
Decides how
much to
pass on to
district
NO
Materials
passed
directly to
districts
YES
Decides how
much to
pass on to
schools
YES
Decides how
much to
pass on to
schools
Depends on
district
Payment of staff:
salaries and
allowances
(rule-based)
Completely
centralized and
are made directly
to teachers
NO NO NO NO Teachers
receive
salaries and
allowances
according to
the salary
scale
Payment of staff:
One time
benefits
(discretionary
payments)
Disburses funds to
provinces and
districts for such
payments
YES YES YES YES Payments for
one-time
benefits such
as leave and
transfers
Cash flows from
GRZ: fixed
grant (rule-
based funding)
An allocation of
either $600 or
$650 is made to
every primary-
basic school.
NO NO NO NO $600 or $650
Cash flows from
GRZ:
(discretionary
funding)
Allocations are made
for recurrent and
capital
expenditures, as
well as
disbursement to
districts/schools
YES
Decides how
much to
pass on to
districts
NO
Districts
receive most
money
directly
YES
Decides how
much to
pass on to
schools
YES
Decides how
much to
pass on to
schools
Depends on
district:
Schools may
expect to
receive money
for recurrent/
infrastructure
expenditures
Cash flows from
case IV donors
(discretionary
component)
No discretion. Most
money from case
IV donors is for
PAGE (Program
for Advancement
of Girls’
Education)
YES
Province
decides
how much
to pass on
to districts
NO
Districts
receive most
money
directly
YES
District
decides
how much
to pass on
to schools
YES
District
decides how
much to
pass on to
schools
Depends on
district
PUBLIC AND PRIVATE FUNDING OF BASIC EDUCATION IN ZAMBIA • 25
For the rule-based and payroll components, leakage is
identified as the ratio of what the school received to
what the school was supposed to receive. The analysis
of equity in funding flows examines total funding per
pupil, including the two components above, as well as
remunerationofstaff,andstudiesthecorrelatesofsuch
funding with particular emphasis on the wealth of stu-
dents’ households. In order to analyze equity in fund-
ing, it is critical to establish a tracking exercise (see sec-
tion 5). One far-reaching conclusion from the Uganda
study was that budgetary allocations cannot be used as
a proxy for funding at the school level.
NOTES
11. In current terminology, a “lower-and-middle ba-
sic school” offers grades 1–7 and a “full-basic school”
offers grades 1–7 and continues to grades 8-9. This re-
port refers to them as primary schools, (grades 1–7), and
basic school, (grades 1–9).
12. For discretionary components, we remain ag-
nostic about whether low/high receipts at the school
level constitute good or bad service delivery. This is-
sue is addressed in a follow-on report on outcomes
and efficiency of public spending.
13. DFID, Ireland, the Netherlands, and Norway
contribute to the Case I pool; IDA credit is Case II;
the African Development Bank is Case III; and USAID,
JICA, and Denmark follow Case IV.
14. The prevalence of both systems of adminis-
tration arises because district education boards have
been phased in since 2000. Decentralization was in-
troduced to grant greater autonomy to districts and
to reduce their dependence on the province for fund-
ing.
15. The money for salaries and allowances are dis-
bursed directly to teachers so that no money passes
through the administrative chain. Although it is theo-
retically possible to track one-time benefits, these
funds are not earmarked for such disbursements and
hence cannot be traced through the system.
School Characteristics of the Sample
4
T
his section provides a brief introduction to
the sample. The schools surveyed were cho-
sen from a list frame of primary and basic
schools in four Zambian provinces: Lusaka,
Copperbelt, Northern, and Eastern. A random
sample stratified on the basis of urban and rural lo-
cations included 184 schools in 33 districts. As part
of the re-testing exercise, 3,200 pupils formed the
initial sample for the administration of tests in En-
glish, mathematics, and vernacular (Icibemba or
Nyanja).16
The choice of these four provinces was
dictated primarily by the variation in educational at-
tainments, regional incomes, and administrative
structures. Specifically, Lusaka and Copperbelt are
the two richest provinces in Zambia, with commen-
surately high enrollment rates, and Northern and
Eastern provinces are the poorest, with enrollment
rates only marginally better than the worst perform-
ing Central province (table 3). Learning outcomes
confirm the wide disparities in performance among
the provinces studied: apart from Northwestern
province, Northern and Eastern provinces reported
the worst English and mathematics scores, while
Lusaka reported the best (table 4).
The schools in the sample are grouped into four
descriptive categories: school enrollment and staff-
ing, school infrastructure, school performance, and
characteristics of households in the school. Since sig-
nificant differences are likely to emerge between
urban and rural schools, the summary statistics are
disaggregated by school location.
Table 5a shows significant differences between
rural and urban schools in enrollment and staffing.
Urban schools tend to have large enrollment (an av-
erage of 1,440 pupils per school compared to 554
Table 3. Enrollment, Urbanization, and Poverty
(percent)
Net Poverty
enrollment head Population
Province age 7–13 count Rural share
Central 75 77 66 10
Copperbelta
76 65 23 18
Easterna
49 79 91 13
Luapala 61 81 86 7
Lusakaa
79 53 19 15
Northerna
60 82 84 12
North Western 66 76 86 6
Southern 73 75 80 12
Western 64 89 90 7
All Zambia 68 73 63 100
a. Provinces covered in the ESD sample.
Source: World Bank (1998).
Table 4. Mean Math and English Scores, by Province
Province English Math
Central 9.02 14.94
Copperbelta
9.06 13.60
Easterna
9.02 13.56
Luapula 9.68 13.90
Lusakaa
10.34 15.16
Northerna
8.68 13.21
North Western 7.76 13.37
Southern 9.43 14.37
Western 8.95 13.62
a. Provinces covered in the ESD sample.
Source: ESDS team calculations based on Examination
Council Data.
26
PUBLIC AND PRIVATE FUNDING OF BASIC EDUCATION IN ZAMBIA • 27
for rural schools), but the difference in size is more
than compensated for by the difference in staffing.
The pupil-teacher ratio in urban schools at 42 is much
closer to the Zambian goal of 40 pupils per teacher
than the rates in rural schools at 61.17
Also notewor-
thy is the large difference in female teachers between
urban and rural schools. Female make up 70 per-
cent of the teaching workforce in urban schools,
and 31 percent in rural schools. Conversations with
teachers suggest that safety and the lack of teacher’s
housing is a major concern in rural areas. If there is
a significant difference in performance by the gen-
der of the teacher, this is an area for future policy
consideration.
Table 5b shows the distribution of key infrastruc-
ture variables in urban and rural schools. All three
variables reported—number of pupils per classroom,
number of students per toilet, and number of teach-
ers per staff house—suggest considerable over-
crowding, although the lack of data from other coun-
tries does not allow us to establish a suitable bench-
mark. With an average of 6.4 teachers per staff
house, it appears there is a considerable shortage of
staff housing in the system. Interestingly, for all three
indicators of infrastructure, rural schools perform
better than their urban counterparts, and this differ-
ence is significant for toilets per pupil and teachers
per available staff house.
The next two tables provide performance indi-
cators for, and household characteristics of, children
in the school. Table 5c shows four key indicators of
performance: children repeating classes, dropouts,
and performance on examinations for male and fe-
male students. Two key points emerge. First, rural
schools perform significantly worse than urban
schools in terms of repetition and dropouts. Close
to 10 percent of students in rural schools repeat a
grade, whereas 5 percent of students in urban schools
repeat a grade. Similarly, dropouts in the previous
year as a percentage of current enrollment was 5
percent in rural schools and 2 percent in urban
schools. The poorer performance of rural schools,
however, did not extend to performance on the na-
tionwide grade 7 examination in 2000. In fact, rural
schools performed slightly better, achieving a pass
rate of 51 percent (males) and 45 percent (females),
compared to 44 (males) and 43 (females) percent
for their urban counterparts.18
Table 5d presents households indicators for rural
and urban schools. Two characteristics emerge from
this table. First, children attending rural schools come
from poorer households compared to their urban
counterparts (the average difference exceeds one
standard deviation in the wealth distribution). Sec-
ond, although averages are very high, school atten-
dance for single and double orphans is the same in
Table 5a. School Enrollment and Staffing
Variable Urban Rural Difference
School size 1439.5 553.4 886.56a
(number of pupils) (74.23) (38.19)
Number of 37.5 12.8 21.98 a
teachers (1.67) (1.15)
Female teachers as 69.0 30.9 –38.10 a
percent of total (5.6) (4.3)
Pupil-teacher 42.25 60.96 –18.70 a
ratio (2.93) (3.76)
a. Difference is significant at the 5 percent confidence level.
Standard errors in brackets.
Source: ESD sample.
Table 5b. Infrastructure
Variable Urban Rural Difference
Number of pupils per 103.4 96.7 6.73
classroom in good condition (7.14) (4.76)
Number of pupils per 198.9 113.2 85.72*
toilet in good condition (39.9) (15.2)
Number of teachers per 11.39 4.34 7.04*
staff-house in good condition (2.01) (0.827)
a. Difference is significant at the 5 percent confidence level.
Standard errors in brackets.
Source: ESD sample.
Table 5c. Key Performance Indicators
Variable Urban Rural Difference
Repeating the same 4.7 9.45 –4.74*
grade (percent) (0.49) (0.62)
Dropouts as ratio of current 1.67 4.56 –2.88*
enrollment (percent) (0.32) (0.47)
Pass-rate in 2000 Grade 44 50.5 –6.50
VII examination (males) (6.1) (4.8)
Pass-rate in 2000 Grade 42.5 44.5 –2.00
VII examination (females) (6.0) (4.8)
a. Difference is significant at the 5 percent confidence level.
Standard error in brackets.
Source: ESD sample.
28 • AFRICA REGION HUMAN DEVELOPMENT WORKING PAPER SERIES
rural and urban. On average, one in every 13 pupils is a
single orphan (has lost a single parent) and one out of
every 25 pupils is a double orphan (has lost both par-
ents). From this table one would expect a priori that
vulnerabilityisasignificantprobleminruralschoolscom-
pared to urban schools in terms of overall poverty, but
not in terms of the orphan status of the child.
SUMMARY
This section provides insights regarding the
equity aspects of the rule-based component of
funding. Because schools in rural regions tend to
have lower enrollment than their urban counter-
parts, and the rule-based funding is allocated on
a per-school basis, as long as schools receive the
allotted amounts, one would expect rural schools
to receive higher per-pupil amounts. This has di-
rect implications for equity. Since rural schools
are also poorer than urban schools, in theory,
rule-based funding should be highly progressive.
NOTES
16. Detailed notes on the sampling procedure can be
found at http://econ.worldbank.org/programs/
public_services/topic/tools.
17. This does not imply that classes are bigger in rural
schools. Data from the survey suggests that teachers in
rural schools teach more hours than their urban counter-
parts, and as a result the average class size is actually lower
in rural schools.
18. This is probably due to greater ability-based selec-
tion into higher grades in rural areas. For instance, in rural
areas 40 percent of students do not make it to grade 7. If
these children are worse than the average enrolled child,
test scores in rural areas will reflect this selection process.
Table 5d. Household Indicators
Variable Urban Rural Difference
Average value of wealth
index of households with 0.74 –0.44 1.18*
children in the school (0.067) (.05)
Percentage of children who 7.6 7.7 –0.10
are single orphans (3.2) (2.5)
Percentage of children who 4.72 4.79 –0.70
are double orphans (2.5) (1.9)
a. Difference is significant at the 5 percent confidence level.
Standard error in brackets.
Source: ESD sample.
Expenditure Tracking at Provincial, District,
and School Levels
5
T
his section examines whether schools actu-
ally receive the fixed-grant component, and
whether provinces and districts further sup-
port poorer districts and school through discretion-
ary cash grants. The tracking exercise for nonsalary
funding assesses the total amount of cash available
at the province and district levels, and then tracks
the movement of funds from provinces to districts
and from districts to schools.19
Figure 3 highlights
the distinction between centralized and decentralized
29
Figure 3. Funding Flows across Centralized and Decentralized Provinces
Note: Decentralized provinces are Lusaka and Copperbelt. Centralized provinces are Northern and Eastern.
Ministry of
Education
(Centralized)
(Decentralized)
District
(Centralized)
District
(Decentralized)
SchoolsHouseholds
Discretionary flows
Rule-based flows
Case IV donors
(primarily the Program
for Advancement of
Girl’s Education
Ministry of
Education
(Centralized)
(Decentralized)
District
(Centralized)
District
(Decentralized)
SchoolsHouseholds
Discretionary flows
Rule-based flows
Case IV donors
(primarily the Program
for Advancement of
Girl’s Education
Province Province
30 • AFRICA REGION HUMAN DEVELOPMENT WORKING PAPER SERIES
provinces in terms of expenditure flows. The arrows
divide funding flows into rule-based and discretionary
components. One characteristic of the funding sys-
tem becomes immediately clear—funding in the sys-
tem does not flow in a top-down manner. Instead,
fresh money enters the hierarchy at each level.
In both centralized and decentralized provinces,
money given under the BESSIP program (Case I–Case
III donors) enters directly at the district level. In de-
centralized provinces other cash flows move directly
to districts. Finally, fresh money enters at the level
of the school through household contributions. An
accurate assessment of the resources available at
each stage involves tracking monetary flows from
the funding body immediately above as well as the
flows that directly enter the system at each level.
Each of these funds will be reported in terms of
Kwacha per pupil. Total funds are divided by total en-
rollment in the province (and similarly for districts and
schools).20
The data on enrollment is based on the
2001 schools census, using grade 1–9 pupils of all
schools for which the GRZ has some funding respon-
sibility (this includes schools aided by grants and com-
munity schools, but excludes five private schools).21
THE PROVINCIAL LEVEL
Cash receipts. Table 6 shows the cash received
per pupil at the level of the province averaged over
one year (June 2001 to June 2002). The pattern of
receipts at the provincial level are clearly in line with
expected receipts from the decentralization process.
The centralized provinces receive sums that are or-
ders of magnitude higher than their decentralized
counterparts, with Eastern province (K 29,000 per
pupil) receiving more than seven times the receipts
for Copperbelt (K 4,133 per pupil).
The amounts received in the centralized prov-
inces give a rough idea of the money passing to the
provinces from the ministry. From the Ministry of
Education “Financial Statistics 1986–2000” and the
BESSIP Financial Statement 2000, total per-pupil re-
current expenditure for basic schools (not includ-
ing salaries) is K 29,550 and total per-pupil capital
expenditure is K 36,519. Since money given to the
Table 6. Cash Received by Province
Education Offices
Cash receipts Total
Province (Kwacha primary
type Province per pupil) enrollment
Centralized Northern 19,779 235,012
Eastern 29,308 192,321
Decentralized Copperbelta
4,133 286,710
Lusakaa
8,034 206,318
a. Decentralized provinces with district education boards.
Source: ESD survey data and total primary enrollment date
from the Zambian School Census (2001).
Table 7. Funding Sources at Province Education Office Level, June 2001–June 2002
(Kwacha per pupil)
GRZ funding:
Case I– Case III pool GRZ funding Case IV
(external sources) (domestic sources) funding
Rule-based Discretionary Discretionary
component components components Discretionary
Province type Province (BESSIP) (HIPC Funds) (other GRZ) components Total
Centralized Northern 7,882 4,011 5,250 2,636 19,779
(40) (20) (27) (13) (100)
Eastern 2,206 8,947 14,801 3,354 29,308
(8) (31) (51) (11) (100)
Decentralized Copperbelta
475 1,764 1,300 593 4,133
(12) (43) (31) (14) (100)
Lusakaa
704 5,828 1,350 152 8,034
(9) (73) (17) (2) (100)
Note: Percentages (in brackets) may not add up to 100 due to rounding.
a. Decentralized provinces with district education boards.
Source: ESDS.
PUBLIC AND PRIVATE FUNDING OF BASIC EDUCATION IN ZAMBIA • 31
province includes money for recurrent and capital
expenditures, an upper bound is that 95 percent of
total per-pupil expenditure is available at lower lev-
els in the case of Eastern province, and 65 percent is
available at lower levels in the case of Northern prov-
ince.
Table 6 also shows vast differences within cen-
tralized and decentralized provinces, with almost a
50 percent difference in cash received per pupil be-
tween Eastern and Northern provinces, and a 100
percent difference in cash received between Lusaka
and Copperbelt. Table 7 examines these differences
further by looking at the receipts per province from
the four sources of funding: BESSIP, HIPC (Debt Ini-
tiative for Heavily Indebted Poor Countries of the
World Bank), and other GRZ and Case IV donors.
Two characteristics stand out. First, the funding
from nondomestic sources (BESSIP and HIPC), con-
sistently exceeds 60 percent of total funding for all
provinces (except Eastern with 49 percent). Second,
there is no clear pattern in terms of a single prov-
ince receiving more or less than others from any
single source. Some receive more funding from
BESSIP sources (Northern), but less from Case IV
and domestic GRZ sources, while others (Lusaka)
receive very little from BESSIP, domestic GRZ, and
Case IV sources, but large amounts from HIPC.
Cash disbursements. From these financial re-
ceipts provinces disburse cash to districts. In the case
of decentralized provinces (which receive cash di-
rectly from the ministry), one would expect disburse-
ments to be very low. Table 8 confirms this with data
on disbursements to the districts over a six-month
period from January 2002 to June 2002. In per-pupil
terms, this is virtually nil for all cash in decentralized
provinces and for capital expenditures in centralized
provinces. However, in the centralized provinces
these disbursements represent a small proportion
of what the province actually receives. In Northern
province, disbursements to districts correspond only
to one-third of the annual funding that the province
received, and in Eastern province to only one-tenth.22
THE DISTRICT LEVEL
Cash received. Table 9 shows the cash re-
ceived at the district level.23
The data for one year,
from June 2001 to June 2002, are enrollment-
weighted averages across all districts in the prov-
ince. On average, districts in the Eastern and
Northern provinces receive much more (districts
in Eastern for example receive almost 60 percent
more than Copperbelt districts) than those in
Lusaka and Copperbelt, but this hides substantial
differences within provinces, an issue explored in
section 6.
Similar to cash flows at the provincial level (table
7), there are wide differences between district re-
ceipts across provinces from the four funding sources.
As table 10 shows, the higher level of funding per pu-
pil in districts in Northern and Eastern province re-
sulted primarily from the rule-based component of
the funding system, with the average district in East-
ern province receiving more than twice (219 percent)
the receipts of the average district in Copperbelt.
This variation follows entirely from the specific-
ity of the rule-based component, which takes the
form of lump-sum payments per school. In provinces
where the average school size is smaller, the fixed-
grant funding per student will be higher. According
to the 2001 school census data, Northern and East-
ern schools have, on average, about 315 pupils, while
Copperbelt schools have about 877 pupils, and
Lusaka schools have 1,037 pupils. The difference in
Table 9. Cash Received by Districts
(weighted average by province)
Cash receipts at district level
Province type Province (Kwacha per pupil)
Centralized Northern 24,196
Eastern 27,437
Decentralized Copperbelta
17,263
Lusakaa
20,690
a. Decentralized provinces with district education boards.
Source: ESDS.
Table 8. Funding Disbursed to Districts,
January 2002–June 2002
(Kwacha per pupil)
Province Recurrent Capital
type Province expenditures expenditures Total
Centralized Northern 3,381 264 3,645
Eastern 1,390 0 1,390
Decentralized Copperbelta
0 0 0
Lusakaa
397 0 397
a. Decentralized provinces with district education boards.
Source: ESDS.
32 • AFRICA REGION HUMAN DEVELOPMENT WORKING PAPER SERIES
average enrollment almost entirely accounts for the
large variation in per-pupil funding at the district level.
Turning to discretionary funds, it is striking that
Copperbelt and Lusaka receive more in per-pupil
terms via discretionary sources than the centralized
provinces, which depend on funding initially routed
through the provincial level. Thus in Northern and
Eastern province, discretionary sources account for
only 20 percent of total resources, whereas this in-
creases to 45 percent for the decentralized provinces.
Tracking results (province to district). The
tracking exercise of public funds from the province
to the district level takes into account the complexi-
ties of the funding arrangements discussed in the
previous section.24
It is assumed that total rule-based
cash received by districts is fresh money in the sys-
tem, since there is no movement of rule-based fund-
ing from the province to the district. Discretionary
funding at the district level in centralized provinces
(including both GRZ and Case IV sources) is routed
via the province; in decentralized provinces funding
is not routed via the provinces and constitutes new
resources in the system. From this the net total funds
passed on to the province and the district via the
Ministry of Education can be calculated. Table 11
gives the results.
On average, K 28,000 per pupil enters the sys-
tem for nonsalary spending from the center. Up
to one-third of total cash in the system is earmarked
for schools via the rule-based funding component,
and the remainder is spent at the discretion of the
provinces and districts. As table 11 shows, decen-
tralization seems to have decreased the spending
at the provincial level. Thus, spending at the pro-
vincial level is between K 5,000 per pupil (North-
ern) and K 16,800 per pupil (Eastern) in the cen-
tralized provinces (18 and 38 percent of total funds
in the system, respectively) and this decreases to K
1,500 per pupil for the decentralized provinces
(around 7 percent of total funds in the system). As a
result the proportion of money available at the level
of the district increases in the decentralized prov-
inces from 70 percent to more than 90 percent (95
percent in the case of Lusaka) of total funds in the
system.
This data seem to suggest that the system of de-
centralization improves the flow of funds by decreas-
ing provincial spending, but it leaves unanswered the
question of whether decentralized districts are
spending more at the district level, or passing on
greater amounts to the schools.
THE SCHOOL LEVEL
District disbursements and school receipts.
Schools are supposed to receive either $600 or $650
through the rule-based component. In addition, they
may also receive cash from infrastructure and other
spending grants, through GRZ spending or from Case
Table 10. Funding Sources at the District Level
(Kwacha per student)
GRZ funding: GRZ funding from Case IV
Case I – Case III pool domestic sources funding
Rule-based Discretionary Discretionary Discretionary
Average district component components components components
Province type in province (BESSIP) (HIPC Funds) (other GRZ) (Case IV funding) Total
Centralized Northern 9,576 1,278 4,656 1,547 24,196
(44) (6) (17) (7) (100)
Eastern 15,019 921 7,364 1,534 27,437
(63) (4) (21) (5) (100)
Decentralized Copperbelta
6,850 1,049 8,074 652 17,263
(43) (6) (43) (4) (100)
Lusakaa
4,057 263 9,751 731 20,690
(19) (1) (45) (3) (100)
Note: Percentages (in brackets) may not add up to 100 due to rounding.
a. Decentralized provinces.
Source: ESD data.
PUBLIC AND PRIVATE FUNDING OF BASIC EDUCATION IN ZAMBIA • 33
IV donors. Regardless of the original funding body, this
money is eventually disbursed through the district. In
isolatedcasesschoolsmayalsoreceivefundsfromother
sources (churches, local donors, nongovernmental or-
ganizations (NGOs), or directly from the Ministry of
Education). Since the data contains only one such ex-
ample, public funding to the school is considered as a
one-way flow from the district.
The results of the expenditure tracking at the
school level are presented in two parts. First, in
continuance of the previous tracking exercise the
per-pupil amounts available to each school in dif-
ferent districts provides an estimate of the per-
centage of funds that reaches schools. Since the
rule-based component of funding is a per-school
amount, we cannot ascertain leakage through this
exercise. The per-school amounts are thus post-
poned to the next subsection, where school fund-
ing is disaggregated in terms of rule-based versus
Table 11. Tracking of Resources, June 2001–June 2002
(Kwacha per pupil per year)
Rule-based + Rule- Rule-based +
discretionary based Discretionary Discretionary discretionary
(district) (district) (district) (province) (total)
Total
discretionary
Total Funds Funds Additional funds
funds received Funds received funds available
at the directly received directly from at the Spending: Total
district from from the from province provincial provincial funds in
Province type Province level ministry province ministry to district level level the system
(1) (2) (3) (4) (5) (6) (7) (8)
Centralized Northern 24,196 9,576 7,812 0 6,808 19,779 5,159 29,355
(82) (33) (27) (0) (23) (67) (18) (100)
Eastern 27,437 15,019 2,780 0 9,638 29,308 16,890 44,327
(62) (34) (6) (0) (22) (66) (38) (100)
Decentralized Copperbelta
17,263 6,850 0 8,074 2,339 4,133 1,793 19,056
(91) (36) (0) (42) (12) (22) (9) (100)
Lusakaa
20,690 4,057 916 9,751 5,966 8,034 1,152 21,842
(95) (19) (4) (45) (27) (37) (5) (100)
Note: Percentages of total funds in system are bracketed. All total funds in the system refer to nonsalary resources.
a. Decentralized provinces.
Sources: ESD survey data. Column (1) data from table 9. Column (2) data from table 10 total rule-based funding to districts.
Column (3) extrapolated to yearly spending from data on funding to districts, January 2002-June 2002. Column (4) from table
10, discretionary funds allocated directly to the district in the case of Lusaka and Copperbelt. Column (5): (5)=(1)-(2)-(3)-(4).
This correction assumes that funds are reported correctly at the district level and the province underreports transfers. (The
sums involved correspond closely to the sum of HIPC and PAGE resources received at the provincial level, which were
earmarked to be passed on to lower level, but which may not have been recorded as cash passed on to district.) Column (6)
data from table 8. Column (7): (7)=(6)-(5)-(3). Column (8): (8)=(1)+(7).
discretionary funding, which directly tackles the
issue of leakage.
To check for robustness, three options are used
to calculate the amounts passed on to schools. Op-
tion 1 in table 12 is direct measurement of the cash
passed on from the district to the schools in the
sample, with the associated problem that the data is
only for a sample of schools (those covered by the
survey for a six-month recall period). Option 2 is a
measure of spending patterns at the district level and
is based on a one-month recall of spending in May
2002. Option 3 uses data collected at the school level,
with a six-month recall period. The high correlation
observed between all three measures confirms the
reliability of the reported financial data. Although there
is some variation in the amounts depending on the
option used, option 3 always lies between options 1
and option 2. One strategy therefore is to use the
amount calculated from option 1 as the upper bound
34 • AFRICA REGION HUMAN DEVELOPMENT WORKING PAPER SERIES
of school receipts and amount calculated from op-
tion 2 as the lower bound.
The results of this per-pupil tracking exercise are
shown in table 12 (and summarized in figure 4). Col-
umns 1, 2, and 3 show the funds available in the en-
tire system at the province and district level (identical
to table 11). Column 4 shows the total amount passed
on to the schools using option 1 (district report).
Column 5 shows the spending on schools using shares
of spending in May (option 2), and column 6 shows
the funds reported by the school (option 3).
Option 1 (the upper bound) suggests that typi-
cally between 25 and 48 percent of total funding
(between K 5,000 and K 13,600 per pupil) in the
system is passed on to schools; option 2 (the
lower bound) suggests 11 to 33 percent (between
K 2,500 and K 8,000) is passed on. Typically less
than half the funding in the system reaches the
school level, and in Eastern and especially Lusaka
province the share seems even lower.
Gains from decentralization in terms of reduced
spending at the provincial level now disappear:
there is no evidence that increased funding to dis-
tricts in decentralized provinces is passed on to
schools. As a percentage of total funds in the sys-
tem, schools in centralized provinces receive
around 30 percent of total funds and this actu-
ally decreases to (approximately) 25 percent in
the case of decentralized provinces. Thus, in
terms of funding it appears that decentralization
has merely shifted spending from the province
to the district, with no improvement in disburse-
ments to schools.
SUMMARY
The tracking exercise established the following
characteristics of the education funding system in
Zambia.
• Discretionary funds at the level of the prov-
ince and district account for 70 percent of
all funding. On average, about K 28,000 per
pupil enters the educational system at the level
of the province. Approximately 30 percent of
this amount is earmarked for rule-based funds
Table 12. Tracking of Resources from the District Level to Schools, 2001–2002
(enrollment weighted by Kwacha per pupil)
Rule-based + Discretionary Rule-based + Rule-based + discretionary
discretionary (province) (district) (schools)
Total discretionary Funds Option 1: Option 2: Option 3:
Total funds at the reportedly spending on funds
funds available at district passed schools reported
in the the provincial education on to (based on by
Province type Province system level office level schools shares) schools
(1) (2) (3) (4) (5) (6)
Centralized Northern 29,355 19,779 24,196 13,618 7,985 9,179
(100) (67) (82) (46) (27) (31)
Eastern 44,327 29,308 27,437 15,528 7,408 11,925
(100) (66) (62) (35) (17) (27)
Decentralized Copperbelta
19,056 4,133 17,263 9,216 6,215 6,384
(100) (22) (91) (48) (33) (34)
Lusakaa
21,842 8,034 20,690 5,382 2,483 3,121
(100) (37) (95) (25) (11) (14)
Note: Percentages of total funds in brackets. Data excludes two schools in Kafue district, with substantial reported grants not
reflected in district data, and most likely outliers linked to measurement problems.
a. Decentralized provinces.
Source: ESD data. Columns (1), (2) and (3): taken from table 11. Column (4) reported by district, extrapolated from a recall
period January 2002-July 2002 and from data specifically related to the ESDS sample of schools explicitly asking how much
cash was allocated to each school in our sample (for recurrent and capital expenditures). Column (5) reported by district,
extrapolated from actual spending data for May 2002. Column (6) based on data collected at the schools level, recall period
January 2002–June 2002.
PUBLIC AND PRIVATE FUNDING OF BASIC EDUCATION IN ZAMBIA • 35
through the fixed-school grant of $600 ($650),
and 70 percent is in the form of funding allo-
cated at the discretion of provinces and districts.
• Between one-sixth and one-third of total
funding in the system eventually reaches
schools. Of this total amount, between 14 and
34 percent eventually reaches the schools as a
combination of rule-based and discretionary
spending, and the rest is spent at the provincial
and district levels.
• Decentralization has shifted spending from
the provincial to the district level, but has
not resulted in greater disbursements to
schools. There are important differences be-
tween centralized and decentralized provinces
up to the level of the district. Centralized prov-
inces spend more at the provincial level com-
pared to those that have been decentralized.
However, the extra funding that reaches the
districts in decentralized provinces results in
higher spending at the district level and is not
associated with greater funding to schools.
These findings are summarized in figure 4, where
K per pupil funding is plotted at each level of the
administrative hierarchy. The amount that finally
reaches the school is much less than the total
amount available in the system and this decline is
the sharpest in Eastern province. Moreover, a large
fraction of the difference in funds arises from the
nature of the rule-based component of funding.
Hence, disbursement curves in the decentralized dis-
tricts are consistently below those in the centralized
district as a direct consequence of the rule-based com-
ponent, in conjunction with the difference in average
school enrollment between the provinces discussed
previously.
Already the results of the tracking exercise pro-
vide suggestive evidence regarding the leakage of
funds. In particular, the correspondence between the
funding received by schools and the amount of the
fixed-school grant indicate that almost all rule-based
funds are passed on, while little of the available dis-
cretionary funding actually reach the schools. In the
next section we explicitly address this issue for both
the nonsalary funding discussed in this section, as
well as payroll funds that do not pass through the
administrative hierarchy.
NOTES
19. Recall that the payroll is centralized and payments
are made directly to teachers from the center. Thus there
is no notion of money being distributed from provinces
onward. Of course, the important question of whether
teachers receive their salaries remains, and is taken up in
section 5.
20. An alternative measure could rely on per-child
funds. This measure would have the attractive property
that differential dropout rates would not affect the over-
all funding statistic. Ideally we would like to report both,
Figure 4. Funding Disbursement in Centralized and Decentralized Provinces
Centralized Provinces
Funds at administrative level
Decentralized Provinces
0
Funds at administrative level
10000
20000
30000
40000
50000
Total Province District Schools
(LB)
Schools
(UB)
Funding(Kperpupil)
10000
20000
30000
40000
50000
Total Province District Schools
(LB)
Schools
(UB)
Funding(Kperpupil)
Lusaka Province
Copperbelt
Northern Province
Eastern Province
36 • AFRICA REGION HUMAN DEVELOPMENT WORKING PAPER SERIES
but there are two problems. The first is that the popu-
lation census is not currently available. The second and
more serious problem is that to report this statistic at
the school level one would have to define a catchment
area, which is often arbitrary, especially for urban
schools. Without a clearly defined catchment, it is un-
clear that this concept would be useful at the level of
the individual school.
21. The enrollment figures include all districts for
which data are available. In the calculation of the financial
figures per pupil, two districts were dropped because of
incomplete financial data, Nakonde in Northern Province
and Chongwe in Lusaka Province. Recall also that these
are all nonsalary transfers.
22. One option could be that this low amount is linked
to low cash receipts from January to June. According to
the timing of funds, most funding reaches provinces from
September to November and could thus have already
been disbursed by January.
23. Aspects of the tracking exercise to keep in mind
include two crucial points. First, the fixed grant is directly
passed on from the Ministry of Education to the districts
and thus enters the system only at the district level. Sec-
ond, in decentralized provinces discretionary resources
for recurrent expenditure flow directly to the districts,
without passing through the provinces.
24. The nature of the data available still implies the
need for some assumptions to interpret the results. For
example, recall periods for funds received are a full year,
but for resources passed on the only workable recall was
the preceding half-year. For spending at the province or
district level, a one-month recall period was used. The
pilot study revealed that these recall periods provide the
most accurate information.
Public and Private Funding Impacts Zambian Education

Mais conteúdo relacionado

Mais procurados (20)

Poverty in india by Narendra P. Makadiya
Poverty in india by Narendra P.  MakadiyaPoverty in india by Narendra P.  Makadiya
Poverty in india by Narendra P. Makadiya
 
Extended and expanded role of nurses
Extended and expanded role of nursesExtended and expanded role of nurses
Extended and expanded role of nurses
 
Privatisation in education
Privatisation in educationPrivatisation in education
Privatisation in education
 
Social institutions
Social institutionsSocial institutions
Social institutions
 
Dowry System
Dowry SystemDowry System
Dowry System
 
Case mthd
Case mthdCase mthd
Case mthd
 
Gender caste and class
Gender caste and classGender caste and class
Gender caste and class
 
Child labour ppt
Child labour pptChild labour ppt
Child labour ppt
 
Indian social problems | Dowry system | definition, causes, effect, preventio...
Indian social problems | Dowry system | definition, causes, effect, preventio...Indian social problems | Dowry system | definition, causes, effect, preventio...
Indian social problems | Dowry system | definition, causes, effect, preventio...
 
Sociology-Divorce
Sociology-DivorceSociology-Divorce
Sociology-Divorce
 
Illiteracy
IlliteracyIlliteracy
Illiteracy
 
Poverty
PovertyPoverty
Poverty
 
Difference between rural and urban society
Difference between rural and urban societyDifference between rural and urban society
Difference between rural and urban society
 
Open Distance Learning(ODL)
Open Distance Learning(ODL)Open Distance Learning(ODL)
Open Distance Learning(ODL)
 
IT@SCHOOL AND ITS FUNCTIONS
IT@SCHOOL AND ITS FUNCTIONSIT@SCHOOL AND ITS FUNCTIONS
IT@SCHOOL AND ITS FUNCTIONS
 
Poverty
PovertyPoverty
Poverty
 
Project on Privatization of Education
Project on Privatization of EducationProject on Privatization of Education
Project on Privatization of Education
 
3 how knowledge is constructed
3 how knowledge is constructed3 how knowledge is constructed
3 how knowledge is constructed
 
Education and social change
Education and social changeEducation and social change
Education and social change
 
Apscf 2011
Apscf 2011Apscf 2011
Apscf 2011
 

Semelhante a Public and Private Funding Impacts Zambian Education

Franklin (MA) Public Schools - Budget Hearing - 03/23/21
Franklin (MA) Public Schools - Budget Hearing - 03/23/21Franklin (MA) Public Schools - Budget Hearing - 03/23/21
Franklin (MA) Public Schools - Budget Hearing - 03/23/21Franklin Matters
 
Contemporary Issues in Education: School Funding
Contemporary Issues in Education: School Funding Contemporary Issues in Education: School Funding
Contemporary Issues in Education: School Funding Jazzrob7
 
PSF Budget Analysis 2021-23
PSF Budget Analysis 2021-23 PSF Budget Analysis 2021-23
PSF Budget Analysis 2021-23 Mebane Rash
 
Adldsp 732 virtual_schools_policy_brief_presentation
Adldsp 732 virtual_schools_policy_brief_presentationAdldsp 732 virtual_schools_policy_brief_presentation
Adldsp 732 virtual_schools_policy_brief_presentationrudyruiz
 
Decentralized education finance in china liu
Decentralized education finance in china  liuDecentralized education finance in china  liu
Decentralized education finance in china liuMunkh Orgil
 
North Carolina budget analysis from NC Justice Center
North Carolina budget analysis from NC Justice CenterNorth Carolina budget analysis from NC Justice Center
North Carolina budget analysis from NC Justice CenterEducationNC
 
Impact of unit cost on academic performance of public secondary education in ...
Impact of unit cost on academic performance of public secondary education in ...Impact of unit cost on academic performance of public secondary education in ...
Impact of unit cost on academic performance of public secondary education in ...Alexander Decker
 
FPS - FY 2021 Budget Hearing Presentation 20200414
FPS - FY 2021 Budget Hearing Presentation 20200414FPS - FY 2021 Budget Hearing Presentation 20200414
FPS - FY 2021 Budget Hearing Presentation 20200414Franklin Matters
 
Alternative sources of financing secondary school education in the rural coun...
Alternative sources of financing secondary school education in the rural coun...Alternative sources of financing secondary school education in the rural coun...
Alternative sources of financing secondary school education in the rural coun...Alexander Decker
 
Policy Brief-Universal Basic Education Finance in Nigeria.pdf
Policy Brief-Universal Basic Education Finance in Nigeria.pdfPolicy Brief-Universal Basic Education Finance in Nigeria.pdf
Policy Brief-Universal Basic Education Finance in Nigeria.pdfYouthHubAfrica
 
2018 psf local_schoolfinancestudy final pdf
2018 psf local_schoolfinancestudy final pdf2018 psf local_schoolfinancestudy final pdf
2018 psf local_schoolfinancestudy final pdfEducationNC
 
Educational Finance In Saskatchewan
Educational Finance In SaskatchewanEducational Finance In Saskatchewan
Educational Finance In SaskatchewanDarryl Hunter
 
How California Ranks
How California RanksHow California Ranks
How California RanksBrian Edwards
 
Renville County Rural Child Care Innovation Program Solution Action Plan
Renville County Rural Child Care Innovation Program Solution Action PlanRenville County Rural Child Care Innovation Program Solution Action Plan
Renville County Rural Child Care Innovation Program Solution Action PlanFawn McNamara
 
Student-Based School Funding for Idaho
Student-Based School Funding for IdahoStudent-Based School Funding for Idaho
Student-Based School Funding for IdahoKristen McCarver
 
Cooper Ed budget
Cooper Ed budgetCooper Ed budget
Cooper Ed budgetEducationNC
 

Semelhante a Public and Private Funding Impacts Zambian Education (20)

Franklin (MA) Public Schools - Budget Hearing - 03/23/21
Franklin (MA) Public Schools - Budget Hearing - 03/23/21Franklin (MA) Public Schools - Budget Hearing - 03/23/21
Franklin (MA) Public Schools - Budget Hearing - 03/23/21
 
Where Does the Education Dollar Go?
Where Does the Education Dollar Go?Where Does the Education Dollar Go?
Where Does the Education Dollar Go?
 
Contemporary Issues in Education: School Funding
Contemporary Issues in Education: School Funding Contemporary Issues in Education: School Funding
Contemporary Issues in Education: School Funding
 
PSF Budget Analysis 2021-23
PSF Budget Analysis 2021-23 PSF Budget Analysis 2021-23
PSF Budget Analysis 2021-23
 
Adldsp 732 virtual_schools_policy_brief_presentation
Adldsp 732 virtual_schools_policy_brief_presentationAdldsp 732 virtual_schools_policy_brief_presentation
Adldsp 732 virtual_schools_policy_brief_presentation
 
Decentralized education finance in china liu
Decentralized education finance in china  liuDecentralized education finance in china  liu
Decentralized education finance in china liu
 
North Carolina budget analysis from NC Justice Center
North Carolina budget analysis from NC Justice CenterNorth Carolina budget analysis from NC Justice Center
North Carolina budget analysis from NC Justice Center
 
Impact of unit cost on academic performance of public secondary education in ...
Impact of unit cost on academic performance of public secondary education in ...Impact of unit cost on academic performance of public secondary education in ...
Impact of unit cost on academic performance of public secondary education in ...
 
FPS - FY 2021 Budget Hearing Presentation 20200414
FPS - FY 2021 Budget Hearing Presentation 20200414FPS - FY 2021 Budget Hearing Presentation 20200414
FPS - FY 2021 Budget Hearing Presentation 20200414
 
UBE Financing
UBE Financing UBE Financing
UBE Financing
 
Alternative sources of financing secondary school education in the rural coun...
Alternative sources of financing secondary school education in the rural coun...Alternative sources of financing secondary school education in the rural coun...
Alternative sources of financing secondary school education in the rural coun...
 
Policy Brief-Universal Basic Education Finance in Nigeria.pdf
Policy Brief-Universal Basic Education Finance in Nigeria.pdfPolicy Brief-Universal Basic Education Finance in Nigeria.pdf
Policy Brief-Universal Basic Education Finance in Nigeria.pdf
 
2018 psf local_schoolfinancestudy final pdf
2018 psf local_schoolfinancestudy final pdf2018 psf local_schoolfinancestudy final pdf
2018 psf local_schoolfinancestudy final pdf
 
GEAR-UP Grant
GEAR-UP GrantGEAR-UP Grant
GEAR-UP Grant
 
Educational Finance In Saskatchewan
Educational Finance In SaskatchewanEducational Finance In Saskatchewan
Educational Finance In Saskatchewan
 
How California Ranks
How California RanksHow California Ranks
How California Ranks
 
Wp 182
Wp 182Wp 182
Wp 182
 
Renville County Rural Child Care Innovation Program Solution Action Plan
Renville County Rural Child Care Innovation Program Solution Action PlanRenville County Rural Child Care Innovation Program Solution Action Plan
Renville County Rural Child Care Innovation Program Solution Action Plan
 
Student-Based School Funding for Idaho
Student-Based School Funding for IdahoStudent-Based School Funding for Idaho
Student-Based School Funding for Idaho
 
Cooper Ed budget
Cooper Ed budgetCooper Ed budget
Cooper Ed budget
 

Mais de asafeiran

Mckinsey company - Capturing the next wave of growth in alternative Investments
Mckinsey company - Capturing the next wave of growth in alternative InvestmentsMckinsey company - Capturing the next wave of growth in alternative Investments
Mckinsey company - Capturing the next wave of growth in alternative Investmentsasafeiran
 
How the balanced scorecard complements the McKinsey 7-S model
How the balanced scorecard complements the McKinsey 7-S modelHow the balanced scorecard complements the McKinsey 7-S model
How the balanced scorecard complements the McKinsey 7-S modelasafeiran
 
Structure is not organization
Structure is not organizationStructure is not organization
Structure is not organizationasafeiran
 
The Africa Progress Report 2015
The Africa Progress Report 2015The Africa Progress Report 2015
The Africa Progress Report 2015asafeiran
 
Building Electricity Supplies in Africa
Building Electricity Supplies in AfricaBuilding Electricity Supplies in Africa
Building Electricity Supplies in Africaasafeiran
 
Baseline Renewable Energy - Africa Database
Baseline Renewable Energy - Africa DatabaseBaseline Renewable Energy - Africa Database
Baseline Renewable Energy - Africa Databaseasafeiran
 
Accenture the-dynamic-african-consumer-market-exploring-growth-opportunities-...
Accenture the-dynamic-african-consumer-market-exploring-growth-opportunities-...Accenture the-dynamic-african-consumer-market-exploring-growth-opportunities-...
Accenture the-dynamic-african-consumer-market-exploring-growth-opportunities-...asafeiran
 
Knight Frank - Africa Report 2013
Knight Frank - Africa Report 2013Knight Frank - Africa Report 2013
Knight Frank - Africa Report 2013asafeiran
 
Cost and Financing of Education in Mozambique
Cost and Financing of Education in MozambiqueCost and Financing of Education in Mozambique
Cost and Financing of Education in Mozambiqueasafeiran
 
Doing Business in Nigeria - Creating Wealth from Opportunities
Doing Business in Nigeria - Creating Wealth from OpportunitiesDoing Business in Nigeria - Creating Wealth from Opportunities
Doing Business in Nigeria - Creating Wealth from Opportunitiesasafeiran
 
Grain Fish Money Financing Africa’s Green and Blue Revolutions 2014
Grain Fish Money Financing Africa’s Green and Blue Revolutions 2014Grain Fish Money Financing Africa’s Green and Blue Revolutions 2014
Grain Fish Money Financing Africa’s Green and Blue Revolutions 2014asafeiran
 
Inclusive Green Growth in Zambia - Scoping the Needs and Potentials
Inclusive Green Growth in Zambia - Scoping the Needs and PotentialsInclusive Green Growth in Zambia - Scoping the Needs and Potentials
Inclusive Green Growth in Zambia - Scoping the Needs and Potentialsasafeiran
 
Innovative Approaches along the Private Equity Value Chain in Sub-Sahara Africa
Innovative Approaches along the Private Equity Value Chain in Sub-Sahara AfricaInnovative Approaches along the Private Equity Value Chain in Sub-Sahara Africa
Innovative Approaches along the Private Equity Value Chain in Sub-Sahara Africaasafeiran
 
Private Equity Investment in Africa - In Support of Inclusive and Green Growt...
Private Equity Investment in Africa - In Support of Inclusive and Green Growt...Private Equity Investment in Africa - In Support of Inclusive and Green Growt...
Private Equity Investment in Africa - In Support of Inclusive and Green Growt...asafeiran
 
Ernst & Young’s Africa Attractiveness Survey 2013
Ernst & Young’s Africa Attractiveness Survey 2013Ernst & Young’s Africa Attractiveness Survey 2013
Ernst & Young’s Africa Attractiveness Survey 2013asafeiran
 
Banking in sub-Saharan Africa - Challenges and Opportunities
Banking in sub-Saharan Africa - Challenges and OpportunitiesBanking in sub-Saharan Africa - Challenges and Opportunities
Banking in sub-Saharan Africa - Challenges and Opportunitiesasafeiran
 
How China is influencing Africa's Development
How China is influencing Africa's DevelopmentHow China is influencing Africa's Development
How China is influencing Africa's Developmentasafeiran
 
Global Risks 2014 - The World Economic Forum
Global Risks 2014 - The World Economic ForumGlobal Risks 2014 - The World Economic Forum
Global Risks 2014 - The World Economic Forumasafeiran
 
The roles and opportunities for the private sector in Africa’s agro food indu...
The roles and opportunities for the private sector in Africa’s agro food indu...The roles and opportunities for the private sector in Africa’s agro food indu...
The roles and opportunities for the private sector in Africa’s agro food indu...asafeiran
 
McKinsey on Africa - A Continent On The Move
McKinsey on Africa - A Continent On The MoveMcKinsey on Africa - A Continent On The Move
McKinsey on Africa - A Continent On The Moveasafeiran
 

Mais de asafeiran (20)

Mckinsey company - Capturing the next wave of growth in alternative Investments
Mckinsey company - Capturing the next wave of growth in alternative InvestmentsMckinsey company - Capturing the next wave of growth in alternative Investments
Mckinsey company - Capturing the next wave of growth in alternative Investments
 
How the balanced scorecard complements the McKinsey 7-S model
How the balanced scorecard complements the McKinsey 7-S modelHow the balanced scorecard complements the McKinsey 7-S model
How the balanced scorecard complements the McKinsey 7-S model
 
Structure is not organization
Structure is not organizationStructure is not organization
Structure is not organization
 
The Africa Progress Report 2015
The Africa Progress Report 2015The Africa Progress Report 2015
The Africa Progress Report 2015
 
Building Electricity Supplies in Africa
Building Electricity Supplies in AfricaBuilding Electricity Supplies in Africa
Building Electricity Supplies in Africa
 
Baseline Renewable Energy - Africa Database
Baseline Renewable Energy - Africa DatabaseBaseline Renewable Energy - Africa Database
Baseline Renewable Energy - Africa Database
 
Accenture the-dynamic-african-consumer-market-exploring-growth-opportunities-...
Accenture the-dynamic-african-consumer-market-exploring-growth-opportunities-...Accenture the-dynamic-african-consumer-market-exploring-growth-opportunities-...
Accenture the-dynamic-african-consumer-market-exploring-growth-opportunities-...
 
Knight Frank - Africa Report 2013
Knight Frank - Africa Report 2013Knight Frank - Africa Report 2013
Knight Frank - Africa Report 2013
 
Cost and Financing of Education in Mozambique
Cost and Financing of Education in MozambiqueCost and Financing of Education in Mozambique
Cost and Financing of Education in Mozambique
 
Doing Business in Nigeria - Creating Wealth from Opportunities
Doing Business in Nigeria - Creating Wealth from OpportunitiesDoing Business in Nigeria - Creating Wealth from Opportunities
Doing Business in Nigeria - Creating Wealth from Opportunities
 
Grain Fish Money Financing Africa’s Green and Blue Revolutions 2014
Grain Fish Money Financing Africa’s Green and Blue Revolutions 2014Grain Fish Money Financing Africa’s Green and Blue Revolutions 2014
Grain Fish Money Financing Africa’s Green and Blue Revolutions 2014
 
Inclusive Green Growth in Zambia - Scoping the Needs and Potentials
Inclusive Green Growth in Zambia - Scoping the Needs and PotentialsInclusive Green Growth in Zambia - Scoping the Needs and Potentials
Inclusive Green Growth in Zambia - Scoping the Needs and Potentials
 
Innovative Approaches along the Private Equity Value Chain in Sub-Sahara Africa
Innovative Approaches along the Private Equity Value Chain in Sub-Sahara AfricaInnovative Approaches along the Private Equity Value Chain in Sub-Sahara Africa
Innovative Approaches along the Private Equity Value Chain in Sub-Sahara Africa
 
Private Equity Investment in Africa - In Support of Inclusive and Green Growt...
Private Equity Investment in Africa - In Support of Inclusive and Green Growt...Private Equity Investment in Africa - In Support of Inclusive and Green Growt...
Private Equity Investment in Africa - In Support of Inclusive and Green Growt...
 
Ernst & Young’s Africa Attractiveness Survey 2013
Ernst & Young’s Africa Attractiveness Survey 2013Ernst & Young’s Africa Attractiveness Survey 2013
Ernst & Young’s Africa Attractiveness Survey 2013
 
Banking in sub-Saharan Africa - Challenges and Opportunities
Banking in sub-Saharan Africa - Challenges and OpportunitiesBanking in sub-Saharan Africa - Challenges and Opportunities
Banking in sub-Saharan Africa - Challenges and Opportunities
 
How China is influencing Africa's Development
How China is influencing Africa's DevelopmentHow China is influencing Africa's Development
How China is influencing Africa's Development
 
Global Risks 2014 - The World Economic Forum
Global Risks 2014 - The World Economic ForumGlobal Risks 2014 - The World Economic Forum
Global Risks 2014 - The World Economic Forum
 
The roles and opportunities for the private sector in Africa’s agro food indu...
The roles and opportunities for the private sector in Africa’s agro food indu...The roles and opportunities for the private sector in Africa’s agro food indu...
The roles and opportunities for the private sector in Africa’s agro food indu...
 
McKinsey on Africa - A Continent On The Move
McKinsey on Africa - A Continent On The MoveMcKinsey on Africa - A Continent On The Move
McKinsey on Africa - A Continent On The Move
 

Último

Church Building Grants To Assist With New Construction, Additions, And Restor...
Church Building Grants To Assist With New Construction, Additions, And Restor...Church Building Grants To Assist With New Construction, Additions, And Restor...
Church Building Grants To Assist With New Construction, Additions, And Restor...Americas Got Grants
 
8447779800, Low rate Call girls in Uttam Nagar Delhi NCR
8447779800, Low rate Call girls in Uttam Nagar Delhi NCR8447779800, Low rate Call girls in Uttam Nagar Delhi NCR
8447779800, Low rate Call girls in Uttam Nagar Delhi NCRashishs7044
 
8447779800, Low rate Call girls in Tughlakabad Delhi NCR
8447779800, Low rate Call girls in Tughlakabad Delhi NCR8447779800, Low rate Call girls in Tughlakabad Delhi NCR
8447779800, Low rate Call girls in Tughlakabad Delhi NCRashishs7044
 
Buy gmail accounts.pdf Buy Old Gmail Accounts
Buy gmail accounts.pdf Buy Old Gmail AccountsBuy gmail accounts.pdf Buy Old Gmail Accounts
Buy gmail accounts.pdf Buy Old Gmail AccountsBuy Verified Accounts
 
Darshan Hiranandani [News About Next CEO].pdf
Darshan Hiranandani [News About Next CEO].pdfDarshan Hiranandani [News About Next CEO].pdf
Darshan Hiranandani [News About Next CEO].pdfShashank Mehta
 
FULL ENJOY Call girls in Paharganj Delhi | 8377087607
FULL ENJOY Call girls in Paharganj Delhi | 8377087607FULL ENJOY Call girls in Paharganj Delhi | 8377087607
FULL ENJOY Call girls in Paharganj Delhi | 8377087607dollysharma2066
 
APRIL2024_UKRAINE_xml_0000000000000 .pdf
APRIL2024_UKRAINE_xml_0000000000000 .pdfAPRIL2024_UKRAINE_xml_0000000000000 .pdf
APRIL2024_UKRAINE_xml_0000000000000 .pdfRbc Rbcua
 
8447779800, Low rate Call girls in Dwarka mor Delhi NCR
8447779800, Low rate Call girls in Dwarka mor Delhi NCR8447779800, Low rate Call girls in Dwarka mor Delhi NCR
8447779800, Low rate Call girls in Dwarka mor Delhi NCRashishs7044
 
8447779800, Low rate Call girls in Saket Delhi NCR
8447779800, Low rate Call girls in Saket Delhi NCR8447779800, Low rate Call girls in Saket Delhi NCR
8447779800, Low rate Call girls in Saket Delhi NCRashishs7044
 
Financial-Statement-Analysis-of-Coca-cola-Company.pptx
Financial-Statement-Analysis-of-Coca-cola-Company.pptxFinancial-Statement-Analysis-of-Coca-cola-Company.pptx
Financial-Statement-Analysis-of-Coca-cola-Company.pptxsaniyaimamuddin
 
1911 Gold Corporate Presentation Apr 2024.pdf
1911 Gold Corporate Presentation Apr 2024.pdf1911 Gold Corporate Presentation Apr 2024.pdf
1911 Gold Corporate Presentation Apr 2024.pdfShaun Heinrichs
 
MAHA Global and IPR: Do Actions Speak Louder Than Words?
MAHA Global and IPR: Do Actions Speak Louder Than Words?MAHA Global and IPR: Do Actions Speak Louder Than Words?
MAHA Global and IPR: Do Actions Speak Louder Than Words?Olivia Kresic
 
Pitch Deck Teardown: Geodesic.Life's $500k Pre-seed deck
Pitch Deck Teardown: Geodesic.Life's $500k Pre-seed deckPitch Deck Teardown: Geodesic.Life's $500k Pre-seed deck
Pitch Deck Teardown: Geodesic.Life's $500k Pre-seed deckHajeJanKamps
 
Guide Complete Set of Residential Architectural Drawings PDF
Guide Complete Set of Residential Architectural Drawings PDFGuide Complete Set of Residential Architectural Drawings PDF
Guide Complete Set of Residential Architectural Drawings PDFChandresh Chudasama
 
8447779800, Low rate Call girls in New Ashok Nagar Delhi NCR
8447779800, Low rate Call girls in New Ashok Nagar Delhi NCR8447779800, Low rate Call girls in New Ashok Nagar Delhi NCR
8447779800, Low rate Call girls in New Ashok Nagar Delhi NCRashishs7044
 
Call Girls Contact Number Andheri 9920874524
Call Girls Contact Number Andheri 9920874524Call Girls Contact Number Andheri 9920874524
Call Girls Contact Number Andheri 9920874524najka9823
 
Organizational Structure Running A Successful Business
Organizational Structure Running A Successful BusinessOrganizational Structure Running A Successful Business
Organizational Structure Running A Successful BusinessSeta Wicaksana
 
Call Us 📲8800102216📞 Call Girls In DLF City Gurgaon
Call Us 📲8800102216📞 Call Girls In DLF City GurgaonCall Us 📲8800102216📞 Call Girls In DLF City Gurgaon
Call Us 📲8800102216📞 Call Girls In DLF City Gurgaoncallgirls2057
 

Último (20)

Church Building Grants To Assist With New Construction, Additions, And Restor...
Church Building Grants To Assist With New Construction, Additions, And Restor...Church Building Grants To Assist With New Construction, Additions, And Restor...
Church Building Grants To Assist With New Construction, Additions, And Restor...
 
8447779800, Low rate Call girls in Uttam Nagar Delhi NCR
8447779800, Low rate Call girls in Uttam Nagar Delhi NCR8447779800, Low rate Call girls in Uttam Nagar Delhi NCR
8447779800, Low rate Call girls in Uttam Nagar Delhi NCR
 
8447779800, Low rate Call girls in Tughlakabad Delhi NCR
8447779800, Low rate Call girls in Tughlakabad Delhi NCR8447779800, Low rate Call girls in Tughlakabad Delhi NCR
8447779800, Low rate Call girls in Tughlakabad Delhi NCR
 
Buy gmail accounts.pdf Buy Old Gmail Accounts
Buy gmail accounts.pdf Buy Old Gmail AccountsBuy gmail accounts.pdf Buy Old Gmail Accounts
Buy gmail accounts.pdf Buy Old Gmail Accounts
 
Enjoy ➥8448380779▻ Call Girls In Sector 18 Noida Escorts Delhi NCR
Enjoy ➥8448380779▻ Call Girls In Sector 18 Noida Escorts Delhi NCREnjoy ➥8448380779▻ Call Girls In Sector 18 Noida Escorts Delhi NCR
Enjoy ➥8448380779▻ Call Girls In Sector 18 Noida Escorts Delhi NCR
 
Darshan Hiranandani [News About Next CEO].pdf
Darshan Hiranandani [News About Next CEO].pdfDarshan Hiranandani [News About Next CEO].pdf
Darshan Hiranandani [News About Next CEO].pdf
 
FULL ENJOY Call girls in Paharganj Delhi | 8377087607
FULL ENJOY Call girls in Paharganj Delhi | 8377087607FULL ENJOY Call girls in Paharganj Delhi | 8377087607
FULL ENJOY Call girls in Paharganj Delhi | 8377087607
 
APRIL2024_UKRAINE_xml_0000000000000 .pdf
APRIL2024_UKRAINE_xml_0000000000000 .pdfAPRIL2024_UKRAINE_xml_0000000000000 .pdf
APRIL2024_UKRAINE_xml_0000000000000 .pdf
 
8447779800, Low rate Call girls in Dwarka mor Delhi NCR
8447779800, Low rate Call girls in Dwarka mor Delhi NCR8447779800, Low rate Call girls in Dwarka mor Delhi NCR
8447779800, Low rate Call girls in Dwarka mor Delhi NCR
 
8447779800, Low rate Call girls in Saket Delhi NCR
8447779800, Low rate Call girls in Saket Delhi NCR8447779800, Low rate Call girls in Saket Delhi NCR
8447779800, Low rate Call girls in Saket Delhi NCR
 
Financial-Statement-Analysis-of-Coca-cola-Company.pptx
Financial-Statement-Analysis-of-Coca-cola-Company.pptxFinancial-Statement-Analysis-of-Coca-cola-Company.pptx
Financial-Statement-Analysis-of-Coca-cola-Company.pptx
 
1911 Gold Corporate Presentation Apr 2024.pdf
1911 Gold Corporate Presentation Apr 2024.pdf1911 Gold Corporate Presentation Apr 2024.pdf
1911 Gold Corporate Presentation Apr 2024.pdf
 
MAHA Global and IPR: Do Actions Speak Louder Than Words?
MAHA Global and IPR: Do Actions Speak Louder Than Words?MAHA Global and IPR: Do Actions Speak Louder Than Words?
MAHA Global and IPR: Do Actions Speak Louder Than Words?
 
Call Us ➥9319373153▻Call Girls In North Goa
Call Us ➥9319373153▻Call Girls In North GoaCall Us ➥9319373153▻Call Girls In North Goa
Call Us ➥9319373153▻Call Girls In North Goa
 
Pitch Deck Teardown: Geodesic.Life's $500k Pre-seed deck
Pitch Deck Teardown: Geodesic.Life's $500k Pre-seed deckPitch Deck Teardown: Geodesic.Life's $500k Pre-seed deck
Pitch Deck Teardown: Geodesic.Life's $500k Pre-seed deck
 
Guide Complete Set of Residential Architectural Drawings PDF
Guide Complete Set of Residential Architectural Drawings PDFGuide Complete Set of Residential Architectural Drawings PDF
Guide Complete Set of Residential Architectural Drawings PDF
 
8447779800, Low rate Call girls in New Ashok Nagar Delhi NCR
8447779800, Low rate Call girls in New Ashok Nagar Delhi NCR8447779800, Low rate Call girls in New Ashok Nagar Delhi NCR
8447779800, Low rate Call girls in New Ashok Nagar Delhi NCR
 
Call Girls Contact Number Andheri 9920874524
Call Girls Contact Number Andheri 9920874524Call Girls Contact Number Andheri 9920874524
Call Girls Contact Number Andheri 9920874524
 
Organizational Structure Running A Successful Business
Organizational Structure Running A Successful BusinessOrganizational Structure Running A Successful Business
Organizational Structure Running A Successful Business
 
Call Us 📲8800102216📞 Call Girls In DLF City Gurgaon
Call Us 📲8800102216📞 Call Girls In DLF City GurgaonCall Us 📲8800102216📞 Call Girls In DLF City Gurgaon
Call Us 📲8800102216📞 Call Girls In DLF City Gurgaon
 

Public and Private Funding Impacts Zambian Education

  • 1. Public and Private Funding of Basic Education in Zambia Implications of Budgetary Allocations for Service Delivery Jishnu Das, The World Bank Stefan Dercon, Oxford University James Habyarimana, Harvard University Pramila Krishnan, Cambridge University Africa Region Human Development Working Paper Series The World Bank
  • 2. Copyright © 2004 Human Development Sector Africa Region The World Bank ii The views expressed herein are those of the authors and do not necessarily reflect the opinions or policies of the World Bank or any of its affiliated organizations. Cover Design by Word Express Interior Design by Jennifer Vito Cover photo: Drawing by Josephine Ngoma, Student, Namanongu School, Chongwe District.
  • 3. Contents iii Foreword ......................................................................................................................................................v Abstract ...................................................................................................................................................... vii Acknowledgments ..................................................................................................................................... viii Abbreviations and Acronyms ...................................................................................................................... ix Executive Summary ......................................................................................................................................x 1. Introduction ........................................................................................................................................... 17 2. Zambian Education during the 1990s ................................................................................................... 19 3. Tracking Methodology ........................................................................................................................... 22 4. School Characteristics of the Sample .................................................................................................... 26 5. Expenditure Tracking at Provincial, District, and School Levels ........................................................... 29 6. Leakage of Nonsalary and Payroll Funds............................................................................................... 37 7. Equity in Education Funding .................................................................................................................. 43 8. Private Expenditures for Education ...................................................................................................... 51 9. Discussion and Conclusions .................................................................................................................. 59 Bibliography ............................................................................................................................................... 60 Appendix.................................................................................................................................................... 62 Tables Table 1. Enrollment Rates, 1992–2001 Table 2. Structure of Resource and Funding Flows in Zambia Table 3. Enrollment, Urbanization, and Poverty Table 4. Mean Math and English Scores, by Province Table 5a. School Enrollment and Staffing Table 5b. Infrastructure Table 5c. Key Performance Indicators Table 5d. Household Indicators Table 6. Cash Received by Province Education Offices Table 7. Funding Sources at Province Education Office Level, June 2001–June 2002 Table 8. Funding Disbursed to Districts, January 2002–June 2002 Table 9. Cash Received by Districts Table 10. Funding Sources at the District Level Table 11. Tracking of Resources, June 2001–June 2002 Table 12. Tracking of Resources from the District Level to Schools, 2001–2002
  • 4. iv Table 13a. Disbursement of Fixed-Grant Allocations, by Province Table 13b. Disbursement of Salaries, by Province Table 13c. Disbursements of Rule-Based Allowances, by Province Table 14. Percentage of Schools That Receive No Funds, by Source and Location Table 15. Average Amounts Conditional on Receipts, by Province Table 16. Discretionary Transfers to Teachers, by Province Table 17. School and District Characteristics, by Province Table 18. Enrollment, Urbanization, Wealth, and Distance Table 19a. Equity in Rule-Based Funding at the District Level Table 19b. Equity in Rule-Based Funding at the School Level Table 20a. Equity in Discretionary Funding at the District Level Table 20b. Equity in Discretionary Funding at the School Level Table 20c. Equity in Discretionary Funding at the School Level, by Location Table 21a. Equity in Per-Pupil Staff Remuneration at the School Level Table 21b. Equity in Per-Pupil Staff Remuneration, Class Size and Salaries Table 22. Decomposing the Decline in Fees Table 23. Public and Private Sources of Funding Table 24. Equity in Public and Private Funding at the School Level Table 25. Fee and Nonfee Expenditures, by Province Table 26. Equity in Public and Private Spending Table 27. Substitutability between Public and Private Spending Table 28. Household Expenditure and Public Funding Table A1. Variables Used in Construction of the Asset Index Figures Figure 1. Funding Flows across Centralized and Decentralized Provinces Figure 2. Characteristics of School Enrollment in Zambia Figure 3. Funding Flows across Centralized and Decentralized Provinces Figure 4. Funding Disbursement in Centralized and Decentralized Provinces Figure 5. Variation in District Receipts Figure 6. Inequalities in Public Funding in Zambian Basic Education Figure 7. Declining Fees since 2000 Figure 8. Fee Decline by Province and Location Figure 9. The Relationship between PTA Fees and Wealth, 2000–2002 Figure 10. Household Spending on Education by Wealth Terciles Figure 11. Lorenz Curves of Inequalities in Public and Private Funding Figure A1. Asset Index Characteristics for All-Sample Figure A2. Asset Index Characteristics for Rural Sample Figure A3. Distribution of Wealth in All-Sample and Separated by Location Figure A4. Comparison of All-Sample and Rural Index
  • 5. Foreword v E ducation is at the center of many poverty re- duction strategies. Yet too often, education services fail to improve outcomes for a vari- ety of reasons. Budgetary allocations often favor the better-off, limiting poor people’s access to services or preventing improvements in quality. In many poor countries improvements in educational outcomes call for institutional—not merely managerial—reforms. Such reforms include bottom-up measures to give users a stronger voice and more power over pro- viders. They also include top-down measures to ensure better monitoring of providers and introduce effective incentives for improving staff performance. Both types of reform depend on a body of system- atic information on performance, incentives, and other aspects of frontline service delivery. This in- formation is indispensable for catalyzing and guiding the institutional reforms needed to improve educa- tion and educational outcomes—yet little of these essential data are currently available. To help fill this gap, the Development Research Group of the World Bank is carrying out, in collabo- ration with local institutions and Bank operations, a multicountry study of education service delivery in Laos, Pakistan, Papua New Guinea, Uganda, as well as Zambia, the subject of this paper. The purpose of the research is to understand the relationship be- tween funding and educational outcomes by track- ing funding and resources and relating them at dif- ferent levels of the delivery system to outcomes in different institutional and organizational contexts. The education research program pilots the Quan- titative Service Delivery Survey (QSDS), in which the school is the primary unit of observation. Beyond its use in analyzing provision of services, the QSDS fits well into the larger goal of impact evaluation. When combined with household surveys, it allows explo- ration of interactions between frontline providers and users of services. By adding surveys of local poli- ticians and officials, it can also shed light on the po- litical economy of service delivery and on interac- tions between providers and policymakers. The Education Service Delivery Study (ESD) in Zambia carefully examines the structure of funding and service delivery to better understand the rela- tionship between educational inputs and outcomes. It specifically takes into account linkages that may arise among different players involved in the deliv- ery of education (for instance, the province educa- tion office, the district education office, schools, par- ent teachers associations, and pupils) and seeks to examine the ways through which these players re- spond to changes in the institutional setting and fund- ing structure. The ESD addresses these important issues through the careful measurement of school inputs both at the school and the household level, as well as educational outcomes, through tests admin- istered to the same pupils at two different times (in collaboration with the Examination Council of Zam- bia). The Government of the Republic of Zambia (GRZ) has long recognized the importance of education. Nevertheless, a sharp decline from the mid-1980s onward in copper prices has led to a commensurate decline in GNI per capita, from $590 in 1975 to $300 in 2000, and this has presented several obstacles for
  • 6. vi the education sector. The government, along with a consortium of donors, has been working closely to improve educational outcomes. The Education Ser- vice Delivery Study addresses important issues re- garding the link between this effort and educational outcomes. This report provides a detailed evaluation of pub- lic expenditure. It includes both a public expendi- ture tracking and a funding-equity exercise. The tracking exercise provides information on the ex- tent to which educational expenditures earmarked under the central budget actually reach schools, and the funding-equity exercise examines whether such funding can be regarded as progressive—to what extent, if any, do poorer schools receive a greater share of public funding than their richer counterparts, and if so, how does this funding impact inequality in educational expenditure? The evaluation provides a complete picture of funding to primary and basic schools based on allocated and discretionary bud- getary components, and household contributions to education expenses. This report makes three contributions to the understanding of education funding in the Zambian context. First, it shows that funding characteristics are closely linked to the type of disbursement. Funds allocated according to a clear, predefined rule reach schools with little evidence of diversion. A signifi- cant proportion of funds allocated at the discretion of district and provincial educational offices, how- ever, are retained at higher levels of the hierarchy. Second, rule-based allocations have led to greater per-pupil funding for poorer and more rural schools. These allocations, however, are the only progressive disbursements in the survey. The disbursement of discretionary allocations is neutral with respect to wealth, and per-pupil staff allocations are higher in urban and richer schools. Once all sources of public funding are factored into the analysis, public school funding in Zambia is regressive, with almost 30 per- cent higher allocations to richer schools. Third, private expenditures at the level of the household have a critical impact on equity in educa- tional funding. In fact, the inequality in public expen- diture is dominated by the large share of private expenditures in overall educational spending. More- over, these expenditures adjust to school funding, decreasing when funding rises. The magnitude of these adjustments appear to be the same across rich and poor households, suggesting that higher public funding may be useful in decreasing inequality across, but not within, communities. The findings are highly relevant for educational reforms being undertaken in many developing coun- tries to improve educational outcomes. My hope is that by offering a new perspective from the front lines of education, this paper will make a useful con- tribution to the reform agenda for improving educa- tion services for poor people in Zambia and else- where. Birger J. Fredriksen Senior Education Advisor Human Development Department Africa Region
  • 7. Abstract T his report presents findings from a survey of 182 primary (grades 1-7) and basic (grades 1-9) schools carried out in Zambia in 2002. It describes and analyzes resource flows to these schools from three sources: rule-based funding from the center, discretionary funding from district and provincial education offices, and household spend- ing on education. Rule-based funds reached schools exactly as ear- marked. The rule-based component of funding was highly progressive, as the same amount was dis- bursed to all schools irrespective of enrollment. Since small schools tend to have poorer student bodies, the rule-based allocation per pupil translated to more funding for poorer students. Discretionary funds, controlled by the province and district education offices, reached only 25 per- cent of schools. The discretionary funds were wealth neutral. Even shares were distributed to schools with poor and nonpoor students. Household educational expenditures show that nonfee expenditures by the family are seven times the corresponding expenditure on fees, making them the main source of inequalities in private ex- penditure. Once private expenditure is factored into the analysis, the nonprogressive nature of the public education funding system worsens: the share of educational expenditures for the poorest 50 per- cent of the population declines from 40 to 34 per- cent. Furthermore, when examining substitution between private expenditures and public funding, there is strong evidence that households decrease expenditures when public funding increases. Although public funding could address inequali- ties in educational spending with progressive allo- cation across villages and schools, the desired im- pact of such redistributions may be less than imag- ined due to the crowding-out of private expendi- tures. The report suggests that increases in fund- ing may not be the optimal way to improve educa- tional attainment. It might be more beneficial to concentrate instead on providing inputs that house- holds cannot supply on their own, such as high- quality teachers. vii
  • 8. Acknowledgments T his study would not have been possible without the support and guidance of a number of institutions and individuals. We would especially like to thank Hinh Dinh and Bruce N. Jones for their keen interest and suggestions at every stage of the project, Ritva Reinikka for her continued support and encouragement, and Keith Wood and Richard Arden at DFID for funding the survey. The study relied on critical support from our Zambian counterparts, particularly Clement Siamatowe at the World Bank; RuralNet Associates and Professor Mwanawina at the University of Zam- bia for their excellent support and survey work in the field; Joe Kanyika, Teza Nakazwe, C. T. Sakala, and Arnold Chengo at the Examination Council of Zam- bia and Ministry of Education; the Permanent Secre- tary of the Ministry of Education, Barbara Y. Chilangwa; and J. Chiwele from the Accountant General’s office. Finally, Mushiba Nyamazana has been an integral part of this study from its inception; he helped design the surveys used in the study and provided invaluable in- sight into the educational system. viii
  • 9. Abbreviations and Acronyms BESSIP Basic Education Sub-Sector Investment Program DEO District Education Office (Officer) ESD Education Service Delivery ESDS Education Service Delivery Survey GDP Gross Domestic Product GNI Gross National Investment GRZ Government of the Republic of Zambia HIPC Debt Initiative for Heavily Indebted Poor Countries (World Bank) IRT Item Response Theory LCMS Living Conditions Monitoring Survey NGO Nongovernmental organization PAGE Program for the Advancement of Girls’ Education PEO Province Education Office (Officer) PTA Parent Teachers Association QSDS Quantitative Service Delivery Survey ix
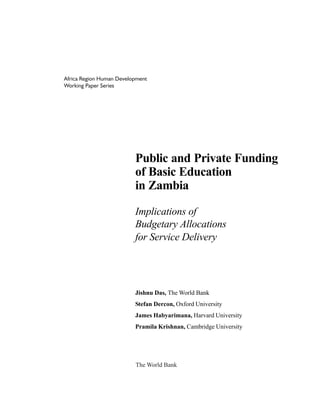
  • 10. Executive Summary T he link between education and develop- ment provides a strong case for allocating public expenditures to the education sector. However, allocating more central budgetary re- sources to the education sector will not necessarily deliver better outcomes. Budgetary resources may not reach the intended beneficiaries, and even if they do, these resources may not lead to the desired outcomes. This report examines the structure of funding and service delivery in Zambia using a re- cently completed Educational Service Delivery Sur- vey (ESDS). The Government of the Republic of Zambia (GRZ) has long recognized the importance of edu- cation. Nevertheless, a sharp decline from the mid- 1980s onward in copper prices has led to a com- mensurate decline in GNI per capita from $590 in 1975 to $300 in 2000, and this has presented sev- eral obstacles for the education sector. The govern- ment and a consortium of donors have been work- ing together to improve educational outcomes in Zambia. The survey and study ask two questions: What is the current record of the education sector in delivering services to the intended recipients? Have the changes undertaken by the Ministry of Educa- tion had the desired consequences in terms of edu- cational outcomes? The report focuses on a detailed evaluation of public expenditure—through both a tracking and a funding-equity exercise—to gauge the extent to which educational expenditures earmarked under the central budget actually reach schools, as well as the extent to which such funding can be regarded as progressive. Of the four issues that concern us dur- ing this exercise, the first three relate to the public funding of education and the last examines private educational funding and its relationship to public ex- penditure. These issues are as follows: • What percentage of resources is spent at each level of the administrative hierarchy? • To what extent is variation in funding across districts and schools explained by funding for- mulas that relate budgetary allocation to dis- trict and school characteristics such as enroll- ment or the number of schools? • To the extent that there is variation in funding across districts and schools, what is the rela- tionship between this variation and character- istics of districts and schools? (For instance,do richer districts and schools systematically re- ceive more funds?) • How important is private funding in the provi- sion of education and how does this compo- nent of funding relate to equity in the overall funding of education? In Zambia public funding for education flows to schools through a three-tiered administrative hierar- chy involving the province offices, the district offices, and schools. Moreover, funds do not necessarily flow in a top-down manner; at each tier of the hierarchy, funds may come directly from the government or x
  • 11. from international and national donors. In our analy- sis, we classify these funds into four categories: • Rule-based allocations to schools. A fixed- grant of $600 or $650 is allocated to each school, depending on the type of school. The grant is not a per-pupil allocation and it is inde- pendent of the enrollment in the school. • Discretionary allocations to schools. Such funds are allocated at the discretion of districts and provinces and are over and above the rule- based allocation. • Rule-based allocations to teachers. Teachers are paid directly via deposit slips through a cen- tralized payroll in Zambia. This money does not pass through the province or district offices. • Discretionary allocations to teachers. In ad- dition to salaries and monthly allowances, teachers are entitled to one-time benefits, such as leave benefits, transfer benefits (paid when a teacher switches schools), and funeral benefits. The payment of such benefits is left to the discretion of the provincial and district- level administration. It is also necessary to distinguish between prov- inces with and without district education boards. Al- though districts receive money directly from the GRZ, both for rule-based and discretionary allocations, all money for discretionary allocations is first transferred to the concerned province, and from there moves on- ward to the district. For this reason, provinces with district education boards are referred to as decentral- ized provinces and those without district education boards are referred to as centralized provinces. In the study sample there are two of each: Lusaka and Copperbelt provinces are decentralized and Northern and Eastern province are centralized. Figure 1 shows howfundsareallocatedacrossbothtypesofprovinces. EXPENDITURE TRACKING The tracking exercise follows all nonsalary funding flows through the administrative hierarchy (recall that xi Figure 1. Funding Flows across Centralized and Decentralized Provinces Note: Decentralized provinces are Lusaka and Copperbelt. Centralized provinces are Northern and Eastern. Ministry of Education (Centralized) (Decentralized) District (Centralized) District (Decentralized) SchoolsHouseholds Discretionary flows Rule-based flows Case IV donors (primarily the Program for Advancement of Girl’s Education Ministry of Education (Centralized) (Decentralized) District (Centralized) District (Decentralized) SchoolsHouseholds Discretionary flows Rule-based flows Case IV donors (primarily the Program for Advancement of Girl’s Education Province Province
  • 12. Leakage = This report, however, goes beyond an estimate of leakage based on allocated funds to provide a com- plete picture of the funding of educational institu- tions. It examines all sources of funding for the school. For example, in the case of discretionary compo- nents the rule-based methodology fails (since there is no rule about the amounts that schools are sup- posed to receive, it is not possible to determine what constitutes leakage in the system). After tracking the amounts that schools receive, it’s possible to exam- ine the equity implications of such allocations. The section on leakage establishes the following: • Rule-based allocations to schools in the Zambian educational system seem to work efficiently. There is little evidence to suggest that funds earmarked for disburse- ments do not reach intended beneficiaries. Specifically, more than 90 percent of all schools (95 percent in all provinces except Lusaka) had received the rule-based allocation at the time of the survey, and delays in disburse- ment rather than leakage of funds was a more likely explanation in the case of schools that had not received the grant (this grant was disbursed two months prior to the survey). • Rule-based allocations to teachers—sala- ries and clearly defined allowances—are disbursed efficiently. There is some evidence of delays in the updating of the payroll sys- tem, as well as significant arrears in the case of allowances that are not clearly specified. In the case of salaries, 95 percent of teachers had no outstanding amounts. For allowances where there is a clear specification based on location (hardship allowance in rural locations) or status (teacher trainee allowance), less than 15 percent of payments were overdue by six months or more. However, in the case of over- time allowances (which must be filed every term), and allowances that resulted from a change in the status of the teacher (such as added tasks with commensurate allowances), 50 percent of payments were overdue. For all allowances there is considerable evidence that payroll goes from the center directly to teachers). The expenditure flows can be characterized as follows: • On average, K 28,000 per pupil enters the edu- cational system for the four provinces surveyed. This amount hides a significant degree of varia- tion among provinces with, for instance, East- ern Province (K 44,300) receiving more than double the per-pupil funding received by Copperbelt (K 19,000). • Of this amount, discretionary funds at the level of the province and district account for 70 per- cent of all funding and rule-based funds accounts for the remaining 30 percent. Thus rule-based funds allocated through the fixed-school grant of $600 ($650) account for less than one-third of all the funding received.1 • Between one-sixth and one-third of total fund- ing in the system eventually reaches the schools. Again, there are significant differences between provinces, with 34 percent of provincial-level funds reaching schools in Copperbelt, and only 14 percent reaching schools in Lusaka. • Although decentralization has shifted spending from the provincial to the district level, it has not resulted in greater disbursements to schools. The differences between centralized and decentralized provinces up to the level of the district are as follows: centralized provinces spend more than decentralized provinces at the provincial level. Thus, in Eastern (38 percent) and Northern (18 percent) province a far higher percentage of funding is spent at the provincial level compared to Copperbelt (9 percent) and Lusaka (5 percent). However, extra funding that reaches the districts in decentralized provinces results in higher spending only at the district level and is not associated with greater funding to schools. LEAKAGE Following the methodology used in Uganda (Ablo and Reinikka 2000), the definition of leakage in the Zambian educational system is the ratio of what schools actually receive to what they were supposed to receive. The equivalent of per-pupil funding in Uganda is the fixed-school grant in Zambia. Thus leak- age for rule-based allocations is defined as follows: xii amount received by school $600 ($650 for basic schools)
  • 13. lags in updating the payroll regularly result in delays of one to three months in payment. • For discretionary allocations to schools, the positive results obtained earlier no longer hold: less than 25 percent of schools receive any funding from discre- tionary sources. The crucial importance of rule-based funding at the level of the school is also highlighted by the change in the relative share by source as we move down the admin- istrative hierarchy. At the level of the province, the share of rule-based allocations in total fund- ing ranges from 8 to 40 percent, with a median of 12 percent. Moving down to the districts, this share increases to between 19 and 63 per- cent, with a median of 44 percent. Finally, at the level of the school this share ranges from 2 to 100 percent, with a median of 99 percent. More than 75 percent of all schools received cash resources only from rule-based sources in the current year. • For discretionary allocations to teachers there are substantial amounts overdue for one-time benefits and payments. In some provinces the overdue payments amount to three times the monthly salary of the teacher. • Discretionary funding disbursed to schools tend to be one of two types. Small sums are disbursed under the UNICEF-administered Program for the Advancement of Girls’ Educa- tion (PAGE) or larger sums are received from district offices. The high variation in the amounts received is significant. Conditional on a school receiving such funding, it could account for as much as 60 times what it would get under the fixed-allocation grant. This suggests two potential explanations for the pat- terns of discretionary funding and school expenditure: • Schools are provided discretionary funds for large expenditures on a rotating basis. For in- stance, if a school were rehabilitated every 10 years only 10 percent of schools in any given year would receive money for capital expenditures. In addition, the amounts of such expenditures received would be large compared to amounts received for recurrent spending. According to this hypothesis, the pattern of funding and expenditure observed is a reflection of the lumpy nature of big invest- ments. • Since rule-based funding is clearly defined and transparent, it is extremely difficult for any politi- cal economy considerations (such as capture of funds by elites) to impact school allotments. Dis- cretionary funding is not associated with any such rule. So the pattern of funding observed is a re- flection of the difference between rules and dis- cretion. The few schools that receive large amountsarespecialschoolsthathavegreaterbar- gainingpowerwithintheadministrativestructure. The section on equity turns to exactly this con- cern and relies on the following observation: if the first explanation is correct it is unlikely that the flow of discretionary funds to schools will be correlated with wealth. If schools are provided with capital expenditure funds on a rotating basis, it seems natu- ral to assume that the sample of schools receiving such funding will be a mix of schools in rich and poor areas.2 Consequently, systematic differences in funding by wealth levels would lead to an expla- nation based on the difference between rules and discretion, rather than one based on a distinction between one-time and recurrent expenditures. EQUITY The examination of funding equity in the education system follows rule-based and discretionary allocations separately, and focuses on the relationship between the type of funding and following related variables: • Urbanization. Do urban schools and urban- ized districts receive more than their rural coun- terparts? • Wealth. Do richer schools and districts receive more than their poorer counterparts? • Distance to administrative offices. Do schools that are closer to administrative offices receive more than those farther away? The main findings are summarized below. • Equity of rule-based funds. Rule-based funds are progressive, with greater per-pupil amounts xiii
  • 14. allocated to less urban and poorer schools and districts. This result is entirely due to the inverse relationship between school size and wealth and urbanization. Thus, schools in rural areas tend to be smaller and poorer whereas schools in urban areas tend to be larger and richer. Since rule-based funds are allocated per school rather than per student, poorer and more rural schools receive greater funding per pupil. The same logic applies at the district level, where those with smaller average enrollments will receive higher funding.3 Thus, poorer schools receive four times the rule-based allocation of richer schools and rural schools receive three times the allocation of urban schools. • Equity of discretionary funds. There is no evidence that discretionary funds are distrib- uted in a progressive manner, with poorer schools receiving more than their richer counterparts. If anything, discretionary fund- ing within rural areas has a higher probabil- ity of being disbursed to wealthier schools, while allocations in urban areas are wealth neutral. • Equity of staff compensation. The data show that the per-pupil compensation of staff is higher in richer and more urban schools, and this arises primarily from higher class sizes and the extensive use of teacher-trainees in rural areas. • Overall equity in funding. Since discretion- ary disbursements can be very large, once these are accounted for the progressive na- ture of the rule-based allocations disappears. At best, funding that flows from the district to the school is wealth neutral (with no signifi- cant differences in received amounts across rich and poor schools), and at worse it is re- gressive for rural and progressive for urban schools. Once staff compensation is factored into the analysis, the results show that the only progressive component of the education sys- tem is the rule-based allocation. Once per- pupil teacher funding is added in, the entire education funding system becomes regressive with poorer schools (K 14,531 per pupil) re- ceiving less than richer schools (K 19,826 per pupil). PRIVATE SPENDING This then opens up the question of household in- puts into education. If there are huge funding differ- entials between schools (for instance, the rule-based component implied that per-pupil funding could vary from K 1,889 to over K 8,000 depending on school size), do households adjust contributions to account for the level of school receipts from the public fund- ing system? If yes, how does this household spending impact on funding equity in the education system? The report presents some preliminary results relating to both household contributions to school funding, as well as household private expenditure on education that complements the construction of the public ex- penditure system presented here. Theissueofhouseholdcontributionstoschoolfund- ing is at an important juncture in Zambia. Anecdotal evi- dence from a number of studies during the 1990s sug- gested that schools had started charging higher Parent Teachers Association (PTA) fees, and a concurrent de- cline in net enrollment during the same time period led to an correlation between lower enrollment and high PTA fees. Consequently, in April 2002 (three months prior to the fielding of the ESDS) PTA fees were abol- ished for primary and basic schools and the government reiterated its commitment to free basic education. With this background in mind, the key findings regarding household contributions to school fund- ing follow: • The announcement seemed to have had the desired effect. PTA fees decreased to less than 30 percent of 2000 values, although this decline is concentrated primarily in the urban areas of Lusaka and Copperbelt. The gradient between PTA fees and school wealth has also declined sharply during the same period. • For all provinces, but especially for Eastern and Northern provinces, public funds are the most important source of financial flows to the school, comprising 96 percent of the total fund- ing of the schools in Eastern province (the most reliant on public funds) and 82 percent in Lusaka province (the least reliant). • Since the contribution of households to school funding is small, the addition of private funds should not alter the results regarding equity in school funding obtained in the previous section, and this is indeed the case. Thus, the difference in xiv
  • 15. private contributions between schools with poorer and richer households is only K 1,300 per pupil compared to K 3,100 for public funding. • Examining only private contributions to school funds can be misleading if most inequality in private expenditure is at the level of the house- hold,i.e.,throughprivate,household-levelnonfee spending (purchase of textbooks). The final sec- tion examines this aspect of educational funding. • Nonfee expenditures are seven times the cor- responding expenditure on school fees. Thus, nonfee expenditures are the main source of inequalities in private expenditure. When such private spending is included in the total funding picture, the nonprogressive nature of the pub- lic funding system worsens: the share of edu- cational expenditures for the poorer 50 per- cent of the population declines from 40 to 34 percent once private expenditures are factored into the analysis. • There isstrongevidencethathouseholdsdecrease spendingwhenpublicfundingincreases. Thissug- gests that, although public funding could address inequalities in educational spending by progres- sive allocation across villages and schools, the de- sired impact of such redistributions may be less than imagined due to the crowding-out of private expenditures. DISCUSSION AND CONCLUSIONS This report makes three contributions to the understanding of education funding in the Zambian context. First, it shows that funding characteristics are closely linked to the type of funding and the way it is disbursed. In the case of rule-based funding, the disbursement system seems to works efficiently and there is no evidence that such funds are diverted from their stated purpose. The majority of discre- tionary funds, however, are spent at the district and provincial levels, and less than 20 percent is allocated to schools. Second, analyzing funding equity using the wealth of pupils in the school shows that the spe- cific rule used in the case of rule-based allocations has led to greater per-pupil funding for poorer and more rural schools. However, these allocations are the only progressive disbursements. Per-pupil staff allocations are higher in urban and richer schools. For discretionary allocations there is evidence of higher disbursements to richer schools within ru- ral areas, and wealth-neutral allocations within ur- ban areas. Once all sources of public funding are factored into the analysis, public school funding in Zambia is regressive, with almost 30 percent higher allocations to richer schools. Third, the report shows how private expendi- ture at the level of the household impacts equity in education funding. It argues that nonfee expendi- tures incurred by households, rather than contri- butions to school funds through PTA and other fees, are the major source of inequalities in the current environment. Moreover, it find evidence that house- holds decrease private contributions when public funds to the schools increase. If the government wishes to allocate higher fund- ing to poorer schools, these findings suggest that a greater percentage of all funding allocation should be rule-based. It was initially thought that the pro- cess of decentralization would partially fulfill this need, since more money would flow directly to the districts, making accountability and therefore dis- bursements higher. Unfortunately decentralization seems to have only shifted spending from the prov- ince to the district, and, in terms of funding equity, it is precisely at the district level that richer schools are receiving higher discretionary funds than their poorer counterparts. Even if rule-based funding were to increase, three subsidiary implications need to be carefully evaluated. First, the current rule-based allocation implies that schools fare better in terms of per-pu- pil funding if they decrease enrollments. A more common funding rule (used, for instance, in Uganda) is based on transfers that increase the number of enrolled children (such as $1 per enrolled child). There is unfortunately no guarantee such a scheme would work as well as the current, unambiguous rule. One suggestion would be to continue with the current rule (which also has the desired equity im- plications), but to monitor enrollment carefully through regular data collection under the school census. Second, an increase in public funds to schools crowds out private spending. Although the results presented here are preliminary, there is evidence that this crowding-out can be fairly large. Thus, xv
  • 16. public funds may be far more effective at address- ing inequalities across rather than within villages. This would suggest targeting at the level of schools, with greater funding to poorer regions. Third, the crowding-out of private expenditures by public funding implies that rule-based funds may not have the desired impact on learning achieve- ment. Since for every dollar of school funding, pri- vate funding decreases, the true increase in total funds available for education is much less than the additional dollar. This would suggest that increases in funding may not be the optimal way to improve educational attainment. It might be more benefi- cial to concentrate instead on providing inputs that households cannot supply on their own, such as high-quality teachers.4 NOTES 1. In Kwacha terms, schools receive either K 2.6 mil- lion or K 3.0 million. We use the dollar equivalents at the exchange rate of $1=K4,400. 2. Unless of course, rich schools systematically de- preciate their infrastructure faster than poor schools, but this does seem unlikely a priori. 3. Consider two districts each with 100 schools but average enrollments of 50 (district A) and 100 (district B). Since the rule-based allocation is a fixed per-school grant, both districts receive exactly the same allocation. However, since district A has a smaller number of stu- dents than district B, the average per-pupil grant will be much higher in district A compared to district B. 4. This argument will be developed fully in another report on the relationship between schooling inputs and learning achievement.
  • 17. Introduction 1 T he importance of education for development provides a strong case for allocating public expenditures to the education sector. But simply allocating more central budgetary resources to the education sector may not deliver better out- comes. Budgetary resources may not reach the in- tended beneficiaries, and even if they do, these re- sources may not lead to the desired outcomes. This report examines the structure of funding and ser- vice delivery in Zambia using a recently completed Educational Service Delivery Survey (ESDS). The Government of the Republic of Zambia (GRZ) has long recognized the importance of edu- cation. It set up universities immediately following independence and has focused more recently on attaining equity and quality in primary education. Nevertheless, a sharp decline in copper prices since the mid-1980s (the main export) and a commensu- rate decline in GNP per capita (from $590 in 1975 to $300 in 2000) has presented several obstacles for the education sector. To overcome these obstacles, the government and a consortium of donors have been working together to improve educational outcomes in the country. Some of these changes are directly related to overall financ- ing of education and others aim to improve the deliv- ery of education by changing the administrative and institutional structure of education delivery. The Education Service Delivery Study (ESD) is designed to examine the structure of funding and implications for service delivery, and the relation- ship between public expenditure and educational outcomes. Specifically, it tries to answer two ques- tions: (1) What is the current record of the educa- tion sector in delivering services to the intended re- cipients? (2) Have the changes undertaken by the Ministry of Education had the desired consequences in terms of educational outcomes? The study specifically takes into account linkages that may arise among the different players involved in the delivery of education (for instance, the district education office, Parent Teachers Associations, the provincial education office, schools, and pupils) and examines the way these players respond to changes in the institutional setting and funding structure.5 The ESD addresses these issues through the careful mea- surement of school inputs (the subject of this re- port), and educational outcomes through tests ad- ministered to the same pupils at two different times in collaboration with the Examination Council of Zambia (another report). This report focuses on public and private expen- diture at the school level. It provides a detailed evalu- ation of public expenditure through a tracking and a funding-equity exercise, which gauges the extent to which educational expenditures earmarked under the central budget actually reaches schools, as well as the extent to which such funding can be regarded as pro- gressive. A related body of work in Uganda (Ablo and Reinikka 2000; Reinikka and Svensson 2002) shows that the traditional view of the government as a be- nevolent agent is highly simplistic—public funding may not matter simply because it does not reach grassroot levels of the administrative structure. 17
  • 18. 18 • AFRICA REGION HUMAN DEVELOPMENT WORKING PAPER SERIES Of the four questions that repeatedly concern us during this exercise, the first three relate to the public funding of education and the last examines private educational funding and its relationship to public ex- penditure. • What percentage of resources is spent at each level of the administrative hierarchy? • To what extent is variation in funding across districts and schools explained by funding for- mulas that relate budgetary allocation to dis- trict and school characteristics, such as enroll- ment or the number of schools? • To the extent that there is variation in funding across districts and schools, what is the rela- tionship between this variation and character- istics of districts and schools? (For instance, do richer districts and schools systematically re- ceive more funds?) • How important is private funding in the provi- sion of education and how does this compo- nent of funding relate to equity in the overall funding of education? The findings from this report provide the basis for the second component of the ESD study (an- other report), which relates the availability of fund- ing to improvements in learning outcomes in Zam- bian schools. The main concern in addressing this set of issues arises from the observation that lower school funding does not in itself imply worse outcomes. Problems of inappropriate use may be worse at the level of the school or higher levels of the administration may be better able to use available resources. The second component of the study on enrollment and learning outcomes will make some welfare statements regarding the find- ings of the current report. This report is structured as follows. Section 2 pro- vides a brief history of education in Zambia during the 1990s. Section 3 describes the methodology, and section 4 describes the school sample. Funding flows are examined in section 5, and section 6 discusses leakage. Section 7 addresses the equity aspects of education funding and examines the association be- tween funding and school and district characteris- tics. Section 8 presents preliminary results from the related household survey on private expenditures. Section 9 concludes. NOTES 5. Todd and Wolpin (2003) illustrate this kind of link- age. An intriguing aspect of the link between public ex- penditure and education is that it is extremely hard to demonstrate any effect of increased funding to schools on learning by pupils (see for instance, Hanushek 1986). Todd and Wolpin argue that a potential reason for this (weak) relationship is that households change their be- havior with the level of public funding; when public ex- penditure is high, households spend less and vice versa, keeping the overall level of schooling inputs for the child constant.
  • 19. Zambian Education during the 1990s 2 A decline in copper prices has been accompa- nied by a commensurate decrease in income and government resources. Since 1998 do- mestic financing fell from 2.3 percent of GDP to only 2.1 percent in 1999, and although the share of pri- mary education has increased from 54 to 57 per- cent over the same time period, net funding for pri- mary education has declined (World Bank 2001; Siamatowe 2002). Equally important, actual overall expenditure has declined during the past six years, from US$ 97 million in 1996 to US$ 74 million in 2000 (Siamatowe 2002). As a result, average real per capita government education expenditure in 1996– 98 was only 73 percent of its 1990–92 level, declin- ing further to an average of 60 percent of this level by 1999–2000.6 This decline in funding seems to have had a number of undesirable impacts. First, primary school enrollment is currently low, and there is strong evidence that it has fallen in the last decade. Table 1 shows that net enrollment Table 1. Enrollment Rates, 1992–2001 (percent) Enrollment rates 1992 1996 2001 Net (Gross) enrollment rate (Primary) Female 66 57 60 (92) (77) (78) Male 65 54 60 (107) (86) (90) Net (Gross) enrollment rate (Secondary) Female 6 12 16 (9) (16) (24) Male 8 11 16 (16) (23) (29) School participation rate (Primary) Female 77 68 67 Male 77 66 67 School participation rate (Secondary) Female 46 45 48 Male 65 61 66 Data sources: Analysis based on Demographic and Health Surveys (1992, 1996, and 2000). The net enrollment rate and gross enrollment rates follow standard definitions. The school participation rate (primary) is defined as the percentage of children between 7 and 13 years of age enrolled in school at the time of the survey. The secondary participation rate uses the age group 14 to 18 instead. 19
  • 20. 20 • AFRICA REGION HUMAN DEVELOPMENT WORKING PAPER SERIES stood at 60 percent in 2001, with limited gender disparity at the primary school level.7 These levels are similar to Kenya, higher than Mozambique, but below levels typically attained in other Southern Af- rican countries.8 Net primary school enrollment rates for both girls and boys over the last decade have declined by 5 percent. Although declines of a similar magnitude are found in other African countries like Botswana and Lesotho, the decline in Zambia is larger than in comparable countries, such as Mozambique or Tanzania (UNESCO Edstats 2002). Figure 2 shows further characteristics of school enrollment in Zambia based on age-specific enroll- ment rates (Filmer and Pritchett 1999). The indi- vidual curves show the proportion of children en- rolled in school at the time of survey, where the pri- mary data is based on the Demographic and Health Surveys from 1992 and 1996. Net enrollments are substantially higher in urban areas, and the differ- ences in enrollment between the poor and the rich are also substantial.9 Moreover, the curves clearly show delayed enrollment among all income groups in Zambia. Even among the rich (1996 survey), en- rollment is less than 50 percent for children aged seven or less. Finally, in every income group across rural and urban locations there has been a decline in enrollment between 1992 and 1996, and this decline appears to be particularly severe for middle-income groups. Other characteristics based on the Living Condi- tions Monitoring Survey (LCMS) data (World Bank 1998) show further problems with grade-specific enrollment rates in grade 1 and grade 7, and pro- gression rates between grade 8 and 9. The LCMS data show rapid declines in enrollment over the years, suggesting substantial dropout. While 90 per- cent net enrollment at grade 1 is achieved, this fig- ure is 34 percentage points lower by grade 7. Fur- ther, the progression rate from grade 7 to 8 ap- pears to be only 33 percent. Data comparability Figure 2. Characteristics of School Enrollment in Zambia Source: Based on Filmer and Pritchett (1999). 1992 1996 1992 1996 1992 1996 Low income 0 0.2 0.4 0.6 0.8 11 6 7 8 9 10 11 12 13 146 11 12 136 Rural Proportioncurrently enrolled 0 0.2 0.4 0.6 0.8 11 6 7 8 9 10 11 12 13 146 11 12 136 Age 0 0.2 0.4 0.6 0.8 11 6 7 8 9 10 11 12 13 146 11 12 136 Urban Middle incomeHigh income 0 0.2 0.4 0.6 0.8 11 6 7 8 9 10 11 12 13 146 11 12 136 Age 0 0.2 0.4 0.6 0.8 11 6 7 8 9 10 11 12 13 146 11 12 136 Age Percentcurrently enrolled AgeAge 1992 1996 1992 1996 1992 1996 Low income 0 0.2 0.4 0.6 0.8 11 0 0.2 0.4 0.6 0.8 11 6 7 8 9 10 11 12 13 146 11 12 136 Rural Proportioncurrently enrolled 0 0.2 0.4 0.6 0.8 11 0 0.2 0.4 0.6 0.8 11 6 7 8 9 10 11 12 13 146 11 12 136 Age 0 0.2 0.4 0.6 0.8 11 0 0.2 0.4 0.6 0.8 11 6 7 8 9 10 11 12 13 146 11 12 136 Urban Middle incomeHigh income 0 0.2 0.4 0.6 0.8 11 0 0.2 0.4 0.6 0.8 11 6 7 8 9 10 11 12 13 146 11 12 136 Age 0 0.2 0.4 0.6 0.8 11 0 0.2 0.4 0.6 0.8 11 6 7 8 9 10 11 12 13 146 11 12 136 Age Percentcurrently enrolled AgeAge
  • 21. PUBLIC AND PRIVATE FUNDING OF BASIC EDUCATION IN ZAMBIA • 21 appears difficult, but this latter figure appears to be lower than most other African countries, es- pecially in Southern Africa.10 This suggests that in Zambia, in addition to declining enrollments over the last decade, there seems to be a particular problem with pupil retention within the primary education system and progression after grade 7. Since 1998, however, the government in col- laboration with a consortium of donors has worked actively to reverse steadily declining out- comes in the education sector. Specifically, the government’s Basic Education Sub-Sector Invest- ment Program (BESSIP) was the subject of a Joint Appraisal in September 1998, and donors made new financing commitments in support of BESSIP beginning in 1999. This collaboration has resulted in changes both in the funding of education and the administrative structure of education delivery (decentralizing decisions and funding to the district level through district education boards is one such example), teacher deployment, and the ability of schools to levy fees and contributions. This re- port examines whether further changes can be made to the institutional structure of education delivery to improve outcomes in the education sector. NOTES 6. World Bank data based on Government of Zambia Financial Statements. 7. Depending on the sources used, net enrollment varies from 68 to 72 percent, so that 72 percent repre- sents an upper bound. 8. See, for example, online educational databases such as World Development Indicators (World Bank) and Edstats (UNESCO)). 9. These two statistics are not unrelated, since rural poverty is still substantially higher than urban poverty (83 versus 56 percent) despite some recent increases in ur- ban poverty (World Bank 2001). 10. For instance, this is lower than Mozambique for 1990 (39 percent), but higher than Tanzania in 1998 (14 percent).
  • 22. Tracking Methodology 3 T he tracking exercise was designed to collect information on the effectiveness of funding programs in reaching their intended benefi- ciaries, and the relationship between increased fund- ing at the central level and educational outcomes in schools. The survey was carried out at various lev- els of the administrative structure, including the prov- ince office (immediately below the Ministry of Edu- cation), the district office, schools, and households. The tracking exercise follows the flow of funds and educational resources from the Ministry of Educa- tion to the province education office and then on- ward to the district education office and the schools. While in theory such an exercise may seem relatively straightforward, the complexity of funding flows and the multiplicity of sources at each level of the ad- ministration for educational funding and materials makes this exercise challenging. In the Zambian education sector, funding to schools has three separate components. The first is a per-school grant of $600 (for primary) and $650 (for basic) schools.11 The second is the money dis- bursed by districts (and in some cases provinces), presumably using some notion of need at the level of the school. The third is remuneration of staff through salaries and benefits. What does this fund- ing structure imply for the tracking of public expen- ditures? In the Uganda study (Ablo and Reinikka 2000), the government used a clearly defined rule to allo- cate funds to schools. Schools were allocated $1 for each enrolled child. In this context, leakage in public funding was defined as the ratio of what a school actually received to what the school was supposed to receive. The per-school grant in Zambia corre- sponds exactly to the per-pupil grant in Uganda. Analogous to the Uganda study, leakage in rule-based allocations in Zambia can be defined as follows: Leakage = Unlike the Uganda study, however, this report goes beyond an estimate of leakage in allocated funds. It uses an innovative approach to provide a complete picture of the funding for educational in- stitutions by examining all sources of funding for the school. In the case of the fixed grant and the salary component, the Uganda methodology is used to de- termine leakage in the system. But in the case of discretionary components, this methodology fails since there is no rule about the amounts that schools are supposed to receive. Therefore, it is not possible to benchmark the amounts that schools actually receive or determine what constitutes leakage in the sys- tem. This problem is addressed by classifying funding flows into the rule-based component (the $600 fixed grant), the discretionary component (infrastructure and other grants), and the payroll component, and focusing on three related issues: • The pure tracking exercise first asks how much money per pupil is available at each level of the delivery chain (see section 5). This addresses the issue of the percentage of spending undertaken 22 amount received by school $600 ($650 for basic schools)
  • 23. PUBLIC AND PRIVATE FUNDING OF BASIC EDUCATION IN ZAMBIA • 23 at different levels of the hierarchy and the amount that finally reaches the schools. • The estimate of leakage focuses on the rule- based allocations and payroll components (see section 6).12 • Equity in funding examines the degree to which variation in funding across districts and schools is explained by funding rules (see section 7). To the extent that there is excess variation after ac- counting for differences due to funding rules, the relationship between this excess variation and district and school characteristics is analyzed. The entire equity exercise is made possible through the careful data collection on the household assets of pupils in the school. Such data is normally not available as part of expenditure tracking surveys. This report shows that the regular collection and analysis of this information has important repercus- sions for policies regarding the delivery of educa- tion. Educational funding in Zambia derives both from domestic (GRZ) funding and funding from donors. In the case of donors, funds are divided into four categories: donor funds bracketed as Case I, Case II or Case III, which are controlled by the Ministry of Education, and Case IV donors that administer funds directly.13 While most funding is theoretically ob- tained from the GRZ, a clear distinction at all levels of the administration is maintained throughout the report between BESSIP funding (the program linked to the consortium of donors that form Case I–Case III) and other GRZ funding. To better understand the flow of funds and re- sources, it is useful to build classifications based on the type of resource (fund) and the underlying ad- ministrative structure, and the level of discretion at each level of the administration to allocate and dis- tribute such flows. Resources and funds are divided into three categories: educational materials (such as textbooks), monetary (only cash), and payroll (re- muneration of staff). The four provinces of the sur- vey are divided in two categories: provinces with dis- trict education boards (henceforth decentralized prov- inces—Lusaka and Copperbelt in the sample) and provinces without district education boards (hence- forth centralized provinces—Northern and Eastern in the sample).14 Using this typology, school funding is composed of five types of funds and resources: • Cash flows: fixed-grant component. The fixed-grant component (also referred to as the BESSIP grant) is the per-school allocation of ei- ther $600 or $650, and no level of the adminis- tration has discretion over the amount dis- bursed. No information is required for the dis- bursement of funds as in the per-pupil allotment in Uganda, where data is required on enroll- ments in the school, and which may be subject to distortions at the level of the school or dis- trict. The fixed-grant is a rule-based component of school funding. • Cash flows: infrastructure grants. Schools also receive money for rehabilitation of classrooms or for new construction (infrastructure). This money is disbursed through the microprojects unit of the Zambian Social Investment Fund, but the district retains considerable discretion over disbursement. Such grants are part of the dis- cretionary component of school funding. • Cash flows: other grants. Schools may re- ceive additional money from the GRZ or Case IV donors (mostly funding through the Program for Advancement of Girls’ Education), and these resources are distributed entirely at the discre- tion of the district. Consequently, as with (2) above, these grants are classified as a discre- tionary component of school funding. • Flows of educational materials. Schools may receive educational materials such as textbooks and chalk, again allocated at the discretion of the district, with some input from the provinces and the Ministry of Education. Although it is technically possible to track such resource flows, the procurement of educational materi- als had not yet been completed at the time of the survey (midway through the academic year). As a result, schools received such materials spo- radically and in very small quantities. This com- ponent is excluded from the exercise. • Payment of staff. Staff remuneration can be thought of as arising from rule-based and dis- cretionary components. Specifically, the salaries and allowances of teachers are paid through the centralized payroll system. Neither provinces nor districts have discretion over the salary or
  • 24. 24 • AFRICA REGION HUMAN DEVELOPMENT WORKING PAPER SERIES allowances that a teacher receives, so this is identified as a rule-based component of staff payment. On the other hand, payments of one-time benefits (detailed below) are left to the discretion of districts and provinces, so this is identified as a discretionary component. Since most staff remuneration is a direct flow from the center to the teachers payroll funds are omitted from the tracking exercise,15 and this component in discussed in the sections on leakage and funding equity. The structure of fund- ing flows is summarized in table 2. SUMMARY Funding flows to schools in Zambia are divided into a rule-based component and a discretionary component to track and analyze the level of expen- ditures at each level of the administrative hierarchy. a. Northern and Eastern province in the ESDS. Table 2. Structure of Resource and Funding Flows in Zambia Ministry of Education/ Ministry of Finance Does province have discretion? (centralized)a Does province have discretion? (decentralized) Does district have discretion? (centralized) Does district have discretion? (centralized) What can the school/teachers expect to receive? Flows of educational materials (discretionary) Handles procurement and distributes to provinces/districts YES Decides how much to pass on to district NO Materials passed directly to districts YES Decides how much to pass on to schools YES Decides how much to pass on to schools Depends on district Payment of staff: salaries and allowances (rule-based) Completely centralized and are made directly to teachers NO NO NO NO Teachers receive salaries and allowances according to the salary scale Payment of staff: One time benefits (discretionary payments) Disburses funds to provinces and districts for such payments YES YES YES YES Payments for one-time benefits such as leave and transfers Cash flows from GRZ: fixed grant (rule- based funding) An allocation of either $600 or $650 is made to every primary- basic school. NO NO NO NO $600 or $650 Cash flows from GRZ: (discretionary funding) Allocations are made for recurrent and capital expenditures, as well as disbursement to districts/schools YES Decides how much to pass on to districts NO Districts receive most money directly YES Decides how much to pass on to schools YES Decides how much to pass on to schools Depends on district: Schools may expect to receive money for recurrent/ infrastructure expenditures Cash flows from case IV donors (discretionary component) No discretion. Most money from case IV donors is for PAGE (Program for Advancement of Girls’ Education) YES Province decides how much to pass on to districts NO Districts receive most money directly YES District decides how much to pass on to schools YES District decides how much to pass on to schools Depends on district
  • 25. PUBLIC AND PRIVATE FUNDING OF BASIC EDUCATION IN ZAMBIA • 25 For the rule-based and payroll components, leakage is identified as the ratio of what the school received to what the school was supposed to receive. The analysis of equity in funding flows examines total funding per pupil, including the two components above, as well as remunerationofstaff,andstudiesthecorrelatesofsuch funding with particular emphasis on the wealth of stu- dents’ households. In order to analyze equity in fund- ing, it is critical to establish a tracking exercise (see sec- tion 5). One far-reaching conclusion from the Uganda study was that budgetary allocations cannot be used as a proxy for funding at the school level. NOTES 11. In current terminology, a “lower-and-middle ba- sic school” offers grades 1–7 and a “full-basic school” offers grades 1–7 and continues to grades 8-9. This re- port refers to them as primary schools, (grades 1–7), and basic school, (grades 1–9). 12. For discretionary components, we remain ag- nostic about whether low/high receipts at the school level constitute good or bad service delivery. This is- sue is addressed in a follow-on report on outcomes and efficiency of public spending. 13. DFID, Ireland, the Netherlands, and Norway contribute to the Case I pool; IDA credit is Case II; the African Development Bank is Case III; and USAID, JICA, and Denmark follow Case IV. 14. The prevalence of both systems of adminis- tration arises because district education boards have been phased in since 2000. Decentralization was in- troduced to grant greater autonomy to districts and to reduce their dependence on the province for fund- ing. 15. The money for salaries and allowances are dis- bursed directly to teachers so that no money passes through the administrative chain. Although it is theo- retically possible to track one-time benefits, these funds are not earmarked for such disbursements and hence cannot be traced through the system.
  • 26. School Characteristics of the Sample 4 T his section provides a brief introduction to the sample. The schools surveyed were cho- sen from a list frame of primary and basic schools in four Zambian provinces: Lusaka, Copperbelt, Northern, and Eastern. A random sample stratified on the basis of urban and rural lo- cations included 184 schools in 33 districts. As part of the re-testing exercise, 3,200 pupils formed the initial sample for the administration of tests in En- glish, mathematics, and vernacular (Icibemba or Nyanja).16 The choice of these four provinces was dictated primarily by the variation in educational at- tainments, regional incomes, and administrative structures. Specifically, Lusaka and Copperbelt are the two richest provinces in Zambia, with commen- surately high enrollment rates, and Northern and Eastern provinces are the poorest, with enrollment rates only marginally better than the worst perform- ing Central province (table 3). Learning outcomes confirm the wide disparities in performance among the provinces studied: apart from Northwestern province, Northern and Eastern provinces reported the worst English and mathematics scores, while Lusaka reported the best (table 4). The schools in the sample are grouped into four descriptive categories: school enrollment and staff- ing, school infrastructure, school performance, and characteristics of households in the school. Since sig- nificant differences are likely to emerge between urban and rural schools, the summary statistics are disaggregated by school location. Table 5a shows significant differences between rural and urban schools in enrollment and staffing. Urban schools tend to have large enrollment (an av- erage of 1,440 pupils per school compared to 554 Table 3. Enrollment, Urbanization, and Poverty (percent) Net Poverty enrollment head Population Province age 7–13 count Rural share Central 75 77 66 10 Copperbelta 76 65 23 18 Easterna 49 79 91 13 Luapala 61 81 86 7 Lusakaa 79 53 19 15 Northerna 60 82 84 12 North Western 66 76 86 6 Southern 73 75 80 12 Western 64 89 90 7 All Zambia 68 73 63 100 a. Provinces covered in the ESD sample. Source: World Bank (1998). Table 4. Mean Math and English Scores, by Province Province English Math Central 9.02 14.94 Copperbelta 9.06 13.60 Easterna 9.02 13.56 Luapula 9.68 13.90 Lusakaa 10.34 15.16 Northerna 8.68 13.21 North Western 7.76 13.37 Southern 9.43 14.37 Western 8.95 13.62 a. Provinces covered in the ESD sample. Source: ESDS team calculations based on Examination Council Data. 26
  • 27. PUBLIC AND PRIVATE FUNDING OF BASIC EDUCATION IN ZAMBIA • 27 for rural schools), but the difference in size is more than compensated for by the difference in staffing. The pupil-teacher ratio in urban schools at 42 is much closer to the Zambian goal of 40 pupils per teacher than the rates in rural schools at 61.17 Also notewor- thy is the large difference in female teachers between urban and rural schools. Female make up 70 per- cent of the teaching workforce in urban schools, and 31 percent in rural schools. Conversations with teachers suggest that safety and the lack of teacher’s housing is a major concern in rural areas. If there is a significant difference in performance by the gen- der of the teacher, this is an area for future policy consideration. Table 5b shows the distribution of key infrastruc- ture variables in urban and rural schools. All three variables reported—number of pupils per classroom, number of students per toilet, and number of teach- ers per staff house—suggest considerable over- crowding, although the lack of data from other coun- tries does not allow us to establish a suitable bench- mark. With an average of 6.4 teachers per staff house, it appears there is a considerable shortage of staff housing in the system. Interestingly, for all three indicators of infrastructure, rural schools perform better than their urban counterparts, and this differ- ence is significant for toilets per pupil and teachers per available staff house. The next two tables provide performance indi- cators for, and household characteristics of, children in the school. Table 5c shows four key indicators of performance: children repeating classes, dropouts, and performance on examinations for male and fe- male students. Two key points emerge. First, rural schools perform significantly worse than urban schools in terms of repetition and dropouts. Close to 10 percent of students in rural schools repeat a grade, whereas 5 percent of students in urban schools repeat a grade. Similarly, dropouts in the previous year as a percentage of current enrollment was 5 percent in rural schools and 2 percent in urban schools. The poorer performance of rural schools, however, did not extend to performance on the na- tionwide grade 7 examination in 2000. In fact, rural schools performed slightly better, achieving a pass rate of 51 percent (males) and 45 percent (females), compared to 44 (males) and 43 (females) percent for their urban counterparts.18 Table 5d presents households indicators for rural and urban schools. Two characteristics emerge from this table. First, children attending rural schools come from poorer households compared to their urban counterparts (the average difference exceeds one standard deviation in the wealth distribution). Sec- ond, although averages are very high, school atten- dance for single and double orphans is the same in Table 5a. School Enrollment and Staffing Variable Urban Rural Difference School size 1439.5 553.4 886.56a (number of pupils) (74.23) (38.19) Number of 37.5 12.8 21.98 a teachers (1.67) (1.15) Female teachers as 69.0 30.9 –38.10 a percent of total (5.6) (4.3) Pupil-teacher 42.25 60.96 –18.70 a ratio (2.93) (3.76) a. Difference is significant at the 5 percent confidence level. Standard errors in brackets. Source: ESD sample. Table 5b. Infrastructure Variable Urban Rural Difference Number of pupils per 103.4 96.7 6.73 classroom in good condition (7.14) (4.76) Number of pupils per 198.9 113.2 85.72* toilet in good condition (39.9) (15.2) Number of teachers per 11.39 4.34 7.04* staff-house in good condition (2.01) (0.827) a. Difference is significant at the 5 percent confidence level. Standard errors in brackets. Source: ESD sample. Table 5c. Key Performance Indicators Variable Urban Rural Difference Repeating the same 4.7 9.45 –4.74* grade (percent) (0.49) (0.62) Dropouts as ratio of current 1.67 4.56 –2.88* enrollment (percent) (0.32) (0.47) Pass-rate in 2000 Grade 44 50.5 –6.50 VII examination (males) (6.1) (4.8) Pass-rate in 2000 Grade 42.5 44.5 –2.00 VII examination (females) (6.0) (4.8) a. Difference is significant at the 5 percent confidence level. Standard error in brackets. Source: ESD sample.
  • 28. 28 • AFRICA REGION HUMAN DEVELOPMENT WORKING PAPER SERIES rural and urban. On average, one in every 13 pupils is a single orphan (has lost a single parent) and one out of every 25 pupils is a double orphan (has lost both par- ents). From this table one would expect a priori that vulnerabilityisasignificantprobleminruralschoolscom- pared to urban schools in terms of overall poverty, but not in terms of the orphan status of the child. SUMMARY This section provides insights regarding the equity aspects of the rule-based component of funding. Because schools in rural regions tend to have lower enrollment than their urban counter- parts, and the rule-based funding is allocated on a per-school basis, as long as schools receive the allotted amounts, one would expect rural schools to receive higher per-pupil amounts. This has di- rect implications for equity. Since rural schools are also poorer than urban schools, in theory, rule-based funding should be highly progressive. NOTES 16. Detailed notes on the sampling procedure can be found at http://econ.worldbank.org/programs/ public_services/topic/tools. 17. This does not imply that classes are bigger in rural schools. Data from the survey suggests that teachers in rural schools teach more hours than their urban counter- parts, and as a result the average class size is actually lower in rural schools. 18. This is probably due to greater ability-based selec- tion into higher grades in rural areas. For instance, in rural areas 40 percent of students do not make it to grade 7. If these children are worse than the average enrolled child, test scores in rural areas will reflect this selection process. Table 5d. Household Indicators Variable Urban Rural Difference Average value of wealth index of households with 0.74 –0.44 1.18* children in the school (0.067) (.05) Percentage of children who 7.6 7.7 –0.10 are single orphans (3.2) (2.5) Percentage of children who 4.72 4.79 –0.70 are double orphans (2.5) (1.9) a. Difference is significant at the 5 percent confidence level. Standard error in brackets. Source: ESD sample.
  • 29. Expenditure Tracking at Provincial, District, and School Levels 5 T his section examines whether schools actu- ally receive the fixed-grant component, and whether provinces and districts further sup- port poorer districts and school through discretion- ary cash grants. The tracking exercise for nonsalary funding assesses the total amount of cash available at the province and district levels, and then tracks the movement of funds from provinces to districts and from districts to schools.19 Figure 3 highlights the distinction between centralized and decentralized 29 Figure 3. Funding Flows across Centralized and Decentralized Provinces Note: Decentralized provinces are Lusaka and Copperbelt. Centralized provinces are Northern and Eastern. Ministry of Education (Centralized) (Decentralized) District (Centralized) District (Decentralized) SchoolsHouseholds Discretionary flows Rule-based flows Case IV donors (primarily the Program for Advancement of Girl’s Education Ministry of Education (Centralized) (Decentralized) District (Centralized) District (Decentralized) SchoolsHouseholds Discretionary flows Rule-based flows Case IV donors (primarily the Program for Advancement of Girl’s Education Province Province
  • 30. 30 • AFRICA REGION HUMAN DEVELOPMENT WORKING PAPER SERIES provinces in terms of expenditure flows. The arrows divide funding flows into rule-based and discretionary components. One characteristic of the funding sys- tem becomes immediately clear—funding in the sys- tem does not flow in a top-down manner. Instead, fresh money enters the hierarchy at each level. In both centralized and decentralized provinces, money given under the BESSIP program (Case I–Case III donors) enters directly at the district level. In de- centralized provinces other cash flows move directly to districts. Finally, fresh money enters at the level of the school through household contributions. An accurate assessment of the resources available at each stage involves tracking monetary flows from the funding body immediately above as well as the flows that directly enter the system at each level. Each of these funds will be reported in terms of Kwacha per pupil. Total funds are divided by total en- rollment in the province (and similarly for districts and schools).20 The data on enrollment is based on the 2001 schools census, using grade 1–9 pupils of all schools for which the GRZ has some funding respon- sibility (this includes schools aided by grants and com- munity schools, but excludes five private schools).21 THE PROVINCIAL LEVEL Cash receipts. Table 6 shows the cash received per pupil at the level of the province averaged over one year (June 2001 to June 2002). The pattern of receipts at the provincial level are clearly in line with expected receipts from the decentralization process. The centralized provinces receive sums that are or- ders of magnitude higher than their decentralized counterparts, with Eastern province (K 29,000 per pupil) receiving more than seven times the receipts for Copperbelt (K 4,133 per pupil). The amounts received in the centralized prov- inces give a rough idea of the money passing to the provinces from the ministry. From the Ministry of Education “Financial Statistics 1986–2000” and the BESSIP Financial Statement 2000, total per-pupil re- current expenditure for basic schools (not includ- ing salaries) is K 29,550 and total per-pupil capital expenditure is K 36,519. Since money given to the Table 6. Cash Received by Province Education Offices Cash receipts Total Province (Kwacha primary type Province per pupil) enrollment Centralized Northern 19,779 235,012 Eastern 29,308 192,321 Decentralized Copperbelta 4,133 286,710 Lusakaa 8,034 206,318 a. Decentralized provinces with district education boards. Source: ESD survey data and total primary enrollment date from the Zambian School Census (2001). Table 7. Funding Sources at Province Education Office Level, June 2001–June 2002 (Kwacha per pupil) GRZ funding: Case I– Case III pool GRZ funding Case IV (external sources) (domestic sources) funding Rule-based Discretionary Discretionary component components components Discretionary Province type Province (BESSIP) (HIPC Funds) (other GRZ) components Total Centralized Northern 7,882 4,011 5,250 2,636 19,779 (40) (20) (27) (13) (100) Eastern 2,206 8,947 14,801 3,354 29,308 (8) (31) (51) (11) (100) Decentralized Copperbelta 475 1,764 1,300 593 4,133 (12) (43) (31) (14) (100) Lusakaa 704 5,828 1,350 152 8,034 (9) (73) (17) (2) (100) Note: Percentages (in brackets) may not add up to 100 due to rounding. a. Decentralized provinces with district education boards. Source: ESDS.
  • 31. PUBLIC AND PRIVATE FUNDING OF BASIC EDUCATION IN ZAMBIA • 31 province includes money for recurrent and capital expenditures, an upper bound is that 95 percent of total per-pupil expenditure is available at lower lev- els in the case of Eastern province, and 65 percent is available at lower levels in the case of Northern prov- ince. Table 6 also shows vast differences within cen- tralized and decentralized provinces, with almost a 50 percent difference in cash received per pupil be- tween Eastern and Northern provinces, and a 100 percent difference in cash received between Lusaka and Copperbelt. Table 7 examines these differences further by looking at the receipts per province from the four sources of funding: BESSIP, HIPC (Debt Ini- tiative for Heavily Indebted Poor Countries of the World Bank), and other GRZ and Case IV donors. Two characteristics stand out. First, the funding from nondomestic sources (BESSIP and HIPC), con- sistently exceeds 60 percent of total funding for all provinces (except Eastern with 49 percent). Second, there is no clear pattern in terms of a single prov- ince receiving more or less than others from any single source. Some receive more funding from BESSIP sources (Northern), but less from Case IV and domestic GRZ sources, while others (Lusaka) receive very little from BESSIP, domestic GRZ, and Case IV sources, but large amounts from HIPC. Cash disbursements. From these financial re- ceipts provinces disburse cash to districts. In the case of decentralized provinces (which receive cash di- rectly from the ministry), one would expect disburse- ments to be very low. Table 8 confirms this with data on disbursements to the districts over a six-month period from January 2002 to June 2002. In per-pupil terms, this is virtually nil for all cash in decentralized provinces and for capital expenditures in centralized provinces. However, in the centralized provinces these disbursements represent a small proportion of what the province actually receives. In Northern province, disbursements to districts correspond only to one-third of the annual funding that the province received, and in Eastern province to only one-tenth.22 THE DISTRICT LEVEL Cash received. Table 9 shows the cash re- ceived at the district level.23 The data for one year, from June 2001 to June 2002, are enrollment- weighted averages across all districts in the prov- ince. On average, districts in the Eastern and Northern provinces receive much more (districts in Eastern for example receive almost 60 percent more than Copperbelt districts) than those in Lusaka and Copperbelt, but this hides substantial differences within provinces, an issue explored in section 6. Similar to cash flows at the provincial level (table 7), there are wide differences between district re- ceipts across provinces from the four funding sources. As table 10 shows, the higher level of funding per pu- pil in districts in Northern and Eastern province re- sulted primarily from the rule-based component of the funding system, with the average district in East- ern province receiving more than twice (219 percent) the receipts of the average district in Copperbelt. This variation follows entirely from the specific- ity of the rule-based component, which takes the form of lump-sum payments per school. In provinces where the average school size is smaller, the fixed- grant funding per student will be higher. According to the 2001 school census data, Northern and East- ern schools have, on average, about 315 pupils, while Copperbelt schools have about 877 pupils, and Lusaka schools have 1,037 pupils. The difference in Table 9. Cash Received by Districts (weighted average by province) Cash receipts at district level Province type Province (Kwacha per pupil) Centralized Northern 24,196 Eastern 27,437 Decentralized Copperbelta 17,263 Lusakaa 20,690 a. Decentralized provinces with district education boards. Source: ESDS. Table 8. Funding Disbursed to Districts, January 2002–June 2002 (Kwacha per pupil) Province Recurrent Capital type Province expenditures expenditures Total Centralized Northern 3,381 264 3,645 Eastern 1,390 0 1,390 Decentralized Copperbelta 0 0 0 Lusakaa 397 0 397 a. Decentralized provinces with district education boards. Source: ESDS.
  • 32. 32 • AFRICA REGION HUMAN DEVELOPMENT WORKING PAPER SERIES average enrollment almost entirely accounts for the large variation in per-pupil funding at the district level. Turning to discretionary funds, it is striking that Copperbelt and Lusaka receive more in per-pupil terms via discretionary sources than the centralized provinces, which depend on funding initially routed through the provincial level. Thus in Northern and Eastern province, discretionary sources account for only 20 percent of total resources, whereas this in- creases to 45 percent for the decentralized provinces. Tracking results (province to district). The tracking exercise of public funds from the province to the district level takes into account the complexi- ties of the funding arrangements discussed in the previous section.24 It is assumed that total rule-based cash received by districts is fresh money in the sys- tem, since there is no movement of rule-based fund- ing from the province to the district. Discretionary funding at the district level in centralized provinces (including both GRZ and Case IV sources) is routed via the province; in decentralized provinces funding is not routed via the provinces and constitutes new resources in the system. From this the net total funds passed on to the province and the district via the Ministry of Education can be calculated. Table 11 gives the results. On average, K 28,000 per pupil enters the sys- tem for nonsalary spending from the center. Up to one-third of total cash in the system is earmarked for schools via the rule-based funding component, and the remainder is spent at the discretion of the provinces and districts. As table 11 shows, decen- tralization seems to have decreased the spending at the provincial level. Thus, spending at the pro- vincial level is between K 5,000 per pupil (North- ern) and K 16,800 per pupil (Eastern) in the cen- tralized provinces (18 and 38 percent of total funds in the system, respectively) and this decreases to K 1,500 per pupil for the decentralized provinces (around 7 percent of total funds in the system). As a result the proportion of money available at the level of the district increases in the decentralized prov- inces from 70 percent to more than 90 percent (95 percent in the case of Lusaka) of total funds in the system. This data seem to suggest that the system of de- centralization improves the flow of funds by decreas- ing provincial spending, but it leaves unanswered the question of whether decentralized districts are spending more at the district level, or passing on greater amounts to the schools. THE SCHOOL LEVEL District disbursements and school receipts. Schools are supposed to receive either $600 or $650 through the rule-based component. In addition, they may also receive cash from infrastructure and other spending grants, through GRZ spending or from Case Table 10. Funding Sources at the District Level (Kwacha per student) GRZ funding: GRZ funding from Case IV Case I – Case III pool domestic sources funding Rule-based Discretionary Discretionary Discretionary Average district component components components components Province type in province (BESSIP) (HIPC Funds) (other GRZ) (Case IV funding) Total Centralized Northern 9,576 1,278 4,656 1,547 24,196 (44) (6) (17) (7) (100) Eastern 15,019 921 7,364 1,534 27,437 (63) (4) (21) (5) (100) Decentralized Copperbelta 6,850 1,049 8,074 652 17,263 (43) (6) (43) (4) (100) Lusakaa 4,057 263 9,751 731 20,690 (19) (1) (45) (3) (100) Note: Percentages (in brackets) may not add up to 100 due to rounding. a. Decentralized provinces. Source: ESD data.
  • 33. PUBLIC AND PRIVATE FUNDING OF BASIC EDUCATION IN ZAMBIA • 33 IV donors. Regardless of the original funding body, this money is eventually disbursed through the district. In isolatedcasesschoolsmayalsoreceivefundsfromother sources (churches, local donors, nongovernmental or- ganizations (NGOs), or directly from the Ministry of Education). Since the data contains only one such ex- ample, public funding to the school is considered as a one-way flow from the district. The results of the expenditure tracking at the school level are presented in two parts. First, in continuance of the previous tracking exercise the per-pupil amounts available to each school in dif- ferent districts provides an estimate of the per- centage of funds that reaches schools. Since the rule-based component of funding is a per-school amount, we cannot ascertain leakage through this exercise. The per-school amounts are thus post- poned to the next subsection, where school fund- ing is disaggregated in terms of rule-based versus Table 11. Tracking of Resources, June 2001–June 2002 (Kwacha per pupil per year) Rule-based + Rule- Rule-based + discretionary based Discretionary Discretionary discretionary (district) (district) (district) (province) (total) Total discretionary Total Funds Funds Additional funds funds received Funds received funds available at the directly received directly from at the Spending: Total district from from the from province provincial provincial funds in Province type Province level ministry province ministry to district level level the system (1) (2) (3) (4) (5) (6) (7) (8) Centralized Northern 24,196 9,576 7,812 0 6,808 19,779 5,159 29,355 (82) (33) (27) (0) (23) (67) (18) (100) Eastern 27,437 15,019 2,780 0 9,638 29,308 16,890 44,327 (62) (34) (6) (0) (22) (66) (38) (100) Decentralized Copperbelta 17,263 6,850 0 8,074 2,339 4,133 1,793 19,056 (91) (36) (0) (42) (12) (22) (9) (100) Lusakaa 20,690 4,057 916 9,751 5,966 8,034 1,152 21,842 (95) (19) (4) (45) (27) (37) (5) (100) Note: Percentages of total funds in system are bracketed. All total funds in the system refer to nonsalary resources. a. Decentralized provinces. Sources: ESD survey data. Column (1) data from table 9. Column (2) data from table 10 total rule-based funding to districts. Column (3) extrapolated to yearly spending from data on funding to districts, January 2002-June 2002. Column (4) from table 10, discretionary funds allocated directly to the district in the case of Lusaka and Copperbelt. Column (5): (5)=(1)-(2)-(3)-(4). This correction assumes that funds are reported correctly at the district level and the province underreports transfers. (The sums involved correspond closely to the sum of HIPC and PAGE resources received at the provincial level, which were earmarked to be passed on to lower level, but which may not have been recorded as cash passed on to district.) Column (6) data from table 8. Column (7): (7)=(6)-(5)-(3). Column (8): (8)=(1)+(7). discretionary funding, which directly tackles the issue of leakage. To check for robustness, three options are used to calculate the amounts passed on to schools. Op- tion 1 in table 12 is direct measurement of the cash passed on from the district to the schools in the sample, with the associated problem that the data is only for a sample of schools (those covered by the survey for a six-month recall period). Option 2 is a measure of spending patterns at the district level and is based on a one-month recall of spending in May 2002. Option 3 uses data collected at the school level, with a six-month recall period. The high correlation observed between all three measures confirms the reliability of the reported financial data. Although there is some variation in the amounts depending on the option used, option 3 always lies between options 1 and option 2. One strategy therefore is to use the amount calculated from option 1 as the upper bound
  • 34. 34 • AFRICA REGION HUMAN DEVELOPMENT WORKING PAPER SERIES of school receipts and amount calculated from op- tion 2 as the lower bound. The results of this per-pupil tracking exercise are shown in table 12 (and summarized in figure 4). Col- umns 1, 2, and 3 show the funds available in the en- tire system at the province and district level (identical to table 11). Column 4 shows the total amount passed on to the schools using option 1 (district report). Column 5 shows the spending on schools using shares of spending in May (option 2), and column 6 shows the funds reported by the school (option 3). Option 1 (the upper bound) suggests that typi- cally between 25 and 48 percent of total funding (between K 5,000 and K 13,600 per pupil) in the system is passed on to schools; option 2 (the lower bound) suggests 11 to 33 percent (between K 2,500 and K 8,000) is passed on. Typically less than half the funding in the system reaches the school level, and in Eastern and especially Lusaka province the share seems even lower. Gains from decentralization in terms of reduced spending at the provincial level now disappear: there is no evidence that increased funding to dis- tricts in decentralized provinces is passed on to schools. As a percentage of total funds in the sys- tem, schools in centralized provinces receive around 30 percent of total funds and this actu- ally decreases to (approximately) 25 percent in the case of decentralized provinces. Thus, in terms of funding it appears that decentralization has merely shifted spending from the province to the district, with no improvement in disburse- ments to schools. SUMMARY The tracking exercise established the following characteristics of the education funding system in Zambia. • Discretionary funds at the level of the prov- ince and district account for 70 percent of all funding. On average, about K 28,000 per pupil enters the educational system at the level of the province. Approximately 30 percent of this amount is earmarked for rule-based funds Table 12. Tracking of Resources from the District Level to Schools, 2001–2002 (enrollment weighted by Kwacha per pupil) Rule-based + Discretionary Rule-based + Rule-based + discretionary discretionary (province) (district) (schools) Total discretionary Funds Option 1: Option 2: Option 3: Total funds at the reportedly spending on funds funds available at district passed schools reported in the the provincial education on to (based on by Province type Province system level office level schools shares) schools (1) (2) (3) (4) (5) (6) Centralized Northern 29,355 19,779 24,196 13,618 7,985 9,179 (100) (67) (82) (46) (27) (31) Eastern 44,327 29,308 27,437 15,528 7,408 11,925 (100) (66) (62) (35) (17) (27) Decentralized Copperbelta 19,056 4,133 17,263 9,216 6,215 6,384 (100) (22) (91) (48) (33) (34) Lusakaa 21,842 8,034 20,690 5,382 2,483 3,121 (100) (37) (95) (25) (11) (14) Note: Percentages of total funds in brackets. Data excludes two schools in Kafue district, with substantial reported grants not reflected in district data, and most likely outliers linked to measurement problems. a. Decentralized provinces. Source: ESD data. Columns (1), (2) and (3): taken from table 11. Column (4) reported by district, extrapolated from a recall period January 2002-July 2002 and from data specifically related to the ESDS sample of schools explicitly asking how much cash was allocated to each school in our sample (for recurrent and capital expenditures). Column (5) reported by district, extrapolated from actual spending data for May 2002. Column (6) based on data collected at the schools level, recall period January 2002–June 2002.
  • 35. PUBLIC AND PRIVATE FUNDING OF BASIC EDUCATION IN ZAMBIA • 35 through the fixed-school grant of $600 ($650), and 70 percent is in the form of funding allo- cated at the discretion of provinces and districts. • Between one-sixth and one-third of total funding in the system eventually reaches schools. Of this total amount, between 14 and 34 percent eventually reaches the schools as a combination of rule-based and discretionary spending, and the rest is spent at the provincial and district levels. • Decentralization has shifted spending from the provincial to the district level, but has not resulted in greater disbursements to schools. There are important differences be- tween centralized and decentralized provinces up to the level of the district. Centralized prov- inces spend more at the provincial level com- pared to those that have been decentralized. However, the extra funding that reaches the districts in decentralized provinces results in higher spending at the district level and is not associated with greater funding to schools. These findings are summarized in figure 4, where K per pupil funding is plotted at each level of the administrative hierarchy. The amount that finally reaches the school is much less than the total amount available in the system and this decline is the sharpest in Eastern province. Moreover, a large fraction of the difference in funds arises from the nature of the rule-based component of funding. Hence, disbursement curves in the decentralized dis- tricts are consistently below those in the centralized district as a direct consequence of the rule-based com- ponent, in conjunction with the difference in average school enrollment between the provinces discussed previously. Already the results of the tracking exercise pro- vide suggestive evidence regarding the leakage of funds. In particular, the correspondence between the funding received by schools and the amount of the fixed-school grant indicate that almost all rule-based funds are passed on, while little of the available dis- cretionary funding actually reach the schools. In the next section we explicitly address this issue for both the nonsalary funding discussed in this section, as well as payroll funds that do not pass through the administrative hierarchy. NOTES 19. Recall that the payroll is centralized and payments are made directly to teachers from the center. Thus there is no notion of money being distributed from provinces onward. Of course, the important question of whether teachers receive their salaries remains, and is taken up in section 5. 20. An alternative measure could rely on per-child funds. This measure would have the attractive property that differential dropout rates would not affect the over- all funding statistic. Ideally we would like to report both, Figure 4. Funding Disbursement in Centralized and Decentralized Provinces Centralized Provinces Funds at administrative level Decentralized Provinces 0 Funds at administrative level 10000 20000 30000 40000 50000 Total Province District Schools (LB) Schools (UB) Funding(Kperpupil) 10000 20000 30000 40000 50000 Total Province District Schools (LB) Schools (UB) Funding(Kperpupil) Lusaka Province Copperbelt Northern Province Eastern Province Centralized Provinces Funds at administrative level Decentralized Provinces 0 Funds at administrative level 10000 20000 30000 40000 50000 Total Province District Schools (LB) Schools (UB) Funding(Kperpupil) 10000 20000 30000 40000 50000 Total Province District Schools (LB) Schools (UB) Funding(Kperpupil) Lusaka Province Copperbelt Northern Province Eastern Province
  • 36. 36 • AFRICA REGION HUMAN DEVELOPMENT WORKING PAPER SERIES but there are two problems. The first is that the popu- lation census is not currently available. The second and more serious problem is that to report this statistic at the school level one would have to define a catchment area, which is often arbitrary, especially for urban schools. Without a clearly defined catchment, it is un- clear that this concept would be useful at the level of the individual school. 21. The enrollment figures include all districts for which data are available. In the calculation of the financial figures per pupil, two districts were dropped because of incomplete financial data, Nakonde in Northern Province and Chongwe in Lusaka Province. Recall also that these are all nonsalary transfers. 22. One option could be that this low amount is linked to low cash receipts from January to June. According to the timing of funds, most funding reaches provinces from September to November and could thus have already been disbursed by January. 23. Aspects of the tracking exercise to keep in mind include two crucial points. First, the fixed grant is directly passed on from the Ministry of Education to the districts and thus enters the system only at the district level. Sec- ond, in decentralized provinces discretionary resources for recurrent expenditure flow directly to the districts, without passing through the provinces. 24. The nature of the data available still implies the need for some assumptions to interpret the results. For example, recall periods for funds received are a full year, but for resources passed on the only workable recall was the preceding half-year. For spending at the province or district level, a one-month recall period was used. The pilot study revealed that these recall periods provide the most accurate information.