More Related Content
Similar to Washington State Bridge Profile
Similar to Washington State Bridge Profile (16)
Washington State Bridge Profile
- 1. © 2014 The American Road & Transportation Builders Association (ARTBA). All rights reserved. No part of this document may be reproduced or
transmitted in any form or by any means, electronic, mechanical, photocopying, recording, or otherwise, without prior written permission of
ARTBA.
Highlights from FHWA’s 2013 National Bridge Inventory Data:
Of the 7,902 bridges in the state, 372 bridges, or 5% are classified as structurally deficient. This
means one or more of the key bridge elements, such as the deck, superstructure or
substructure, is considered to be in “poor” or worse condition.1
There are 1,694 bridges, or 21% of all state bridges, classified as functionally obsolete. This
means the bridge does not meet design standards that are in line with current practice.
Federal-aid investment in Washington has supported $3.7 billion in bridge construction
spending on 1,512 bridges between 2003 and 2012, according to FHWA data.2
Since 2004, 703 new bridges have been constructed in the state and 138 bridges have
undergone major reconstruction.
The state estimates that it would cost approximately $55.6 billion to fix a total of 5,741 bridges
in the state.3
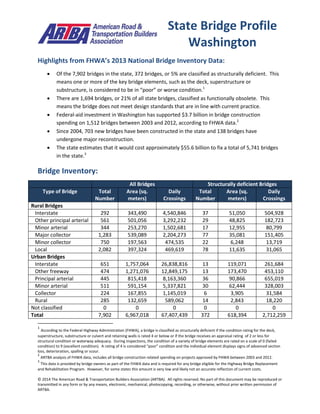
Bridge Inventory:
All Bridges Structurally deficient Bridges
Type of Bridge Total
Number
Area (sq.
meters)
Daily
Crossings
Total
Number
Area (sq.
meters)
Daily
Crossings
Rural Bridges
Interstate 292 343,490 4,540,846 37 51,050 504,928
Other principal arterial 561 501,056 3,292,232 29 48,825 182,723
Minor arterial 344 253,270 1,502,681 17 12,955 80,799
Major collector 1,283 539,089 2,204,273 77 35,081 151,405
Minor collector 750 197,563 474,535 22 6,248 13,719
Local 2,082 397,324 469,619 78 11,635 31,065
Urban Bridges
Interstate 651 1,757,064 26,838,816 13 119,071 261,684
Other freeway 474 1,271,076 12,849,175 13 173,470 453,110
Principal arterial 445 815,418 8,163,360 36 90,866 655,019
Minor arterial 511 591,154 5,337,821 30 62,444 328,003
Collector 224 167,855 1,145,019 6 3,905 31,584
Local 285 132,659 589,062 14 2,843 18,220
Not classified 0 0 0 0 0 0
Total 7,902 6,967,018 67,407,439 372 618,394 2,712,259
1
According to the Federal Highway Administration (FHWA), a bridge is classified as structurally deficient if the condition rating for the deck,
superstructure, substructure or culvert and retaining walls is rated 4 or below or if the bridge receives an appraisal rating of 2 or less for
structural condition or waterway adequacy. During inspections, the condition of a variety of bridge elements are rated on a scale of 0 (failed
condition) to 9 (excellent condition). A rating of 4 is considered “poor” condition and the individual element displays signs of advanced section
loss, deterioration, spalling or scour.
2
ARTBA analysis of FHWA data, includes all bridge construction related spending on projects approved by FHWA between 2003 and 2012.
3
This data is provided by bridge owners as part of the FHWA data and is required for any bridge eligible for the Highway Bridge Replacement
and Rehabilitation Program. However, for some states this amount is very low and likely not an accurate reflection of current costs.
State Bridge Profile
Washington
- 2. © 2014 The American Road & Transportation Builders Association (ARTBA). All rights reserved. No part of this document may be reproduced or
transmitted in any form or by any means, electronic, mechanical, photocopying, recording, or otherwise, without prior written permission of
ARTBA.
Proposed bridge work:
Type of Work Number Cost (millions) Daily Crossings Area (sq. meters)
Bridge replacement 681 $376.4 2,500,772 301,755
Widening & rehabilitation 39 $130.2 358,534 36,540
Rehabilitation 3,399 $54,781.0 58,134,225 5,342,923
Deck rehabilitation/replacement 25 $3.5 109,836 18,805
Other work 1,597 $287.9 2,431,449 505,680
Top 10 Most Traveled Structurally Deficient Bridges in the State
County Year
Built
Daily
Crossings
Type of Bridge Location
(route/water under the bridge, traffic on the bridge and location)
King 1963 97,870 Urban
freeway/expressway
LAKE WASHINGTON, SR 520, 1.5 E JCT SR 513
King 1941 95,044 Urban
freeway/expressway
E MARGINAL WY 1ST 4TH, S SPOKANE ST, S Spokane St & E
Marginal
King 1959 57,671 Urban other
principal arterial
15TH AVE W, W EMERSON ST, W Emerson St /15th Ave W
King 1940 57,428 Urban Interstate LAKE WASHINGTON, I-90, 1.9 E JCT I-5
King 1989 57,428 Urban Interstate LAKE WASHINGTON, W.B. & REV I-90, 2.6 E JCT I-5
King 1959 46,093 Urban
freeway/expressway
SPOKANE ST, SR 99, 2.1 N JCT SR 509
Snohomish 1933 39,733 Rural Interstate STILLAGUAMISH RIVER, I-5, 0.7 N JCT SR 530
King 1952 38,279 Urban
freeway/expressway
CITY STREETS & RAILROAD, SR 99, 3.3 N JCT SR 509
King 1970 36,469 Urban other
principal arterial
I-90, SR 900, 9.5 E JCT I-405
King 1952 36,440 Urban
freeway/expressway
CITY STREETS & RAILROAD, SR 99, 3.3 N JCT SR 509
Sources: All data is from the 2013 National Bridge Inventory, released by the Federal Highway Administration in March 2014.
Note that specific conditions on bridge may have changed as a result of recent work. Cost estimates of bridge work provided as
part of the data and have been adjusted to 2013$ for inflation and estimated project costs. Contract awards data is for state
and local government awards and comes from McGraw Hill. Note that additional bridge investment may be a part of other
contract awards if a smaller bridge project is included with a highway project, and that would not be accounted for in the total
in this profile.