
Recomendados
Recomendados
Mais conteúdo relacionado
Destaque
Destaque (20)
Semelhante a Assessment HEI 2005
Semelhante a Assessment HEI 2005 (20)
Mais de arraweb
Mais de arraweb (20)
Assessment HEI 2005
- 1. Report Assessment of public universities and their faculties (2005) (c) ARRA, Bratislava 2005 1
- 2. The report includes results of the project „Quality assessment of research and development at the universities and institutes of Slovak Academy of Sciences in Bratislava Region“, financed by European Social Fund. This report originated also with financial aid of the following organizations: www.pss.sk www.luba.sk www.orange.sk www.worldbank.sk www.yhman.sk www.hp.sk Medial partner of ARRA is: www.trend.sk
- 3. The authors of this report would like to thank the members of the Board of Trustees of ARRA, the Board of Advisors of ARRA, in particular prof. Brunovský, prof. Šucha, prof. Štich (the chairperson of the Board of Advisors), doc. Ferák, prof. Šlachta and others, and also Ing. M. Beblavý, the members of the Board of Trustees (in particular the chairperson Ing. J. Kollár) for their critical but always relevant comments, and also for frequent discussions, analyses and reviews of draft material in the production of the report. One of the factors that enabled ARRA to produce the following analysis was the fact that the SR Ministry of Education publishes a great deal of material and information about higher education. We would like to thank doc. RNDr. Peter Mederly, CSc. for his valuable discussion of this material. Conversations with Don Thornhill and Lewis Purser, experts that the World Bank arranged for ARRA, made a significant contribution to developing the criteria and the methodology used in the report, and they also deserve our thanks. We would like to point out, however, that the opinions presented in the following report are not necessarily identical with those of the persons named here. The ARRA Agency was able to carry out its activities thanks to contributions from its sponsors, in particular Prvá stavebná sporiteľňa, Orange Slovensko, Ľudová Banka, the World Bank, HP and others. The assessment of the work of the Bratislava faculties of universities was supported by a grant from the European Social Fund. 2
- 4. Introduction When officials started to assess research in higher education in Great Britain in 1980 (the Research Selectivity Exercise [RSE], later the Research Assessment Exercise [RAE]), their aim was not only to increase universities' accountability to the general public for their activities but also to map their scientific activity and compare it with that of foreign institutions. It is noteworthy that although this process that was initially greeted with a degree of mistrust and resistance (like every reform) by the academic community in particular, not only did it bring about an increase in the number of relevant scientific publications and citations1, but in 2000, when the most recent assessment took place, 55% of higher education workplaces were ranked in the highest category of assessment. One of the factors in the success of the British system was that the results of assessment were and are directly linked to the financing of higher education2. This experience shows that the assessment of quality is an instrument for achieving goals and not a goal in and of itself. In addition, in other countries as well as Great Britain there is an independent system for the evaluation of universities, which determines their ranking according to predetermined criteria. In Slovakia there is as yet no functioning system of this sort. There has been no institution or organisation (either state or non-state) that would systematically address the evaluation of research and educational performance in higher education according to clear criteria set in advance that the general public can understand, drawing on information that is in the public domain or which can be easily obtained (e.g. using Act no. 211/2000 Coll. on free access to information). This is not a role carried out even by the Accreditation Commission, the government's advisory body. The Accreditation Commission has different tasks and objectives3. At present, although the SR Ministry of Education is trying to introduce RAE-like procedures in the complex system for accrediting universities, this is taking a relatively long time to be put into practice and make an impact. This system may also seem a little ponderous to the general public, as it is planned to carry it out in 1 The Times Higher Education Supplement (THES), 1 July 2005, p. 4. 2 Adams J., Science 296, May 2002, p. 805. 3 Section 81 and following of Act no. 131/2002 Coll. on Higher Education and changes and additions to certain acts. 3
- 5. six-year cycles. This means that in our fast changing world the information used in a given evaluation may not necessarily reflect the current situation in the higher education market. In Slovakia as in other countries, there is increasing pressure to enable the general public (including prospective university students, their parents and employers) and even the government and parliament to gain fast and easy access to a comprehensible overview of selected indicators that characterise or describe the quality of universities and/or their faculties. This pressure has increased sharply since the government tried to introduce financial cooperation by students in their education (tuition fees) as part of their reform package. This pressure also led to the creation of the civil association the Academic Ranking and Rating Agency (ARRA; www.arra.sk) at the end of 2004, although the idea of it has been forming for a number of years. It is not surprise that it was founded by former student leaders from the 1996 – 2002 period, who gained their own experience of study not only in Slovak higher education, but also abroad. This allowed them to compare the quality of tuition at home and abroad and to see that Slovak higher education is really in need of change. It needs it above all to enable its institutions to compete in an open European market against universities, which are already actively recruiting our students (e.g. branches of foreign universities but also Czech and Austrian universities). 4
- 6. 1. ARRA – independent evaluation of universities The Academic Ranking and Rating Agency (ARRA) is the first independent Slovak institution to decide to provide the public with regular reports on the quality of individual universities in Slovakia and information comparing them with each other. ARRA provides this information by fulfilling its objectives and abiding by quality evaluation procedures agreed in advance. The objectives of the ARRA civil association include: • providing the public with information on the quality of individual universities in Slovakia, • introducing a method of assessing the quality of education provided by universities in Slovakia, • creating an independent evaluation of the quality of education provided in individual study programs and fields of study in universities in Slovakia, • regularly ranking universities, the affiliated faculties and sections by the quality of the education the provide and the quality of their research and development ("ranking"), • assigning universities a rating based on the level of quality of their individual activities, • attempting to stimulate competition between individual universities and their faculties. The role of the agency is not to replace the duties and tasks of the SR government Accreditation Commission. The procedure that ARRA has used in assessing public universities (when talking about Slovak universities from now on, only public institutions will be referred to) in Slovakia in 2004, was based on the following steps: • the selection of indicators for the quality of education and research in individual universities and the assignment of a certain number of points to each faculty for the performance in this or that indicator (indicators are arranged into groups and each group of indicators gained a certain number of points), 5
- 7. • the division of faculties into six groups according to the so-called Frascati Manual (details given below) in order to compare only faculties that have the same orientation and similar working conditions, • assigning points scores to faculties (the ranking of faculties in individual groups according to the Frascati Manual is based on average points score in individual groups of indicators), • the calculation of the points score for universities (universities are ranked according to the average points gained by their faculties). The criteria (or indictors) by which ARRA produced its ranking focus on the intensity of "performance" and not on overall performance. For example, one of the criteria is the total number of publications by the given faculty listed in the Web of Knowledge database produced by the company Thomson Scientific Co. divided by the number of creative workers in the faculty (teachers and researchers). If the number of creative workers did not divide the overall number of publications, the size of the faculty would be the main influence and not the intensity of its work. The selection of criteria was also influenced by the fact that ARRA used only information in the public domain and did not, at least in its 2004 evaluations, request information from individual faculties. ARRA views the assessment of the performance of universities and faculties for 2004 as a pilot project. ARRA's results for 2004 will be analyzed in detail and this analysis will be used to prepare the assessment of public universities in future years. The ranking produced for the assessed institutions is drawn from incontrovertible official data and domestic and foreign sources in the public domain. Since 1 May 2004, Slovak universities are part of the EU higher education area and this has brought with it not only rights but also obligations, including the obligation to maintain and increase the quality of all their activities. Slovakia fully accepts the much-cited Bologna Process, which aims, amongst other things, to increase the competitiveness of European higher education in comparison with other parts of the world and has even incorporated it into its legislative system4. Quality higher education is the key to building a knowledge economy in Slovakia and will bring about the necessary structural changes in the country's economy over the 4 Act no. 131/2002 Coll. on Higher Education and changes and additions to certain acts. 6
- 8. medium term. To this end, universities need to ensure balanced quality in their educational and research activities. We are convinced that full use should be made of any instruments that can contribute to the achievement of the objectives for the increased quality of Slovak universities so that Slovak universities keep up with the national and international competition and attract students from both Slovakia and abroad. 7
- 9. 2. The history and role of ranking and experience of it in other countries The history of ranking is not a very long one. The first institutions to be ranked were a selection of American colleges in the magazine U.S. News & World Report in 1983. The phenomenon grew rapidly however, and not only in the Anglo- Saxon countries (e.g. in Great Britain in the Times Higher Education Supplement, the Times Good University Guide, Guardian, Financial Times etc., in Canada McLean's), but also in other parts of the world (in Germany Stern, Spiegel and DAAD, in Japan Asiaweek [until 2001], Asahi Shimbun, in Poland Wprost, Perspektywy, Polityka, in Switzerland Swisup!, in China the Higher Education Institute of Shanghai Jiao Tong University among others). There is quite a good overview of the sources on ranking on the Internet5, where one can also find very specific evaluations e.g. for law faculties or institutions providing education in economics or MBA degrees (Master of Business Administration). In fact, even in Slovakia we have noticed attempts by some media to produce such an evaluation (SME, Hospodárske Noviny, TREND, .týždeň, Národná obroda, Pravda, TA3, Slovenský rozhlas, STV...), although these have been incomplete and focused on only a part of the problem. The basic and common characteristic of all foreign approaches is that they attempt to provide information to the general public, in particular to prospective students, in order to help them select a suitable school or faculty and/or area of study or study program. Ranking is not in principle an activity carried out for its own sake to put universities into "some sort of" order (although such evaluations are also published) but ranking is or tries to be an aid for people who are choosing a place to study and need orientation in the education marketplace. No ranking system can automatically identify the best faculty or university for an applicant but the information provided can be of great assistance in their decision-making. Research has shown that at present that the position of a school in this or that ladder is a secondary factor in their choice of where to study. The main factor is whether the given faculty or university will enable them to study the area of study or study program that they are interested in. It is only after that – if there are a number of providers – that they start to consider other criteria such as the availability of 5 http://ed.sjtu.edu.cn/rank/2004/Resources.htm 8
- 10. accommodation, the costs associated with study, the attractiveness of the place of study, the options for sports, cultural and other activities and also the standing of the faculty or the university among other institutions. In addition to providing information to the public and prospective students, assessments of quality aim to increase competition among universities through their output so that – as in the world's advanced economies – prospective students are guided not only by the geographical proximity of a university but also the quality of the education that it provides. We expect that the importance of quality factors will increase hand in hand with the complexity and the technical and intellectual demands of the Slovak economy. The second common characteristic of assessments is that although they use different numbers of criteria, there is nearly always a relatively small number of groups of criteria that reflect the institution's performance in research and education and related parameters, perspectives on the institution from within (students and the academic community) and also from outside (e.g. employers, or even the school's own graduates). Another very important characteristic of ranking is that every such assessment must always be looked at in terms of the criteria that it uses. In other words, every ranking corresponds only to the criteria that are chosen and used. In addition every compiler (but also every reader) may consider (and then also makes) certain indicators significantly more important than others (e.g. research performance is given a higher value than, say, the number of students per teacher) and may therefore give them a different weighting, which can in turn make a fundamental difference in the ranking of the faculties and universities in "his or her" resulting table. For this reason ranking provides an image of the university and its status alongside other universities entirely in terms of the selected indicators. For this reason also, everyone involved in creating ranking tries to choose a range of criteria and indicators that will be relevant to the broadest possible group of recipients. A number of universities insist that this form of comparison has limited significance because every university is unique and special in some way, or has its own specific characteristics. We can agree with the claims of uniqueness to some extent. However, if there are, for example, 4 faculties of law, 5 faculties of philosophy or 3 faculties of medicine, providing the same degree for the same form 9
- 11. of higher education, it seems natural that we should ask which of them is the best in their group. This issue has given rise to other common arguments against ranking, that it is not possible to compare the incomparable, such as universities with 13 different faculties and a highly focused institution which is not even divided into faculties. This objection is acceptable. There is, however, a reasonable solution to this problem. Since 1963, the OECD countries (the Organization for Economic Cooperation and Development) have categorized systems of subjects in science and technology according to the Frascati Manual6, whose current version dating from 20027 divides such subjects into 6 groups: a) natural sciences, b) engineering and technology, c) medical sciences, d) agricultural sciences, e) social sciences, f) humanities. From 1 June 2005 this division will be included in Slovak law8, i.e. also in the Slovak research community.9 After the introduction of such a division into the ranking, it is clear that theological faculties will not be compared with medical faculties or technically oriented faculties with social science faculties. It will be possible to compare faculties with the same scientific orientation side by side. Prospective students will thus be able to determine which is the best faculty providing education in their area of interest. The quality of a university is also determined by the quality of its faculties (apart from the University of Veterinary Medicine and the Academy of Fine Arts, which have no faculties and are therefore assessed as a whole). It is therefore quite natural that the final ranking of universities depends on the quality of its 6 The authorship of this manual is quite often attributed incorrectly. Because the first meeting of OECD experts in this matter took place in 1963 in the Italian village of Frascati, the work that was created there was called the Manual from Frascati or The Frascati Manual. 7 Frascati Manual, 6th Edition, OECD 2002, Paris, p. 67. 8 Act no. 172/2005 Coll. on the organisation of state support for research and development and additions to Act no. 575/2001 Coll. on the organisation of government activities and the organisation of the central state administration as amended. 9 A more detailed breakdown is given in the International Standard Classification of Education (ISCED) 1997, UNESCO, November 1997. 10
- 12. components. Another reason for the use of faculties as the basic unit for ranking is the fact that there is practically no university covering all fields of study in Slovakia. When assessing such universities it can also happen that the final result will be a certain weighted average of the quality of individual components of the university and that the weighting of the excellent faculties may not be enough to balance the weaker ones, or vice versa, the quality of the excellent faculties may cover for the weaker ones. Precisely for the reason the ranking of universities is carried out at the end, to make clear their strengths and weaknesses. It is up to the university itself whether to take measures to increase the quality of its components, so that the better faculties do not suffer because of the weaker ones. That such a system is able to function successfully is shown by the example of Great Britain and its RAE system. In the final analysis, it is up to prospective students to decide, just as employers must decide when employing graduates. And it is always better if decisions are taken on the basis of accessible and verified data rather than traditional, often inaccurate and incomplete information or rather feelings associated with to this or that institution. An essential public requirement is also an answer to the question as to what use universities make of their public funding and how effectively they manage them. For example, for 2003, the National Council of the Slovak Republic approved subsidies for public funds to public universities amounting to SKK 8.3 billion, for 2004 SKK 9.4 billion and an extra billion for 2005 This means that in three years universities spent at least SKK 28.1 billion from public funds. The proposed state budget for 2006 allocates SKK 11.6 billion to public higher education. It is reasonable to ask what quality students, graduates and society as a whole gets from this money, i.e. whether and to what extent these funds really improve this segment of the research and education process for which they were originally intended. 11
- 13. 3. Classification of faculties ARRA's approach in assessing Slovak universities is the same as is used elsewhere in the world and is based on a number of pillars. The first is quantitative information in the public domain, which is generally accepted as a reliable indicator of academic quality. The second is an independent viewpoint and results. The third is a group (cluster) approach to the assessment of faculties and universities. The faculties of Slovak universities were divided into groups based on their field of study using the definitions given in the Frascati Manual as follows: • natural sciences (NAT) consisting of mathematics and computer sciences, physical sciences, chemical sciences, biological sciences and Earth and related environmental sciences • engineering and technology (TECH) consisting of civil engineering, electrical engineering, mechanical engineering and other engineering and technological sciences, • medical sciences (MED) including basic medicine and dentistry, clinical medicine and pharmaceutical sciences (nursing and healthcare are included in the social sciences), • agricultural sciences (AGRO) consisting of agriculture, forestry, fisheries, veterinary medicine and allied subjects, • social sciences (SOC) including psychology, economics, educational sciences, law, political science, nursing, healthcare, other social sciences. • humanities (HUM) are history, languages and literature and other humanities. Some higher education faculties are hard to categorize into a particular subject area due to the diversity of their components (e.g. departments), which carry out activities lying in multiple subject areas. An example is the faculties of philosophy, whose activities cover the areas of both the humanities and the social sciences. They were classified according to the subject area into which the majority of activities fall. If the dean of a particular faculty contacts us to request that the faculty that he or she manages should be classified in a different subject area, ARRA considers the request. 12
- 14. Table1: Classification of faculties (or universities) into subject areas according to ARRA10 University Group Faculty Abbreviation Akadémia umení (Academy of Arts) AU Banská Bystrica HUM Fakulta dramatických umení DramUm AU www.aku.sk (Faculty of Dramatic Arts) HUM Fakulta muzických umení MuzUm AU (Faculty of Performing Arts) HUM Fakulta výtvarných umení VýtvarUm AU (Faculty of Fine Arts and Design) Ekonomická univerzita (University of Economics) EU BA Bratislava SOC Fakulta hospodárskej informatiky HospInfo EU BA www.euba.sk (Faculty of Economic Informatics) SOC Fakulta medzinárodných vzťahov MedzVzťah EU BA (Faculty of International Relations) SOC Fakulta podnikového manažmentu PodnMan EU BA (Faculty of Business Management) SOC Národohospodárska fakulta NárHosp EU BA (Faculty of National Economy) SOC Obchodná fakulta Obchod EU BA (Faculty of Commerce) SOC Podnikovohospodárska fakulta PodnHosp EU BA (Faculty of Business Economics) Katolícka univerzita (Catholic University) KU Ružomberok HUM Filozofická fakulta Fil KU www.ku.sk (Faculty of Philosophy) SOC Pedagogická fakulta Pedag KU (Pedagogical Faculty) HUM Teologická fakulta Teol KU (Faculty of Theology) Prešovská univerzita (University of Prešov) PU Prešov HUM Fakulta humanitných a prírodných vied HumPrír PU www.unipo.sk (Faculty of the Humanities and Natural Sciences) SOC Fakulta manažmentu Manag PU (Faculty of Management) SOC Fakulta športu TV PU (Faculty of Sports) SOC Fakulta zdravotníctva Zdravotnícka PU (Faculty of Health Care) HUM Filozofická fakulta Fil PU (Faculty of Arts) HUM Gréckokatolícka bohoslovecká Greckokat PU (Greek Catholic Theological Faculty) SOC Pedagogická fakulta Pedag PU (Faculty of Education) HUM Pravoslávna bohoslovecká fakulta Pravosl PU (Orthodox Theological Faculty) Slovenská poľnohospodárska univerzita (Slovak University of Agriculture) SPU Nitra AGRO Fakulta agrobiol. potr.zdr. Agro SPU www.uniag.sk (Faculty of Agrobiology and Food Resources) AGRO Fakulta biotechnológie a potravinárstva BiotPotr SPU (Faculty of Biotechnology and Food Sciences) SOC Fakulta ekonomiky a manažmentu EkonomMan. SPU (Faculty of Economics and Management) SOC Fakulta európskych štúdií Eur.ŠT. SPU (Faculty of European Studies and Regional Development) AGRO Fakulta záhradníctva a krajinného inžinierstva Záhrad SPU (Faculty of Horticulture and Landscape Engineering) TECH Mechanizačná fakulta Mech SPU (Faculty of Agricultural Engineering) 13
- 15. University Group Faculty Abbreviation Slovenská technická univerzita (Slovak University of Technology) STUBA Bratislava TECH Fakulta architektúry Archit STUBA www.stuba.sk (Faculty of Architecture) TECH Fakulta elektrotechniky a informatiky Elektr STUBA (Faculty of Electrical Engineering and Information Technology) TECH Fakulta chemickej a potravinárskej technológie ChemTechn STUBA (Faculty of Chemical and Food Technology) NAT Fakulta informatiky a informačných technológií Infor.aInf.Tech. STUBA (Faculty of Informatics and Information Technologies) TECH Materiálovotechnologická fakulta MatTechn STUBA (Faculty of Material Sciences and Technology) TECH Stavebná fakulta Stav STUBA (Faculty of Civil Engineering) TECH Strojnícka fakulta Stroj STUBA (Faculty of Mechanical Engineering) Technická univerzita Košice (Technical University of Košice) TUKE Košice SOC Ekonomická fakulta Ekonom TUKE www.tuke.sk (Faculty of Economics) TECH Fakulta BERG Ban TUKE (Faculty of Mining, Ecology, Process Control and Geotechnology) TECH Fakulta elektrotechniky a informatiky Elektr TUKE (Faculty of Electrical Engineering and Informatics) HUM Fakulta umení Umení TUKE (Faculty of Arts) TECH Fakulta výrobných technológií VýrTech TUKE (Faculty Manufacturing Technologies) TECH Hutnícka fakulta Hutn TUKE (Faculty of Metallurgy) TECH Stavebná fakulta Stav TUKE (Faculty of Civil Engineering) TECH Strojnícka fakulta Stroj TUKE (Faculty of Mechanical Engineering) Technická univerzita Zvolen (Technical University in Zvolen) TUZV Zvolen AGRO Drevárska fakulta Drev TUZV www.tuzvo.sk (Faculty of Wood Sciences and Technology) NAT Fakulta ekológie a environmentalistiky Ekolenv TUZ (Faculty of Ecology and Environmental Sciences) TECH Fakulta environmentálnej a výrobnej techniky EnvirTech TUZV (Faculty of Environmental and Manufacturing Technology) AGRO Lesnícka fakulta Les TUZV (Faculty of Forestry) Trenčianska univerzita A. Dubčeka (Alexander Dubček University in Trenčín) TUAD Trenčín TECH Fakulta mechatroniky MechTron TUAD www.tnuni.sk (Faculty of Mechatronics) TECH Fakulta priemyselných technológií PriemTechn TUAD (Faculty of Industrial Technologies) SOC Fakulta sociálno-ekonomických vzťahov SocEkon TUAD (Faculty of Social and Economic Relations) TECH Fakulta špeciálnej techniky ŠpecTechn TUAD (Faculty of Special Technology) Trnavská univerzita (University of Trnava) TVU Trnava SOC Fakulta zdravotníctva a sociálnej práce ZdravSoc TVU www.truni.sk (Faculty of Health Care and Social Work) HUM Filozofická fakulta Fil TVU (Faculty of Arts) SOC Pedagogická fakulta Pedag TVU (Faculty of Education) SOC Právnicka fakulta Práv TVU (Faculty of Law) HUM Teologická fakulta Teol TVU (Faculty of Theology) 14
- 16. University Group Faculty Abbreviation Univerzita Komenského (Comenius University) UK Bratislava HUM Evanjelická bohoslovecká fakulta Evanj UK www.uniba.sk (Evangelical Theological Faculty) SOC Fakulta managementu Manag UK (Faculty of Management) NAT Fakulta matematiky, fyziky a informatiky FMFI UK (Faculty of Mathematics, Physics and Informatics) SOC Fakulta sociálnych a ekonomických vied SocEkon UK (Faculty of Social and Economic Sciences) SOC Fakulta telesnej výchovy a športu TV UK (Faculty of Physical Education and Sports) MED Farmaceutická fakulta Farm UK (Faculty of Pharmacy) HUM Filozofická fakulta Fil UK (Faculty of Arts) MED Jesseniova lekárska fakulta JessenLek UK (Jessenius Faculty of Medicine) MED Lekárska fakulta Lek UK (Faculty of Medicine) SOC Pedagogická fakulta Pedag UK (Faculty of Education) SOC Právnicka fakulta Práv UK (Faculty of Law) NAT Prírodovedecká fakulta Prír UK (Faculty of Natural Sciences) HUM Rímskokatolícka cyrilomet. bohoslovecká fakulta RímsKat UK (Roman Catholic Theological Faculty of Cyril and Methodius) Univerzita Konštantína Filozofa (Constantine the Philosopher University) UKF Nitra NAT Fakulta prírodných vied Prír UKF www.ukf.sk (Faculty of Natural Sciences) SOC Fakulta sociálnych vied Soc UKF (Faculty of Social Sciences and Health) SOC Fakulta stredoeurópskych štúdií Stredoeur.Št. UKF (Faculty of Central European Studies) HUM Filozofická fakulta Fil UKF (Faculty of Arts) SOC Pedagogická fakulta Pedag UKF (Faculty of Education) Univerzita Mateja Bela (Matej Bel University) UMB Banská Bystrica SOC Ekonomická fakulta Ekonom UMB www.umb.sk (Faculty of Economics) SOC Fakulta financií Finan UMB (Faculty of Finances) HUM Fakulta humanitných vied Hum UMB (Faculty of the Humanities) SOC Fakulta politických vied a medzinár. vzťahov Polit UMB (Faculty of Political Sciences and International Relations) NAT Fakulta prírodných vied Prír UMB (Faculty of Natural Sciences) HUM Filologická fakulta Filolo UMB (Faculty of Philology) SOC Pedagogická fakulta Pedag UMB (Faculty of Education) SOC Právnicka fakulta Práv UMB (Faculty of Law) Univerzita Pavla Jozefa Šafárika (Pavol Jozef Šafárik University) UPJŠ Košice SOC Fakulta verejnej správy VerSpr UPJŠ www.upjs.sk (Faculty of Public Administration) MED Lekárska fakulta Lek UPJŠ (Faculty of Medicine) SOC Právnicka fakulta Práv UPJŠ (Faculty of Law) NAT Prírodovedecká fakulta Prír UPJŠ (Faculty of Natural Sciences) 15
- 17. University Group Faculty Abbreviation Univerzita sv. Cyrila a Metoda (University of St. Cyril and Methodius) UCM Trnava SOC Fakulta masmed.kom. MasMed UCM www.ucm.sk (Faculty of Mass Media Communication) NAT Fakulta prírodných vied Prír UCM (Faculty of Natural Sciences) HUM Filozofická fakulta Fil UCM (Faculty of Arts) Univerzita veterinárskeho lekárstva AGRO Košice UVL (University of Veterinary Medicine) www.uvm.sk Vysoká škola múzických umení (Academy of Music and Dramatic Arts) VŠMU Bratislava HUM Divadelná fakulta Divadelná VŠMU www.vsmu.sk (Faculty of Theatre Arts) HUM Filmová a televízna fakulta FilmTel VŠMU (Faculty of Film and Television) HUM Hudobná a tanečná fakulta HudTan VŠMU (Faculty of Music and Dance) Vysoká škola výtvarných umení HUM Bratislava VŠVU (Academy of Fine Arts and Design) www.vsvu.sk Žilinská univerzita (University of Žilina) ŽU Žilina TECH Elektrotechnická fakulta Elektr ŽU www.utc.sk (Faculty of Electrical Engineering) SOC Fakulta PEDAS Pedas ŽU (Faculty of Operation and Economics of Transport and Communications) NAT Fakulta prírodných vied Prír ŽU (Faculty of Natural Sciences) SOC Fakulta riadenia a informatiky Riadenia ŽU (Faculty of Management and Informatics) TECH Fakulta špeciálneho inžinierstva ŠpecInž ŽU (Faculty of Special Engineering) TECH Stavebná fakulta Stav ŽU (Faculty of Civil Engineering) TECH Strojnícka fakulta Stroj ŽU (Faculty of Mechanical Engineering) x 10 10 The stated list of public universities was composed according to Annex 1 of Act no. 131/2002 Coll. on higher education as amended, and the names of all universities were given alphabetically. The list of faculties was composed according to a report of the Ministry of Education to the SR National Council in July 2005. Some information was taken from material from the Centre for Equivalence of Diplomas in Bratislava. The ARRA list includes all public universities apart from the J. Selye University in Komarno, which has not completed the education cycle for even the first level of university education. The list of faculties does not include seminaries of the catholic faculty. In 2005 private universities operated in Slovakia in addition to the public universities (numbers in parentheses: full time students, part time students called external ones): - the Bratislava College of Law, BVŠP (167, 354), - St. Elizabeth's University of Health and Social Work, VŠZaSP (0, 1181), - College of Economics and Management of Public Administration, VŠEM (41, 463), - College of Management in Trenčin, VŠM (620, 131). Private universities are not, however, currently included in ARRA's assessments. The main reason is that nearly all private universities (apart from the College of Management in Trenčin) are relatively new and therefore in 2004 did not have any graduates. Data on them are also less accessible and incomplete. 16
- 18. 4. Quality criteria ARRA selected a number of criteria from those initially proposed and discussed with domestic and foreign experts, as shown in Table 2: Table 2: Criteria for assessing the quality of universities Criteria for assessing the quality of universities Category Num. Label Title Institution’s 1 ** RP1 Graduates’ quality (employers’ view) A reputation 2 RP2 Peer review 3 * VV1 Number of scientific publications in WoK database in 1995 – 2004 per number of creative workers (CW) 4 * VV2 Number of citations per CW according to the WoK database 5 * VV3 Number of scientific publications from VV1 with more than 5 citations per CW 6 * VV4 Number of PhD students in full time study (year 2004) in proportion to the number of professors and associate professors 7 * VV5 Average annual number of PhD graduates in 2002 - 2004 in proportion to the number of associate professors and professors Science and 8 * VV6 Number of PhD students in full time study in proportion to the total number of B research students studying full time in 2004 9 VV6a PhD studies’ success rate 10 * VV7 Combined grant funding from the VEGA and KEGA agencies per one creative worker in 2004 11 * VV8 Funding from AR (applied research), ISTC (international scientific and technical cooperation) and ASST (Agency for the Support of Science and Technology) grants per one creative worker 12 * VV9 Overall grant funding per one creative worker (2004) 13 VV10 Grant funding from the European Social Fund 14 SK1 Students with Internet access at the faculty 15 SK2 Students with Internet access at the dormitory 16 SK3 Number of students accommodated in a dormitory in proportion to overall number of dormitory applications Students’ 17 SK4 Number of students with scholarships granted by a university C comfort 18 SK5 Possibilities for sport and cultural life at the university 19 SK6 Number of subjects taught with literature accessible via Internet 20 SK7 Number of students attending the students survey on quality of education 21 SK8 How have the results of a students survey on quality of education manifested in quality and organisation of educational process? 22 * SV1 Number of students divided by the number of teachers 23 * SV2 Number of students divided by the number of professors and associate professors 24 * SV3 The ratio of teachers with a PhD to the total number of teachers 25 * SV4 The number of professors and associate professors divided by the number of all teachers 26 * SV5 Average age of professors holding a functional position (active professor) Study and D 27 ** SV6 Admissions proceedings: ratio of actual number of applications received to the education planned number 28 * SV7 Admissions proceedings: number of registered students in proportion to the number of offers 29 ** SV8 Number of students with foreign state citizenship divided by the total number of students studying full time 30 ** SV9 Number of university graduates unemployed for over 6 months 31 ** SV10 Students taking part in study abroad 32 * F1 Regular expenditure per one student E Financing 33 * F2 Success of the university's business activities 34 * F3 The proportion of grant funding to the university's budget for its main activities From the given list, data was available only for those criteria that are marked with one or with two stars. The criteria RP1, SV6, SV8, SV9 and SV10 are mentioned 17
- 19. in this report but they are not included in the final score for the universities. The reason why several of the approved criteria were not used is that the report is the result of a pilot project and not all the information was accessible at the time of assessment. In the case of some indicators the collection of data was still not complete or collection would require more time and be expensive. These include: - the results of student surveys, - the results of surveys among teachers in individual faculties, - information on the financing of individual faculties. In some cases the data for all schools are extremely low and therefore – to prevent the assessment from being too dependent on fluctuation in small numbers – they were not included in the scoring, although they are mentioned in the report (they are marked with two stars) Some data were available only for universities as a whole and not for individual faculties (in Table 2 they are highlighted in turquoise). These are included in the final assessment of the universities but not, however, of their faculties. Numbers for professors and associate professors refer to the number of chairs occupied in 2004. 18
- 20. 5. Basic characteristics of the indicators and their classification into groups The indicators that ARRA uses are classified in a number of materially compact groups. For purposes of clarity, this section lists the basic characteristics of the individual indicators and classifies them into groups. The names of the groups provide sufficient explanation of why a given indicator belongs in its group. A more detailed analysis of the indicators is given in Part 8, in which specific examples will be used to show how they affect the assessment.11 "Science and Research" Category "Publications and citations" Group VV1 Number of scientific articles12 in proportion to the number of creative workers (CW), i.e. teachers and researchers and artistic employees with higher education, in periodicals registered in the Thomson database for the years 1995 – 2004.13 VV2 Number of citations in proportion to the number of CW. Only citations of papers included in VV1 will be counted. Citations of papers published in or before 1994 will therefore not be included. The decisive factor is whether the given work appeared in the database as at 31 December 2004. VV3 The number of papers published in the years 1995 – 2004, for which more than 5 citations had been registered by 31 December 2004, divided by the number of CW in the faculty. "PhD Studies" Group VV4 The ratio of the number of PhD students in full time study to the number of professors and associate professors. As a rule, associate professors and professors 11 Unless stated otherwise, information given relates to 2004. 12 The terms publication and citation hereafter refer to publications from the stated database and citation in papers included in it. 13 http://www.thomson.com/scientific/scientific.jsp, Thanks to the SR Ministry of Education, all universities in Slovakia have access to this database as do the university's teachers and research and artistic employees, the Accreditation Commission, the SR Ministry of Education and the Slovak Academy of Sciences 19
- 21. supervise PhD students (and a small number of holders of scientific ranks IIa and I, about whom there is no information in the public domain) and this is one of the duties of their employment under the Higher Education Act no. 131/2002 Coll. VV5 The annual average number of PhD graduates in the period 2002 -2004 divided by the number of professors and associate professors in 2004. Since the number of graduates fluctuates from year to year, it has been necessary to expand the time scale for the collection of these data. As a baseline we took the minimum length of full time PhD study under applicable legislation, i.e. 3 years. VV6 The proportion of the number of PhD students in full time study to the total number of students studying full time in 2004. "Grant Success" Group VV7 Overall grant funding from the VEGA and KEGA agencies per creative worker. VV8 Funding from AR (applied research) ISTC (international scientific and technical cooperation) and ASST (agency for the support of science and technology) grants per creative worker. VV9 Total grant funding for each creative worker. "Study and Education" Category14 "Students and Teachers" Group SV1 The number of students in full and part time study divided by the number of teachers. Points are awarded so that the lower the number of students per teacher the higher the number of points. 14 Where students are referred to in this category of indicators, it refers to students in bachelors and masters programs studying both full and part time. The only exception is indicator SV10, which includes – where information is available – full time PhD students. Where it is not explicitly stated (e.g. financing), students are not recalculated according to the SR Ministry of Education formula. 20
- 22. SV2 The number of students studying full and part time divided by the number of teachers. Points are awarded in the same way as for indicator SV1. SV3 The proportion of teachers with PhD to the total number of teachers. It is assumed that every professor and associate professor in a functional position has a PhD. SV4 The ratio of teachers with a PhD to the total number of teachers. SV5 The average age of active professors. Points are awarded using the value of the formula 100/(average age of professors). The term active professor (associate professor) refers to any person who occupies the functional position of a professor or associate professor15. "Applications for study" Group SV6 Admissions proceedings: the number of applications submitted to the planned number to be admitted, i.e. the number of applications to study divided by the number of study places offered by the faculty. SV7 Admissions proceedings: number of registered students to the number of applicants accepted, i.e. the number of applicants registered divided by the number of places offered for study. SV8 Number of students with foreign state citizenship divided by the total number of students studying full time. "University Level Criteria" Group SV9 Number of graduates unemployed for longer than 6 months per 100 university graduates in 2004. 15 Act no. 131/2002 Coll. on higher education and changes and additions to certain acts. 21
- 23. SV10 Number of students taking part in study abroad through the Erasmus and Socrates programs and using SAIA grants, per 100 students of the university. "Financing" Category F1 Running costs expenditure from state funding for one student of the university. F2 The proportion of the result of the university's business activities to the overall costs of its main activities. This indicator reflects the proportion of its research and education expenditure that the institution is able to cover from its own business activities. F3 The proportion of funds from public grants (VEGA, KEGA, AP MŠ, APVT a MVTS) to the overall costs of its main activities. This indicator shows what part of its expenditure the institution is able to gain through the active efforts of its employees in free competition for public funds made available to support research and development. "Reputation" Category RP1 Quality of graduates (from the perspective of employers). The weekly magazine TREND cooperated with ARRA to carry out a survey of businesses belonging to the Association for the Development of Human Resources (a questionnaire sent to around 110 firms operation in Slovakia). The conclusions from the information gained are not included in the final score for the faculties and universities and will be published separately. 22
- 24. 6. Method for the assessment of faculties and universities The indicators listed in Chapter 5 have been selected to ensure that a higher score corresponds to higher performance. For example, one of the indicators is the number of students to one professor or associate professor. The higher this number is, the less likely it is that professors and associate professors can give individual attention to students. From the perspective of individual approach, which ARRA considers to be most beneficial for students, it is better if this indicator has a lower value. If, however, we consider its inverted value (the number of associate professors and professors for a hundred students), a higher level of performance in the faculty corresponds to a higher value of this indicator. The number of students includes both full and part time students. The degree awarded to a part time student is the same as the degree awarded to a full time student and the quality of education provided to both should be the same, so teachers should pay the same amount of attention to full and part time students. In most cases the number in the table is the same as the indicator. There are only three exceptions: • SV1 shows the number of teachers per hundred full and part time students, • SV2 shows the number of professors and associate professors per hundred full and part time students. • SV5 shows the number 100/(average age of active professors). The faculty that scored the highest in a particular indicator is assigned 100 points. The other faculties receive points by linear interpolation, with zero points being assigned to a zero value. Each faculty of each university is assessed in the group to which it was assigned in Chapter 4. The overall ranking of faculties in each group depends on the average points scores in the groups of indicators. The overall ranking of universities is based on the average points scores of their faculties. Details are given in later chapters. 23
- 25. Method for the assessment of faculties and universities An example for illustration purposes may be the indicator VV1 (number of publications per creative worker) and the faculty group AGRO (which covers a relatively small number of faculties). Table 3: Values of the VV1 indicator for faculties in the AGRO group Faculty Creative workers Published Ratio Points papers University of Veterinary Medicine 183 1077 5,89 100 Faculty of Forestry TUZV 83,8 187 2,23 38 Faculty of Biotechnology and Food Sciences SPU 54,7 90 1,65 28 Faculty of Agrobiology and Food Resources SPU 159,2 151 0,95 16 Faculty of Wood Sciences and Technology TUZV 123,9 62 0,50 9 Faculty of Horticult. and Landscape Engineering SPU 69,9 7 0,10 2 The first column contains the name of the faculty (for other faculties see the collected results), the second column contains the number of creative workers, the third column gives number of publications in the WoK database for 1995 – 2004. The next column has the number of publications for each creative worker followed by the number of points corresponding to this number in this group (calculated as the value in the fourth column divided by the highest value in the fourth column multiplied by a hundred and rounded to a whole number). The next step is to combine the values for indicators VV1, VV2 and VV3 into summary values for the "Publications and Citations" indicator group (see Table 4). Table 4: Assignment of scores for the "Publications and Citations" indicator group for faculties in the AGRO group Faculty VV1 VV2 VV3 Points University of Veterinary Medicine 100 100 100 100 Faculty of Forestry TUZV 26 38 36 33 Faculty of Biotechnology and Food Sciences SPU 31 28 19 26 Faculty of Agrobiology and Food Resources SPU 32 16 11 20 Faculty of Wood Sciences and Technology TUZV 19 9 4 11 Faculty of Horticult. and Landscape Engineering SPU 5 2 4 3 The first three columns show the number of points that each of the faculties gained in the "Publications and Citations" indicator group. The last column shows the number of points calculated as the average of all the indicators belonging to the group. The values in this column are transferred to the final assessment of the faculties in the group and the overall assessment of the universities. The method used to prepare the output value for universities is shown in Table 5. The Technical University in Zvolen is given as an example. 24
- 26. Table 5: Assessment of a university by individual areas and overall Faculty Teachers and Applications Publications PhD Grants Average University's Students for study and citations studies score Faculty of Forestry 82 87 33 62 73 67 Faculty of Wood Sciences and Technology 77 90 11 74 43 59 Faculty of Environmen. and Manufactur. Technology 70 71 1 51 84 55 Faculty of Ecology and Environmental Sciences 65 80 9 58 30 49 Technical University in Zvolen 57,6 The evaluations that each faculty received in the indicator groups are given in individual columns, with the names of the groups being given in the first row. For example, the number 33 in the row for the Faculty of Forestry and the column "Publications and Citations" is taken from Table 4. The results for all indicator groups are then summed and divided by the number of indicators (total/5). The resulting score for the whole university is the average score of its faculties. The overall evaluation of the universities also includes a sixth group of indicators (Financing, F1 – F3), in which data are available only for the university as a whole. In Table 5, the Faculties of Forestry and Wood Sciences and Technology have points from the AGRO Group (Table 4), the Faculty of Ecology and Environmental Sciences from the NAT group and the Faculty of Environmental and Manufacturing Technology from the TECH group. A few more notes need to be given on this scheme for the assessment of faculties and universities. - The most significant information is given in Table 3. This informs us the number of publications from the faculty for the 1995 – 2004 period. This number can be compared with foreign institutions or institutes of SAV (the Slovak Academy of Sciences) working in the same area. ARRA will carry out such a comparison in the near future. - The benchmark for faculties' success in a given indicator is the most successful Slovak faculty in the relevant group, not some comparison point from abroad, so it is necessary to compare the relevant data in the tables and not the point score. - It is necessary to bear in mind that the gradual aggregation of information (the creation of averages of averages as can be most clearly seen in the data for the university in Table 5) the information value of the ranking changes, becoming relative. - In the ideal scenario, the analysis would go even deeper and instead of faculties as a whole we would assess, and compare with each other and with foreign 25
- 27. groups, relatively homogenous groups within the faculty corresponding approximately to fields of studies. Such an analysis cannot currently be performed using data in the public domain. It is however ARRA's ambition for the future to assess also individual study programs in similar/related areas. 26
- 28. 7. Commentary on individual indicators16 Science and research "Publications and citations" Group17 VV1 Number of scientific publications and number of creative workers The scientific performance of individual faculties can be assessed in various ways Around the world, the most widely recognized approach is to use the number of publications, citations, major awards, ability to obtain research funding in open competition. The VV1 criterion is based on the number of publications calculated for one creative worker (CW) in the time period 1995 to 2004, i.e. 10 years. The term creative worker refers to all teachers and research and artistic employees of the faculty with higher education. A publication is any work that is recorded in the WoS database18 for the ten-year period 1995 – 2004. A work is included in the ARRA analysis if at least one of its authors papers in a faculty of a public university in SR19. The current ARRA analysis does not take into consideration the number of authors of the given work (publication). A survey of the database shows that the average number of papers published by authors from public universities in SR increased gradually in the 1995 – 2004 period – in 1995 there were 999 papers and in 2004 the number had increased to 1273. In 2004 public universities in SR had a total of 9 810.5 teachers and 1 269 research and artistic workers in with higher education, representing a total of 11 079.5 creative workers. This means that for each worker 0.12 papers were published in 2004. The results in the tables and graphs published in this ARRA report show that the average number of papers per creative worker depend to a large extent on the groups of faculties given in the Frascati Manual. 16 To decode a abbreviation of a faculty in the graphs please have a look at the Table 1 in Chapter 3. 17 The selection of data from a ten-year period disadvantages faculties that have existed for a shorter time. It should therefore be assumed that their ranking in this group of indicators might improve in future. A ten-year period for the assessment of scientific performance is the generally used standard. 18 The Thomson Web of Knowledge (WoK) includes the following databases: Web of Science (WoS), Science Citation Index Expanded (SCI-EXPANDED), Social Sciences Citation Index (SSCI), Arts & Humanities Citation Index (A&HCI) (available for the years 1985 to 2005) and Essential Science Indicators (ESI). The WoK database (including WoS and ESI) is available to all employees of all universities, the Slovak Academy of Sciences, the Accreditation Commission and the SR Ministry of Education. 19 Where the name of the author could not be linked to a faculty from the database, the link was made through the list of university (faculty) employees on the web page. 27
- 29. Table 6: Number of papers for the years 1995 – 2004 per one creative worker (situation in 2004) Group Papers published in 1995 – 2004 per one creative worker TECH 0,0 – 7,8 NAT 0,1 – 5,8 AGRO 0,2 – 3,2 MED 1,1 – 3,2 SOC 0,0 – 2,5 HUM 0,0 – 0,6 A number of faculty employees, especially in the groups SOC and HUM often publish their work in periodicals that are not included in the WoK database. This means that the approach has a negative impact on the arts faculties in particular. Nevertheless the ARRA analysis includes only papers from the WoK database. The reasons for this are as follows: - the WoK database is in the public domain, which is in accordance with ARRA's data collection plan, - the inclusion of a magazine in the WoK database provides a certain guarantee of quality, since inclusion is based on an assessment of the level of the published articles, the history of the periodical and the like, - the WoK database is a source of bibliographic data that is recognized by the general academic community - the WoK database is available from any location in the world and the data it contains can be compared internationally, - in each group of faculties there are faculties that have publications in the WoK database, which shows that it is possible to publish in periodicals that are in this database; the fears of discrimination in some faculties and fields of study are reduced by the fact that they are compared only within their own group and with faculties that have the same or a similar orientation, - assessments of universities and social sciences in other countries20 are based on similar principles of records of publications in the WoK. Other important scientific papers that WoS does not record are patents and monographs (or articles in monographs). We believe that these types of publication are included in the survey to a certain extent, even if indirectly. Monographs or 20 E.g. THES, October 21, 2005, p. 10. 28
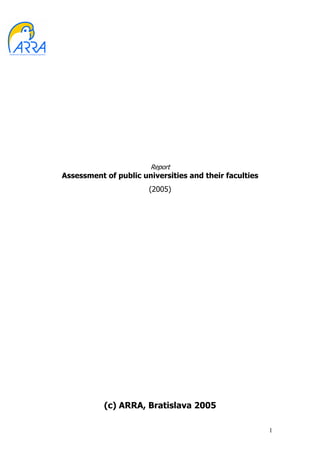
- 30. chapters in them are produced mainly from the results of the scientific papers of their author or authors. These scientific results are as a rule also published in articles in recognized periodicals. A quite natural question to ask is whether the numbers stated in individual graphs and tables for indicator VV1 are low, average or high. Comparison with other assessments of a similar type in other countries led to the conclusion that they are on the low side. A serious answer to this question depends on a comparison with the faculties of other – foreign – universities or comparison with the results of non- university scientific institutions (e.g. the institutes of the Slovak Academy of Sciences). As one of the first, ARRA will make a comparison with the individual institutes of SAV in the near future. (Red lines in the graphs indicate average values). Number of publications per one creative worker in 2004 VV1 Faculty group – MED 3,5 3,21 3,0 2,5 2,0 1,5 1,42 1,30 1,11 1,0 0,5 0,0 Farm UK JessenLek UK Lek UK Lek UPJŠ 29
- 31. 0,0 0,5 1,0 1,5 2,0 2,5 3,0 3,5 0 1 2 3 4 5 6 7 VeterLek. UVL 3,15 Prír UPJŠ 5,80 FMFI UK 4,40 Agro SPU 1,01 Faculty group – AGRO Prír UK 3,97 Faculty group – NAT BiotPotr. SPU 0,97 Ekolenv TUZ 0,96 Prír UMB 0,70 Les TUZV 0,82 Prír UKF 0,63 Drev TUZV Prír UCM 0,61 0,33 Infor a InfTech 0,18 STUBA Záhrad SPU 0,16 Prír ŽU 0,15 30
- 32. Faculty group – TECH ŠpecTechn TUAD 0,00 ŠpecInž ŽU 0,00 Archit STUBA 0,02 Stav ŽU 0,08 Stroj TUKE 0,08 Stroj ŽU 0,11 Mech SPU 0,12 VýrTech TUKE 0,12 EnvirTech. TUZV 0,14 MatTechn STUBA 0,20 MechTron TUAD 0,21 Stav TUKE 0,23 Elektr ŽU 0,31 Stroj STUBA 0,38 Stav STUBA 0,58 Ban TUKE 0,61 Elektr TUKE 0,63 PriemTech TUAD 1,62 Elektr STUBA 2,03 Hutn TUKE 2,25 ChemTechn. STUBA 7,80 0 1 2 3 4 5 6 7 8 9 31
- 33. Faculty group – HUM VýtvarUm AU 0,00 VŠVU BL 0,00 Umení TUKE 0,00 Teol.TVU 0,00 Teol KU 0,00 Pravosl.PU 0,00 MuzUm AU 0,00 HudTan VŠMU 0,00 Greckokat.PU 0,00 Filolo UMB 0,00 FilmTel VŠMU 0,00 DramUm AU 0,00 Divadelná VŠMU 0,00 Fil UKF 0,03 Fil UCM 0,04 RímsKat UK 0,04 Fil KU 0,07 Hum UMB 0,10 HumPrír PU 0,25 Fil TVU 0,27 Evanj UK 0,38 Fil UK 0,48 Fil PU 0,62 0,0 0,1 0,2 0,3 0,4 0,5 0,6 0,7 32
- 34. Faculty group – SOC Zdravotnícka PU 0,00 Športu PU 0,00 Sredoeur.Št.UKF 0,00 SocEkon UK 0,00 SocEkon TUAD 0,00 Soc UKF 0,00 Práv UMB 0,00 Práv TVU 0,00 Pedas ŽU 0,00 Pedag UMB 0,00 MasMed UCM 0,00 Manažment PU 0,00 Pedag UKF 0,02 Polit UMB 0,02 Pedag PU 0,04 PodnHosp. EU BA 0,05 Práv UPJŠ 0,06 Pedag KU 0,06 Práv UK 0,07 EkonomManSPU 0,07 Pedag UK 0,08 Ekonom UMB 0,09 Riadenia ŽU 0,09 Finan UMB 0,16 Pedag TVU 0,16 Manag UK 0,19 TV UK 0,21 VerSpr UPJŠ 0,22 EurŠt SPU 0,24 PodnMan EU BA 0,33 MedzVzťah EU BA 0,33 HospInfo EU BA 0,42 NárHosp. EU BA 0,45 Ekonom TUKE 0,50 Obchod EU BA 0,62 ZdravSoc TVU 2,46 0,0 0,5 1,0 1,5 2,0 2,5 3,0 33
- 35. VV2 Number of citations per CW according to the WoS database Citations represent another indicator of scientific performance that is widely accepted around the world, in particular of the domestic and international response to the published results of the scientific work of individuals and work groups. In discussions of this indicator there have been a number of misunderstandings, which is why we give more space to its explanation. In the WoS database, every work is linked to information about the number of times and in which papers it has been cited, and the citations of each author's work can be found. Citations for all papers come only from the periodicals for which WoS collects information The papers whose citations are analyzed here are precisely those papers that were included in indicator VV1, i.e. papers published in the years 1995 – 2004 and recorded in the WoS database. For example, if an author in a particular faculty published a work in 1994 (i.e. before the monitored period), which has a number of citations, neither this work nor its citations are included in the current ARRA analysis. If the work was published in 2002, the work appears in the VV1 indicator and its citations will be counted in the VV2 indicator. This leads to a certain reduction in the number of citations but this is not considered to be a fundamental problem. The same conditions were applied to each university in the study. This reduction has also helped to capture the current situation, which is more important for today's prospective students than the rich scientific history of the university since its foundation. Citations for papers published in the years 1995 – 2004 are accumulating in 2005 and will continue to accumulate in future years. The analysis of citations was carried out as at 31 December 2004, and therefore the set of citations includes only those from before this date. A classic problem in analyzing citations is excluding self-citations, i.e. citations of papers where at least one of the authors of the citing work is one of the authors of the cited work. When calculating the number of citations of the work of a given author, especially in career progression, self-citations are not taken into consideration. The ARRA analysis however includes self-citations. The available and suitable software for the analysis of publications and citations does not contain filters that could exclude self-citations. The time requirements for "manual" filtering would 34
- 36. be extremely high. We believe, however, that the removal of self-citations would not have a significant effect on the results presented here. Just for information, employees of Slovak universities published a total of 11 163 papers that are recorded in WoK in the period 1995 – 2004. 43 545 citations of these papers were recorded. Of these 11 163 papers, however, 3 382 papers i.e. 30%, did not receive a single citation. This fact shows that even the papers' own author did not cite it during this period. As mentioned above, the number of citations was determined for the period 1995 – 2004 for papers that were published in the same period. In the HUM group, only 6 faculties recorded any result, with the other 17 (of which 8 are faculties of art) having no record. The situation is the same in the SOC group – 19 faculties out of a total of 36 did not record any data. The VV2 indicator combined with the VV1 indicator makes possible certain comparisons with the highest international level. If we divide result VV2 by result VV1, we get the average number of citations for one published paper. Some of the more successful faculties of public universities in SR are shown in Table 7. Table 7: Average number of citations per paper for certain faculties of public universities, 1995 – 2004 Faculty Average number of citations per one paper Faculty of Mathematics, Physics and Informatics, UK 8,30 Faculty of Natural Sciences, UK 4,24 Faculty of Chemical and Food Technology, STUBA 4,19 Faculty of Medicine, UPJŠ 4,11 Faculty of Pharmacy, UK 3,99 Jessenius Faculty of Medicine, UK 3,98 Faculty of Natural Sciences, UPJŠ 3,77 Faculty of Medicine, UK 3,60 University of Veterinary Medicine 1,87 It is also possible to give a comparison of this indicator for all Slovak public universities. 35
- 37. Table 8: Average number of citations per paper for Slovak public universities, 1995 – 2004 University Average number of citations per paper (1995 – 2004) Comenius University, Bratislava 5,2 Slovak University of Technology, Bratislava 3,9 Pavol Jozef Šafárik University, Košice 3,9 University of Trnava, Trnava 3,7 Matej Bel University, Banská Bystrica 2,2 Alexander Dubček University in Trenčín, Trenčín 2,1 Constantine the Philosopher University, Nitra 2,1 University of Veterinary Medicine, Košice 1,9 Technical University of Košice, Košice 1,7 Technical University in Zvolen, Zvolen 1,5 University of St. Cyril and Methodius, Trnava 1,1 Slovak University of Agriculture, Nitra 1,0 University of Žilina, Žilina 0,9 University of Prešov, Prešov 0,3 University of Economics, Bratislava 0,3 Catholic University, Ružomberok 0,2 Academy of Arts, Banská Bystrica 0,0 Academy of Music and Dramatic Arts, Bratislava 0,0 Academy of Fine Arts and Design, Bratislava 0,0 21 A comparison with other countries can be made fairly simply because THES uses the same methodology. First those of the best universities: Table 9: Average number of citations per paper for some of the most successful universities in the world, 1995 – 2004 University Average number of citations per paper published in 1995 – 2004 Harvard University 20,6 Princeton University 17,7 Stanford University 17,3 University of California, Berkeley 16,0 ETH Zurich 14,0 Cambridge University 12,9 Oxford University 12,2 Middle of the table in the stated magazine: Table 10: Average number of citations per paper for some other universities from around the world, 11095 – 2004 University Average number of citations per paper published in 1995 – 2004 University of British Columbia 10,1 Copenhagen University 8,7 Osaka University 7,3 La Sapienza University Roma 7,8 21 The Times Higher Education Supplement (THES), 7 October 2005, p. 9. 36
- 38. From this comparison we can see that not even the relatively successful faculties of Slovak public universities (apart from the UK Faculty of Mathematics, Physics and Informatics) achieve even a medium position in the average number of citations for a published paper. Number of citations per creative worker in 1995 – 2004 VV2 Faculty group – MED 14 12,81 12 10 8 5,85 6 4,68 4,43 4 2 0 Farm UK Lek UK Lek UPJŠ JessenLek UK Faculty group – NAT 40 36,5 35 30 25 21,9 20 16,8 15 10 5 2,0 1,5 1,1 0,4 0,0 0,0 0 FMFI UK Ekolenv TUZ Prír UK Prír UPJŠ Prír UCM STUBA Prír UMB Prír UKF InfTech Prír ŽU Infor a 37