SlideShare uma empresa Scribd logo
1 de 10
Baixar para ler offline
s 
Shale Gas - the Next Cradle of Energy? 
October 16, 2014 
© Aranca 2014. All rights reserved. | info@aranca.com | www.aranca.com 
Aranca is an ISO 27001:2013 certified company 
Page | 1 By Karan Sampat, Analyst – Investment Research 
While crude prices continued to scale new highs during the latter part of last decade, a silent revolution fomenting in the energy space went unnoticed. When crude prices hit their all-time high of more than US$147 per barrel in July 2008, the need to find an alternative source of energy gained importance, with the US spearheading efforts in what was termed a new technology – “hydraulic fracturing” or “fracking”. The technology allowed extraction of gas trapped beneath the shale layer to tap into the vast pool of unexplored source of energy, which is estimated to run into billions of barrels of oil equivalent. As of 2013, technically recoverable shale gas resources accounts for nearly one third of the total gas resources of the world. The revolution would not only help reduce US’ dependence on fossil fuels and provide a much cleaner source of energy (thereby lowering emissions) but also would lead to energy security and lower reliance on oil from the Middle East. Currently, the US is expected to be energy self-sufficient by 2030, according to the Energy Information Administration (EIA). Others seem to be following suit – Europe has intensified exploration efforts and so has China in search for shale gas. 
Nonetheless, the key is continued improvement in the efficiency in producing shale oil & gas. In recent weeks, prices of crude oil have hit the lowest level since June 2012. As of today, Brent and WTI crude are trading at $80.69 and $82.91 a barrel, respectively. This sharp decline in prices of crude oil has been primarily ascribed to the International Energy Agency (IEA)’s reduction in the demand forecast for oil to 700,000 barrels a day from 900,000 barrels a day. Furthermore, the decrease in oil imports from the US due to a rise in shale volumes coupled with Saudi Arabia’s decision to sell oil at lower prices rather than cutting down production is adding to the downside. The EIA estimates just 4% of shale oil production would become economically unviable if oil prices touch $80 a barrel. According to certain estimates, at the lowest level, oil would need to breach below $50–55 a barrel for a majority of the shale oil produced to operate at sub-optimal profit margins. 
Top 10 countries with technically recoverable shale resources Rank Country Shale oil (billion barrels) 1 Russia 75 
2 
US 
58 3 China 32 
4 
Argentina 
27 5 Libya 26 
6 
Australia 
18 7 Venezuela 13 
8 
Mexico 
13 9 Pakistan 9 
10 
Canada 
9 World Total 345 
Rank Country Shale gas (trillion cubic feet - tcf) 1 China 1,115 
2 
Argentina 
802 3 Algeria 707 
4 
US 
665 5 Canada 573 
6 
Mexico 
545 7 Australia 437 
8 
South Africa 
390 9 Russia 285 
10 
Brazil 
245 World Total 7,299 
Source: EIA June 10, 2013 
Technically recoverable shale resources vs total resources 
Source: EIA, http://www.eia.gov/analysis/studies/worldshalegas/ 
10% 
90% 
3,357 bn bl 
Shale oil 
Conventional oil 
32% 
68% 
22,881 tcf 
Shale gas 
Conventional gas
s 
Shale Gas - the Next Cradle of Energy? 
October 16, 2014 
© Aranca 2014. All rights reserved. | info@aranca.com | www.aranca.com 
Aranca is an ISO 27001:2013 certified company 
Page | 2 US Shale Gas: Energy Self Sufficiency in 15 Years! 
Shale gas to play a significant role in meeting US energy demand 
The US has witnessed the most successful shale gas developments to date. The International Energy Agency (IEA) reported the US is forecast to surpass Russia and Saudi Arabia as the world’s leading oil producer by 2015 due to the shale gas boom. Natural gas accounts for approximately 30% of US energy consumption. The contribution of shale gas to US domestic gas production increased from a meager 2% in 2000 to 23% by 2010. The Energy Information Administration (EIA) projects shale gas to account for 48% of total US gas supply by 2030. 
Due to its high British thermal unit (BTU) content and the well-developed storage and transfer infrastructure, natural gas is widely used in the country’s industrial, commercial, and residential sectors. The US unconventional energy boom has reversed the decline of domestic production and suppressed gas prices. Thus, shale gas is likely to play a substantial role in meeting US energy demands. 
Contribution of shale gas to domestic gas production 
Source: Annual Energy Outlook 2014 Early Release 
US likely to be net exporter of LNG by 2016 
The US is speculated to be the net exporter of natural gas by the end of 2016. Due to the shale revolution, production of gas is expected to far exceed the expected consumption. This is evident from a drastic fall in the import of natural gas in the US and also, conditional approval by Department of Energy (DOE) in past one year, to build six LNG export facilities further strengthens the claim. The excess gas is likely to be exported largely to Asia, where the prices of natural gas are the most attractive. 
Forecasted production and consumption of natural gas in US (quadrillion Btu) 
Source: Annual Energy Outlook 2014 Early Release 
Economic impact of shale gas 
The US was expected to have imported 10 billion cubic feet of natural gas, if not shale gas, per day by now. However, the country could potentially export 10 billion cubic feet of gas per day by 2020 instead. Shale gas can have a multiplier effect on the US economy far beyond just the supply chain from exploration sites to exports. According to data from the EIA, the US currently produces 14% more of its own energy than in 2005. Natural gas production is projected to increase 3% per year until 2020 vis-à-vis 2011, whereas consumption is estimated to increase by just 1% annually over the same period. Moreover, petroleum contributed $13.82 billion to US exports in July, according to data released by the US Department of Commerce on September 4, 2014. This represents a $1.72 billion increase over July 2013. This helped reduce the overall US trade deficit to $40.5 billion in July, from $40.8 billion in June. In addition to 
98% 
2% 
2000 
77% 
23% 
2010 
58% 
42% 
2020 
52% 
48% 
2030 
Total gas 
production 
Shale gas 
51% 
49% 
2011 
55% 
45% 
2020 
57% 
43% 
2030 
57% 
43% 
2040 
Production 
Consumption
s 
Shale Gas - the Next Cradle of Energy? 
October 16, 2014 
© Aranca 2014. All rights reserved. | info@aranca.com | www.aranca.com 
Aranca is an ISO 27001:2013 certified company 
Page | 3 
oil & gas export and reducing the trade deficit, shale gas has the potential to revive the transportation, petrochemical, power generation, and manufacturing sectors as well as increase disposable income per household by reducing electricity bills. By enhancing the global supply of natural gas, the US can establish much-required energy security for itself as well as its trade partners. The price of natural gas rose from $2.42 million btu (mmbtu) in 2000 to $12.69 mmbtu in June 2008. In most recent years, natural gas prices stabilized around $4.00 mmbtu, largely due to the advent of shale gas developments. The EIA reports natural gas prices would remain below $5 mmbtu until 2023. The manufacturing sector in the US could recover, supported by such sustainable lower energy costs compared with those incurred by its global peers.. 
Consumption of various energy sources in the US (quadrillion Btu) 
Source: Annual Energy Outlook 2014 Early Release 
Effect of shale gas on sectors 
Looking at the energy demand pattern, oil is the primary source of fuel in the transportation sector, whereas natural gas is mainly used in the residential, commercial, industrial and power generation sectors. However, low gas prices and high oil price may encourage more future investments based on natural gas in this sector. 
Transportation sector: Low gas prices and high oil prices may result in substitution of oil with natural gas in this sector. Natural gas can be used in two ways in the transportation sector: 1) Compressed Natural Gas (CNG) and 2) Liquefied natural gas (LNG). The major advantage of LNG over CNG is that it can hold three times more fuel than the latter and thereby cover more mileage. A key drawback of LNG’s commercial viability is that it requires a low temperature tank, which needs high cost and is difficult to downsize. Therefore, LNG will take more time to be extensively commercialized. Currently, CNG is mainly used in public transportation such as buses and carrier services, which have short and medium range operation. The future of LNG in transportation will depend upon how fast auto manufacturers are able to introduce vehicles that run on LNG. Pricing and fuel efficiency of such vehicles would be the keys to success of LNG in the transportation sector. Thus, natural gas has the potential to transform the transportation sector. 
Petrochemical sector: Naphtha and ethane are the two most widely used feedstocks in the US chemical industry. Naphtha is derived from oil and ethane from natural gas liquids (NGL). Energy prices in the US have decreased due to the shale gas revolution, thereby significantly reducing the US petrochemical industry’s raw material costs. PwC, in its report dated 2012, reported that by 2025, shale gas could enable US manufacturers to reduce their raw material and energy costs by $11.6 billion annually. Ethane, the raw material for producing ethylene, is separated from the NGL contained in shale gas. Ethane prices have fallen by more than 50% in five years. This has led to increased new investments toward ethane-based plants. According to a study by Booz & Co., NGLs from conventional gas would constitute 60% of US ethylene feedstock source by 2015, followed by NGLs from shale gas at 28% and the remaining 12% would include naphtha and heavier feedstock. The abundant supply of NGL due to the shale gas revolution decreased the price of ethane, thereby making it cheaper to produce ethylene. The cost involved in setting up a naphtha based plant (355 killiotonnes per 
Natural gas 
Oil 
Coal 
Others 
0 
20 
40 
60 
80 
100 
120
s 
Shale Gas - the Next Cradle of Energy? 
October 16, 2014 
© Aranca 2014. All rights reserved. | info@aranca.com | www.aranca.com 
Aranca is an ISO 27001:2013 certified company 
Page | 4 
annum - ktpa) and a gas based plant (500 ktpa) can be approximately $715 million and $718 million respectively. Assuming the abundance in supply of natural gas continues, US chemical companies would benefit from the low cost of ethylene production. PwC reported the US chemicals industry invested $15 billion in ethylene production, increasing capacity by 33%. However, this might pose a threat to naphtha crackers. Although ethane crackers have benefitted from the low price of natural gas in the US, naphtha crackers would have to focus on developing high-value products to survive the competition. 
Power generation sector: The EIA estimates the average power plant capital and operating costs based on natural gas to be at $1,157/kW vis-à-vis $3,640/kW for coal-based plants in 2012. Lower capital and operating costs, coupled with lower natural gas prices, would drive more power plant operators toward natural gas and increase its share in the power generation fuel mix. Cheaper gas would reduce the cost of producing electricity and overall electricity prices. Lower electricity prices would imply more annual household income. In the near term, power generation companies could switch from other fuels to natural gas by varying the capacity factors of different generating units to take advantage of the cheaper fuel. 
US to be energy self-sufficient by 2030 
As reported by the EIA in its Annual Energy Outlook 2014 Early Release, crude oil production is forecast to increase 5.9% each year from 2011 until 2020 and natural gas by 3% during the same period. Energy consumption is projected to remain flat at 100.73 quadrillion Btu in 2020 vis-à-vis 97.11 quadrillion Btu in 2011. Thus, the US is estimated to become energy self-sufficient by 2030 owing to increased production of oil and gas and slowing domestic demand. The IEA forecasts the US to overtake Saudi Arabia to become the world’s top oil producer over the next two decades due to increasing shale oil and gas output. 
Current and expected investments in shale gas transport infrastructure from 2011 through 2035 
Shale play would require investments of about $56 billion ($2.6 billion/year) over the next 22 years. 
Natural gas infrastructure 
 New gas transmission capability – Approximately 43 Bcfd 
 New gas transmission mainline – 850 miles/year 
 New laterals to/from power plants, processing facilities, and storage fields – 800 miles/year 
 New gas gathering lines – almost 14,000 miles/year 
 New gas processing capability – Approximately 35 Bcfd 
 New working gas storage capacity – Approximately 37 Bcf/year 
 Pipeline and gathering compression – More than 580,000 horsepower/year 
Natural Gas Liquid (NGL) infrastructure 
 NGL transmission capacity – 3.6 mmbpd 
 New NGL transmission line – 700 miles/year 
 Pumping requirement for pipeline – 30,000 horsepower/year 
 NGL fractionation capacity – Approximately 151 MBOE/d to be added each year 
 NGL export capacity – 64 MBOE/d to be added each year 
Source: http://www.ingaa.org/File.aspx?id=21498
s 
Shale Gas - the Next Cradle of Energy? 
October 16, 2014 
© Aranca 2014. All rights reserved. | info@aranca.com | www.aranca.com 
Aranca is an ISO 27001:2013 certified company 
Page | 5 Canada: It’s time to look beyond North America 
All eggs hatched in the same basket 
Canada is the world’s third largest producer of natural gas. Western Canada is blessed with vast unconventional gas reserves. The country currently exports 50% of the natural gas it produces to North America. However, demand for Canadian natural gas has decreased in the US, as the country is all set to be self-sufficient in natural gas due to shale gas developments. Canada does not have export terminals that can transport LNG beyond North America. It also lacks processing facilities to liquefy and ship LNG beyond North America. 
Going forward, will it be Europe or Asia? 
Canada will have to turn to Europe, or Japan, China and other developing Asian countries to sell the excess natural gas it produces. The Asian energy market is significantly closer to the west coast of Canada than the European markets; thus, producers could examine market opportunities in Asia and particularly those in South East Asia. With just eight sailing days to Japan and 11 sailing days to China, the west coast ports of Kitimat and Prince Rupert are closer to these markets than any other North American port. 
Proposed projects 
Northern Gateway, Trans Mountain Expansion (TMX) and Keystone XL are the proposed pipeline projects that would help Canadian energy producers to access new markets. 
 Enbridge’s Northern Gateway project (capacity of 193 thousand barrels per day) and Kinder Morgan’s TMX project (capacity of 890 thousand barrels per day) will help reach the growing energy markets of Asia. 
 TransCanada’s Keystone XL would provide access to the refining capacity on the US Gulf Coast.
s 
Shale Gas - the Next Cradle of Energy? 
October 16, 2014 
© Aranca 2014. All rights reserved. | info@aranca.com | www.aranca.com 
Aranca is an ISO 27001:2013 certified company 
Page | 6 Europe – Uncertainty prevails over shale gas exploration 
Europe to benefit from US Shale gas revolution 
Russia is the largest exporter of oil and gas to the EU. Gazprom, Russia’s state-owned company, transports gas to Europe via Ukraine. The frequent tensions between Russia and Ukraine have often impacted gas supplies to Europe. The US shale gas revolution could prove to be a boon for Europe if US companies decide to produce adequate quantity to be supplied to Europe, thereby reducing their dependence on Russia. It brings the opportunity to diversify energy supply. A decrease in the prices of natural gas due to higher supply could also help the recession hit Europe limit costs. 
Current scenario of shale gas in Europe 
Although sizeable quantity of shale gas has been reported in Europe, none of the Western European countries currently feature in the top 10 technically recoverable shale oil and gas resources. Large-scale shale gas production remains a big question due to the wide range of environmental, regulatory and economic obstacles. Significant regulatory risks persist due to lack of regulatory framework. Also, the EU member countries are unable to reach a consensus of opinion. France and Bulgaria have legally prohibited shale gas production, while public discussion on shale gas is going on in Germany and the Netherlands. EU members also differ on the potential environmental risks of the fracking activity. On the economic front, shale gas deposits in Europe are located much deeper than that in the US and would require higher gas prices to be exploited in a commercial attractive way. Moreover, European companies lack the technical know-how on fracking techniques and skilled resources. 
Unconventional producers of gas to compete with conventional producers 
Countries like Russia, Algeria, and Norway are the major suppliers of conventional gas to Europe. These countries can set the marginal gas price at any time if desired for geopolitical or economic reasons. Therefore, any shale gas developments have to compete with the abundant conventional supply of gas in this region. 
Help in achieving carbon emissions target 
Europe has the toughest carbon emissions target in the world. It aims to cut gas emissions by 40% by 2030 compared with the 1990 level. Shale gas offers a cheap and carbon friendly way to meet energy needs and might prove to be vital in achieving carbon emission targets. Thus, improving energy efficiency and promoting low-carbon technologies will be just as important as before, especially for the EU, given its more limited known reserves of unconventional oil and gas.
s 
Shale Gas - the Next Cradle of Energy? 
October 16, 2014 
© Aranca 2014. All rights reserved. | info@aranca.com | www.aranca.com 
Aranca is an ISO 27001:2013 certified company 
Page | 7 China has potential, currently prefers playing the waiting game 
Coal expected to dominate; natural gas consumption projected to increase threefold by 2025 
Coal forms the major source of energy consumption in China and is expected to dominate for the considerable future. Demand for natural gas is expected to increase approximately 2.7 times from 3.768 tcf in 2010 to 10.27 tcf in 2025, as reported by EIA. 
China energy consumption (quadrillion Btu) 
Source: Annual Energy Outlook 2014 Early Release 
Issues that need to be mitigated to produce shale gas 
China has the largest (1,115 tcf) technically recoverable shale gas reserves in the world. It also has a regulatory framework that supports the development of shale gas technology. The key issues it might face for exploration of shale gas are shortage of water, depth of gas deposits, and lack of infrastructure to process and transport natural gas from the exploration site. China needs to develop strategic partnership with foreign companies to adopt the skills and technologies needed to develop and explore gas reserves. 
Use of natural gas needs to be encouraged 
Being a manufacturing economy, China is plagued with environmental issues, particularly air pollution. Use of natural gas in manufacturing can help the country mitigate this problem. Greater adoption of natural gas in manufacturing could lead to less dependence on coal and increase shale gas development activity in China. Commencement of shale gas development in China could significantly reduce shale gas prices. The cost of drilling is believed to be high in China when compared to the US due to location- specific conditions. State-owned oil and gas company Sinopec stated that the cost of drilling one shale gas well, including the cost for drilling, fracturing and procurement of services from technical service companies, is currently around $14.7 million vis-à-vis $6.7 million on average in the US. 
Russia-China Natural Gas Deal 
China recently made a 30-year deal with Russia at a price range of $10.50–11 per mmbtu to buy 3.8 million cubic feet per day of natural gas from 2018 via a pipeline from Eastern Serbia. This deal could possibly set a benchmark price for further natural gas deals for Asian peers. The key inference from this deal is that the cost of regasification, liquefaction, and transport to Asia can be approximated at $7 per mmbtu (assuming the LNG cost in the US is $4 per mmbtu). Another possible inference is that China would only explore shale developments in sizable quantities at a cost less than $11 per mmbtu. (assuming the LNG cost in the US is stable at $4 per mmbtu for next few years) 
NG 
Liquids 
Coal 
Others 
0 
50 
100 
150 
200 
250
s 
Shale Gas - the Next Cradle of Energy? 
October 16, 2014 
© Aranca 2014. All rights reserved. | info@aranca.com | www.aranca.com 
Aranca is an ISO 27001:2013 certified company 
Page | 8 Impact on GCC 
Need to realign the core market from US to Asia 
The shale gas revolution has had limited impact on GCC so far, as the US is yet to reduce oil imports in significant quantities from the region. GCC countries are major oil producing economies. Currently, the US is one of the major importers of crude oil from GCC. This trend is about to change due to the shale gas revolution. With the global energy demand for oil expected to increase, GCC countries would need to realign their core market to Asia from US. This could represent both an opportunity as well as threat to GCC countries. 
World energy consumption by fuel type, 1990–2040 (quadrillion Btu) 
Source: International Energy Outlook 2013, EIA 
Qatar needs to find an alternative to oil price indexed contracts 
Qatar leads among GCC countries in terms of producing huge quantities of natural gas. Qatar is the world’s largest exporter of LNG and enjoys long-term gas contracts linked to the price of oil. Asia accounts for almost half of Qatar’s LNG export. Due to emergence of natural gas supplies from North America and the option of indexing the contract price of natural gas to Henry Hub Natural Gas Spot Price (which is less volatile than crude oil price), Qatar’s Asian partners are likely to ink deals with the US. Also, countries are not willing to pen down long-term gas contracts due to the prevailing uncertainty in future gas prices; this could impact Qatar’s profitability. 
Favorable raw material conditions in Qatar 
Qatar expects demand from Asia to increase fast enough to more than compensate for the reduction in demand from the US. The country can increase export volumes to Asia, mainly China and Japan, where demand for LNG is expected to increase considerably enough to absorb the excess LNG supplies from shale gas developments. The recent shale gas developments provide Qatar with new opportunities. In the foreseeable future, Qatar would still have favorable raw material conditions. The country can benefit from it by altering end markets around shale gas induced market changes. 
GCC countries with current account surplus need to venture in US shale play 
Another option for GCC companies would be to participate in the US shale boom by venturing in companies engaged in the exploration and production of shale developments. Increasing advancement in the fracking methodology in the US, which will lower the cost of exploration, coupled with compressed natural gas prices, are bound to impact the profit margins of GCC countries. 
0 
50 
100 
150 
200 
250 
1990 
1991 
1992 
1993 
1994 
1995 
1996 
1997 
1998 
1999 
2000 
2001 
2002 
2003 
2004 
2005 
2006 
2007 
2008 
2009 
2010 
2011 
2012 
2013 
2014 
2015 
2016 
2017 
2018 
2019 
2020 
2021 
2022 
2023 
2024 
2025 
2026 
2027 
2028 
2029 
2030 
2031 
2032 
2033 
2034 
2035 
2036 
2037 
2038 
2039 
2040 
Liquids 
Coal 
Natural gas 
Renewables 
Nuclear 
Projections 
History 
2010
s 
Shale Gas - the Next Cradle of Energy? 
October 16, 2014 
© Aranca 2014. All rights reserved. | info@aranca.com | www.aranca.com 
Aranca is an ISO 27001:2013 certified company 
Page | 9 Critical factors to shale gas production 
Cost of producing natural gas: The cost of producing natural gas varies from site to site and country to country. Ken Medlock, Senior Director of Rice University’s Baker Institute Center reported that in the US, some wells have a profitable cost of $2.65 per thousand cubic feet (tcf), whereas others cost $8.1 per tcf. The median cost is $4.85 per tcf. It is difficult to translate shale development costs in the US to those in other areas globally. For example, Medlock revealed a 10,500 vertical foot well with a 4,000 foot lateral in the Haynesville Shale costs about $8 million; however, the same well in Poland would cost $14–16 million. This is due to the higher costs associated with importing equipment, fracking crews, and deeper shale reserves vis-à-vis the US, among others. The most important observation here is that the median cost price of $4.85 per tcf is less than the $11 per mmbtu benchmark set by the Russia-China deal. 
Market price: The prevailing market price of natural gas will be the key to determine the viability of producing the discovered natural gas. 
Recovery of investment: Shale gas production must be sufficient enough to recover the investment in time. Logistics should be efficient enough to facilitate distribution to end markets. 
Infrastructure: Exploration and production sites must be adequately serviced by roads and pipelines to process and transport natural gas. 
Regulatory framework: Regulatory support in the form of transparency in allocation of permits and licenses, stable regulatory regime, subsidies for exploration and production would aid the private companies engaged in shale gas production. 
Environmental concerns: Fracking is a water-intensive process and might pose risks in areas where availability of water is a problem. Waste water, which is kept in storage ponds, could overflow during heavy rains. Fracking may also contaminate groundwater and lead to air quality degradation. 
Spills and blow outs: Spills and blow outs could cause severe health and environment hazards if the gas gets mixed with ground water and contaminates it or might spread into the surrounding soil. If gas gets mixed with groundwater, it may lead to tremors or explosion due to pressure build up by gastification.
s 
Shale Gas - the Next Cradle of Energy? 
October 16, 2014 
© Aranca 2014. All rights reserved. | info@aranca.com | www.aranca.com 
Aranca is an ISO 27001:2013 certified company 
Page | 10 
ARANCA DISCLAIMER 
This report is published by Aranca, Inc. Aranca is a customized research and analytics services provider to global clients. 
The information contained in this document is confidential and is solely for use of those persons to whom it is addressed and may not be reproduced, further distributed to any other person or published, in whole or in part, for any purpose. 
This document is based on data sources that are publicly available and are thought to be reliable. Aranca may not have verified all of this information with third parties. Neither Aranca nor its advisors, directors or employees can guarantee the accuracy, reasonableness or completeness of the information received from any sources consulted for this publication, and neither Aranca nor its advisors, directors or employees accepts any liability whatsoever (in negligence or otherwise) for any loss howsoever arising from any use of this document or its contents or otherwise arising in connection with this document. 
Further, this document is not an offer to buy or sell any security, commodity or currency. This document does not provide individually tailored investment advice. It has been prepared without regard to the individual financial circumstances and objectives of persons who receive it. The appropriateness of a particular investment or currency will depend on an investor’s individual circumstances and objectives. The investments referred to in this document may not be suitable for all investors. This document is not to be relied upon and should not be used in substitution for the exercise of independent judgment. 
This document may contain certain statements, estimates, and projections with respect to the anticipated future performance of securities, commodities or currencies suggested. Such statements, estimates, and projections are based on information that we consider reliable and may reflect various assumptions made concerning anticipated economic developments, which have not been independently verified and may or may not prove correct. No representation or warranty is made as to the accuracy of such statements, estimates, and projections or as to its fitness for the purpose intended and it should not be relied upon as such. Opinions expressed are our current opinions as of the date appearing on this material only and may change without notice. 
© 2014, Aranca. All rights reserved.

Mais conteúdo relacionado

Mais procurados

Bord gáis energy index june 2014
Bord gáis energy index june 2014Bord gáis energy index june 2014
Bord gáis energy index june 2014
Bord Gáis Energy
 
LOCAL NATURAL GAS FOR LOCAL PEOPLE IN NIGERIA 1
LOCAL NATURAL GAS FOR LOCAL PEOPLE IN NIGERIA 1LOCAL NATURAL GAS FOR LOCAL PEOPLE IN NIGERIA 1
LOCAL NATURAL GAS FOR LOCAL PEOPLE IN NIGERIA 1
Oluwasegun Idowu CSM CBDA
 

Mais procurados (20)

New base energy news issue 869 dated 09 june 2016
New base energy news issue  869 dated 09 june 2016New base energy news issue  869 dated 09 june 2016
New base energy news issue 869 dated 09 june 2016
 
New base energy news 11 march 2019 issue no 1234 by khaled al awadi
New base energy news 11 march 2019 issue no 1234  by khaled al awadiNew base energy news 11 march 2019 issue no 1234  by khaled al awadi
New base energy news 11 march 2019 issue no 1234 by khaled al awadi
 
Bord Gáis Energy Index October 2013
Bord Gáis Energy Index October 2013Bord Gáis Energy Index October 2013
Bord Gáis Energy Index October 2013
 
New base 07 december 2017 energy news issue 1110 by khaled al awadi
New base 07 december  2017 energy news issue   1110  by khaled al awadiNew base 07 december  2017 energy news issue   1110  by khaled al awadi
New base 07 december 2017 energy news issue 1110 by khaled al awadi
 
New base energy news 12 november 2020 issue no-1387 senior editor khaled a...
New base energy news 12 november 2020   issue no-1387  senior editor khaled a...New base energy news 12 november 2020   issue no-1387  senior editor khaled a...
New base energy news 12 november 2020 issue no-1387 senior editor khaled a...
 
Microsoft word new base 661 special 10 august 2015
Microsoft word   new base 661 special  10 august 2015Microsoft word   new base 661 special  10 august 2015
Microsoft word new base 661 special 10 august 2015
 
Bord Gáis Energy Index November 2013
Bord Gáis Energy Index November 2013 Bord Gáis Energy Index November 2013
Bord Gáis Energy Index November 2013
 
Bord gáis energy index june 2014
Bord gáis energy index june 2014Bord gáis energy index june 2014
Bord gáis energy index june 2014
 
Federal Reserve Bank: Trends in Energy Production and Prices
Federal Reserve Bank: Trends in Energy Production and PricesFederal Reserve Bank: Trends in Energy Production and Prices
Federal Reserve Bank: Trends in Energy Production and Prices
 
PwC Report: Shale gas, Still a boon to US manufacturing?
PwC Report: Shale gas, Still a boon to US manufacturing?PwC Report: Shale gas, Still a boon to US manufacturing?
PwC Report: Shale gas, Still a boon to US manufacturing?
 
Ey & Cerebral Business Research Shale Gas Report
Ey & Cerebral Business Research Shale Gas ReportEy & Cerebral Business Research Shale Gas Report
Ey & Cerebral Business Research Shale Gas Report
 
New base 694 special 27 september 2015
New base 694 special  27 september 2015New base 694 special  27 september 2015
New base 694 special 27 september 2015
 
VF: Exploration and Production: Q4 2018 | Region Focus: Appalachia
VF: Exploration and Production: Q4 2018 | Region Focus: AppalachiaVF: Exploration and Production: Q4 2018 | Region Focus: Appalachia
VF: Exploration and Production: Q4 2018 | Region Focus: Appalachia
 
NewBase 648 special 15 july 2015
NewBase 648 special 15 july 2015NewBase 648 special 15 july 2015
NewBase 648 special 15 july 2015
 
LOCAL NATURAL GAS FOR LOCAL PEOPLE IN NIGERIA 1
LOCAL NATURAL GAS FOR LOCAL PEOPLE IN NIGERIA 1LOCAL NATURAL GAS FOR LOCAL PEOPLE IN NIGERIA 1
LOCAL NATURAL GAS FOR LOCAL PEOPLE IN NIGERIA 1
 
Mow -spears
Mow  -spearsMow  -spears
Mow -spears
 
New base 08 january 2018 energy news issue 1124 by khaled al awadi
New base 08 january 2018 energy news issue   1124  by khaled al awadiNew base 08 january 2018 energy news issue   1124  by khaled al awadi
New base 08 january 2018 energy news issue 1124 by khaled al awadi
 
New base energy news november 08 2018 no-1212 by khaled al awadi
New base energy news november 08 2018 no-1212  by khaled al awadiNew base energy news november 08 2018 no-1212  by khaled al awadi
New base energy news november 08 2018 no-1212 by khaled al awadi
 
Ceres flaringup
Ceres flaringupCeres flaringup
Ceres flaringup
 
Policy – liquefied natural gas (lng) - Cananda - november 19 2016
Policy – liquefied natural gas (lng) - Cananda - november 19 2016Policy – liquefied natural gas (lng) - Cananda - november 19 2016
Policy – liquefied natural gas (lng) - Cananda - november 19 2016
 

Destaque

Destaque (15)

Aranca views - Argentina Debt Saga
Aranca views - Argentina Debt SagaAranca views - Argentina Debt Saga
Aranca views - Argentina Debt Saga
 
For a Better Tomorrow: Renewable Energy in India is on the Rise | An Aranca ...
 For a Better Tomorrow: Renewable Energy in India is on the Rise | An Aranca ... For a Better Tomorrow: Renewable Energy in India is on the Rise | An Aranca ...
For a Better Tomorrow: Renewable Energy in India is on the Rise | An Aranca ...
 
Amazing Growth of Indian Entertainment & Media – The Reel Story | An Aranca I...
Amazing Growth of Indian Entertainment & Media – The Reel Story | An Aranca I...Amazing Growth of Indian Entertainment & Media – The Reel Story | An Aranca I...
Amazing Growth of Indian Entertainment & Media – The Reel Story | An Aranca I...
 
Global Public Cloud Computing Market Moving Beyond Cloud | An Aranca Infogra...
 Global Public Cloud Computing Market Moving Beyond Cloud | An Aranca Infogra... Global Public Cloud Computing Market Moving Beyond Cloud | An Aranca Infogra...
Global Public Cloud Computing Market Moving Beyond Cloud | An Aranca Infogra...
 
Global M&A - November 2014 | Aranca Newsletter
Global M&A - November 2014 | Aranca NewsletterGlobal M&A - November 2014 | Aranca Newsletter
Global M&A - November 2014 | Aranca Newsletter
 
Aranca | MENA Tourism and Hospitality– May 2014 | Special Reports
Aranca | MENA Tourism and Hospitality– May 2014 | Special ReportsAranca | MENA Tourism and Hospitality– May 2014 | Special Reports
Aranca | MENA Tourism and Hospitality– May 2014 | Special Reports
 
Global Mobile Broadband Scaling Newer Heights | An Aranca Infographic
 Global Mobile Broadband Scaling Newer Heights | An Aranca Infographic Global Mobile Broadband Scaling Newer Heights | An Aranca Infographic
Global Mobile Broadband Scaling Newer Heights | An Aranca Infographic
 
Renewable Energy: Growing sources of Investment | Aranca Article & Publications
Renewable Energy: Growing sources of Investment | Aranca Article & PublicationsRenewable Energy: Growing sources of Investment | Aranca Article & Publications
Renewable Energy: Growing sources of Investment | Aranca Article & Publications
 
VC-backed IPOs on the Rise | Aranca Article & Publications
VC-backed IPOs on the Rise | Aranca Article & PublicationsVC-backed IPOs on the Rise | Aranca Article & Publications
VC-backed IPOs on the Rise | Aranca Article & Publications
 
Aranca views - Consumer Staples − Losing Steam?
Aranca views - Consumer Staples − Losing Steam?Aranca views - Consumer Staples − Losing Steam?
Aranca views - Consumer Staples − Losing Steam?
 
Latin American Wind Power Market Blowing Strong | An Aranca Infographic
Latin American Wind Power Market Blowing Strong | An Aranca InfographicLatin American Wind Power Market Blowing Strong | An Aranca Infographic
Latin American Wind Power Market Blowing Strong | An Aranca Infographic
 
Milking the Emerging Market Dairy Demand | Aranca Articles and Publications
Milking the Emerging Market Dairy Demand | Aranca Articles and PublicationsMilking the Emerging Market Dairy Demand | Aranca Articles and Publications
Milking the Emerging Market Dairy Demand | Aranca Articles and Publications
 
Aranca Views | US Fed Rate Hike Potential Impact - A Report
Aranca Views | US Fed Rate Hike Potential Impact - A ReportAranca Views | US Fed Rate Hike Potential Impact - A Report
Aranca Views | US Fed Rate Hike Potential Impact - A Report
 
Aranca views - China Property Market: Prepare for the End Game?
Aranca views - China Property Market: Prepare for the End Game?Aranca views - China Property Market: Prepare for the End Game?
Aranca views - China Property Market: Prepare for the End Game?
 
Saudi Arabia - Emergence of an Innovation Kingdom | An Aranca Special Report ...
Saudi Arabia - Emergence of an Innovation Kingdom | An Aranca Special Report ...Saudi Arabia - Emergence of an Innovation Kingdom | An Aranca Special Report ...
Saudi Arabia - Emergence of an Innovation Kingdom | An Aranca Special Report ...
 

Semelhante a Aranca views - Shale Gas - the Next Cradle of Energy?

Energy renaissance-outlook-2013[1]
Energy renaissance-outlook-2013[1]Energy renaissance-outlook-2013[1]
Energy renaissance-outlook-2013[1]
John M Olson, CLTC
 
New base 578 special 08 april 2015
New base 578 special  08 april  2015New base 578 special  08 april  2015
New base 578 special 08 april 2015
Khaled Al Awadi
 
Qnb group the US could become energy independent by 2030
Qnb group the US could become energy independent by 2030Qnb group the US could become energy independent by 2030
Qnb group the US could become energy independent by 2030
QNB Group
 
FEX | Industrie & Energie | 131112 | Conferentie Schaliegas & Olie | Presenta...
FEX | Industrie & Energie | 131112 | Conferentie Schaliegas & Olie | Presenta...FEX | Industrie & Energie | 131112 | Conferentie Schaliegas & Olie | Presenta...
FEX | Industrie & Energie | 131112 | Conferentie Schaliegas & Olie | Presenta...
Flevum
 

Semelhante a Aranca views - Shale Gas - the Next Cradle of Energy? (20)

Energy renaissance-outlook-2013[1]
Energy renaissance-outlook-2013[1]Energy renaissance-outlook-2013[1]
Energy renaissance-outlook-2013[1]
 
Dr Dev Kambhampati | DOE- LNG PRIMER
Dr Dev Kambhampati | DOE- LNG PRIMERDr Dev Kambhampati | DOE- LNG PRIMER
Dr Dev Kambhampati | DOE- LNG PRIMER
 
Step on the Gas! How to Extend America's Energy Advantage
Step on the Gas! How to Extend America's Energy AdvantageStep on the Gas! How to Extend America's Energy Advantage
Step on the Gas! How to Extend America's Energy Advantage
 
Bord Gáis energy Index October 2014
Bord Gáis energy Index October 2014Bord Gáis energy Index October 2014
Bord Gáis energy Index October 2014
 
Gas Market
Gas MarketGas Market
Gas Market
 
Gas presentation
Gas presentationGas presentation
Gas presentation
 
Microsoft word new base 994 special 02 february 2017 energy news
Microsoft word   new base 994 special 02 february 2017 energy newsMicrosoft word   new base 994 special 02 february 2017 energy news
Microsoft word new base 994 special 02 february 2017 energy news
 
FERC 2015 State of the Markets Report
FERC 2015 State of the Markets ReportFERC 2015 State of the Markets Report
FERC 2015 State of the Markets Report
 
New base 578 special 08 april 2015
New base 578 special  08 april  2015New base 578 special  08 april  2015
New base 578 special 08 april 2015
 
Linkman | Infographic | Atradius | Gas Market Outlook
Linkman | Infographic | Atradius | Gas Market OutlookLinkman | Infographic | Atradius | Gas Market Outlook
Linkman | Infographic | Atradius | Gas Market Outlook
 
The US Coal Crash | Evidence for Structural Change
The US Coal Crash | Evidence for Structural ChangeThe US Coal Crash | Evidence for Structural Change
The US Coal Crash | Evidence for Structural Change
 
Plg stifel presentation v gb final 120913
Plg stifel presentation v gb final 120913Plg stifel presentation v gb final 120913
Plg stifel presentation v gb final 120913
 
Bord Gáis Energy Index October 2015
Bord Gáis Energy Index October 2015Bord Gáis Energy Index October 2015
Bord Gáis Energy Index October 2015
 
Qnb group the US could become energy independent by 2030
Qnb group the US could become energy independent by 2030Qnb group the US could become energy independent by 2030
Qnb group the US could become energy independent by 2030
 
Deloitte: Oil and Gas Reality Check 2014
Deloitte: Oil and Gas Reality Check 2014Deloitte: Oil and Gas Reality Check 2014
Deloitte: Oil and Gas Reality Check 2014
 
Natural Gas Outlook
Natural Gas OutlookNatural Gas Outlook
Natural Gas Outlook
 
65th Annual BP Statistical Review of World Energy - June 2015
65th Annual BP Statistical Review of World Energy - June 201565th Annual BP Statistical Review of World Energy - June 2015
65th Annual BP Statistical Review of World Energy - June 2015
 
FEX | Industrie & Energie | 131112 | Conferentie Schaliegas & Olie | Presenta...
FEX | Industrie & Energie | 131112 | Conferentie Schaliegas & Olie | Presenta...FEX | Industrie & Energie | 131112 | Conferentie Schaliegas & Olie | Presenta...
FEX | Industrie & Energie | 131112 | Conferentie Schaliegas & Olie | Presenta...
 
Report: LNG Exports are America's Once-in-a-Generation Opportunity
Report: LNG Exports are America's Once-in-a-Generation OpportunityReport: LNG Exports are America's Once-in-a-Generation Opportunity
Report: LNG Exports are America's Once-in-a-Generation Opportunity
 
Plg broe presentation final v gb 062314
Plg broe presentation final v gb 062314Plg broe presentation final v gb 062314
Plg broe presentation final v gb 062314
 

Mais de Aranca

Mais de Aranca (20)

French Animal Healthcare Market
French Animal Healthcare MarketFrench Animal Healthcare Market
French Animal Healthcare Market
 
Global wearable devices market2017
Global wearable devices market2017Global wearable devices market2017
Global wearable devices market2017
 
Commercial drones-future-prospects 2017
Commercial drones-future-prospects 2017Commercial drones-future-prospects 2017
Commercial drones-future-prospects 2017
 
The GCC Facilities Management Market - Aranca
The GCC Facilities Management Market - ArancaThe GCC Facilities Management Market - Aranca
The GCC Facilities Management Market - Aranca
 
Brazilian pesticide market - Aranca
Brazilian pesticide market - ArancaBrazilian pesticide market - Aranca
Brazilian pesticide market - Aranca
 
Global Cryogenic Equipment Industry
Global Cryogenic Equipment IndustryGlobal Cryogenic Equipment Industry
Global Cryogenic Equipment Industry
 
China's Elevator and Escalator Market
China's Elevator and Escalator MarketChina's Elevator and Escalator Market
China's Elevator and Escalator Market
 
Global Aluminium Automotive Sheets Market
Global Aluminium Automotive Sheets MarketGlobal Aluminium Automotive Sheets Market
Global Aluminium Automotive Sheets Market
 
Indian Agro Chemical Sector
Indian Agro Chemical SectorIndian Agro Chemical Sector
Indian Agro Chemical Sector
 
Chinas Luxury Market - Losing Sheen
Chinas Luxury Market - Losing SheenChinas Luxury Market - Losing Sheen
Chinas Luxury Market - Losing Sheen
 
Saudi Aramco IPO - A Reality of Mythical Proportions
Saudi Aramco IPO - A Reality of Mythical ProportionsSaudi Aramco IPO - A Reality of Mythical Proportions
Saudi Aramco IPO - A Reality of Mythical Proportions
 
Fatca high cost initiative to curb tax evasion
Fatca high cost initiative to curb tax evasionFatca high cost initiative to curb tax evasion
Fatca high cost initiative to curb tax evasion
 
Winning shelf space private labels or fmcg brands
Winning shelf space private labels or fmcg brandsWinning shelf space private labels or fmcg brands
Winning shelf space private labels or fmcg brands
 
The disruptive power of virtual currency
The disruptive power of virtual currencyThe disruptive power of virtual currency
The disruptive power of virtual currency
 
Obamacare - Sectoral Winners and Losers
Obamacare - Sectoral Winners and LosersObamacare - Sectoral Winners and Losers
Obamacare - Sectoral Winners and Losers
 
Therapeutic Vaccines for Alzheimer’s — Are We Close Enough?
Therapeutic Vaccines for Alzheimer’s — Are We Close Enough?Therapeutic Vaccines for Alzheimer’s — Are We Close Enough?
Therapeutic Vaccines for Alzheimer’s — Are We Close Enough?
 
Indian Telecom Tower Industry - Aranca Research
Indian Telecom Tower Industry - Aranca ResearchIndian Telecom Tower Industry - Aranca Research
Indian Telecom Tower Industry - Aranca Research
 
Rise of Virtual Reality (VR)
Rise of Virtual Reality (VR)Rise of Virtual Reality (VR)
Rise of Virtual Reality (VR)
 
Insurance Industry is Going to Soar in the GCC
Insurance Industry is Going to Soar in the GCCInsurance Industry is Going to Soar in the GCC
Insurance Industry is Going to Soar in the GCC
 
Evolution of Powered Exoskeletons
Evolution of Powered ExoskeletonsEvolution of Powered Exoskeletons
Evolution of Powered Exoskeletons
 

Último

Mckinsey foundation level Handbook for Viewing
Mckinsey foundation level Handbook for ViewingMckinsey foundation level Handbook for Viewing
Mckinsey foundation level Handbook for Viewing
Nauman Safdar
 
The Abortion pills for sale in Qatar@Doha [+27737758557] []Deira Dubai Kuwait
The Abortion pills for sale in Qatar@Doha [+27737758557] []Deira Dubai KuwaitThe Abortion pills for sale in Qatar@Doha [+27737758557] []Deira Dubai Kuwait
The Abortion pills for sale in Qatar@Doha [+27737758557] []Deira Dubai Kuwait
daisycvs
 

Último (20)

Berhampur Call Girl Just Call 8084732287 Top Class Call Girl Service Available
Berhampur Call Girl Just Call 8084732287 Top Class Call Girl Service AvailableBerhampur Call Girl Just Call 8084732287 Top Class Call Girl Service Available
Berhampur Call Girl Just Call 8084732287 Top Class Call Girl Service Available
 
GUWAHATI 💋 Call Girl 9827461493 Call Girls in Escort service book now
GUWAHATI 💋 Call Girl 9827461493 Call Girls in  Escort service book nowGUWAHATI 💋 Call Girl 9827461493 Call Girls in  Escort service book now
GUWAHATI 💋 Call Girl 9827461493 Call Girls in Escort service book now
 
Uneak White's Personal Brand Exploration Presentation
Uneak White's Personal Brand Exploration PresentationUneak White's Personal Brand Exploration Presentation
Uneak White's Personal Brand Exploration Presentation
 
Kalyan Call Girl 98350*37198 Call Girls in Escort service book now
Kalyan Call Girl 98350*37198 Call Girls in Escort service book nowKalyan Call Girl 98350*37198 Call Girls in Escort service book now
Kalyan Call Girl 98350*37198 Call Girls in Escort service book now
 
Horngren’s Cost Accounting A Managerial Emphasis, Canadian 9th edition soluti...
Horngren’s Cost Accounting A Managerial Emphasis, Canadian 9th edition soluti...Horngren’s Cost Accounting A Managerial Emphasis, Canadian 9th edition soluti...
Horngren’s Cost Accounting A Managerial Emphasis, Canadian 9th edition soluti...
 
Putting the SPARK into Virtual Training.pptx
Putting the SPARK into Virtual Training.pptxPutting the SPARK into Virtual Training.pptx
Putting the SPARK into Virtual Training.pptx
 
Arti Languages Pre Seed Teaser Deck 2024.pdf
Arti Languages Pre Seed Teaser Deck 2024.pdfArti Languages Pre Seed Teaser Deck 2024.pdf
Arti Languages Pre Seed Teaser Deck 2024.pdf
 
Call 7737669865 Vadodara Call Girls Service at your Door Step Available All Time
Call 7737669865 Vadodara Call Girls Service at your Door Step Available All TimeCall 7737669865 Vadodara Call Girls Service at your Door Step Available All Time
Call 7737669865 Vadodara Call Girls Service at your Door Step Available All Time
 
Berhampur 70918*19311 CALL GIRLS IN ESCORT SERVICE WE ARE PROVIDING
Berhampur 70918*19311 CALL GIRLS IN ESCORT SERVICE WE ARE PROVIDINGBerhampur 70918*19311 CALL GIRLS IN ESCORT SERVICE WE ARE PROVIDING
Berhampur 70918*19311 CALL GIRLS IN ESCORT SERVICE WE ARE PROVIDING
 
joint cost.pptx COST ACCOUNTING Sixteenth Edition ...
joint cost.pptx  COST ACCOUNTING  Sixteenth Edition                          ...joint cost.pptx  COST ACCOUNTING  Sixteenth Edition                          ...
joint cost.pptx COST ACCOUNTING Sixteenth Edition ...
 
Mckinsey foundation level Handbook for Viewing
Mckinsey foundation level Handbook for ViewingMckinsey foundation level Handbook for Viewing
Mckinsey foundation level Handbook for Viewing
 
Berhampur CALL GIRL❤7091819311❤CALL GIRLS IN ESCORT SERVICE WE ARE PROVIDING
Berhampur CALL GIRL❤7091819311❤CALL GIRLS IN ESCORT SERVICE WE ARE PROVIDINGBerhampur CALL GIRL❤7091819311❤CALL GIRLS IN ESCORT SERVICE WE ARE PROVIDING
Berhampur CALL GIRL❤7091819311❤CALL GIRLS IN ESCORT SERVICE WE ARE PROVIDING
 
Dr. Admir Softic_ presentation_Green Club_ENG.pdf
Dr. Admir Softic_ presentation_Green Club_ENG.pdfDr. Admir Softic_ presentation_Green Club_ENG.pdf
Dr. Admir Softic_ presentation_Green Club_ENG.pdf
 
Nashik Call Girl Just Call 7091819311 Top Class Call Girl Service Available
Nashik Call Girl Just Call 7091819311 Top Class Call Girl Service AvailableNashik Call Girl Just Call 7091819311 Top Class Call Girl Service Available
Nashik Call Girl Just Call 7091819311 Top Class Call Girl Service Available
 
Pre Engineered Building Manufacturers Hyderabad.pptx
Pre Engineered  Building Manufacturers Hyderabad.pptxPre Engineered  Building Manufacturers Hyderabad.pptx
Pre Engineered Building Manufacturers Hyderabad.pptx
 
Chennai Call Gril 80022//12248 Only For Sex And High Profile Best Gril Sex Av...
Chennai Call Gril 80022//12248 Only For Sex And High Profile Best Gril Sex Av...Chennai Call Gril 80022//12248 Only For Sex And High Profile Best Gril Sex Av...
Chennai Call Gril 80022//12248 Only For Sex And High Profile Best Gril Sex Av...
 
QSM Chap 10 Service Culture in Tourism and Hospitality Industry.pptx
QSM Chap 10 Service Culture in Tourism and Hospitality Industry.pptxQSM Chap 10 Service Culture in Tourism and Hospitality Industry.pptx
QSM Chap 10 Service Culture in Tourism and Hospitality Industry.pptx
 
The Abortion pills for sale in Qatar@Doha [+27737758557] []Deira Dubai Kuwait
The Abortion pills for sale in Qatar@Doha [+27737758557] []Deira Dubai KuwaitThe Abortion pills for sale in Qatar@Doha [+27737758557] []Deira Dubai Kuwait
The Abortion pills for sale in Qatar@Doha [+27737758557] []Deira Dubai Kuwait
 
Cannabis Legalization World Map: 2024 Updated
Cannabis Legalization World Map: 2024 UpdatedCannabis Legalization World Map: 2024 Updated
Cannabis Legalization World Map: 2024 Updated
 
Lucknow Housewife Escorts by Sexy Bhabhi Service 8250092165
Lucknow Housewife Escorts  by Sexy Bhabhi Service 8250092165Lucknow Housewife Escorts  by Sexy Bhabhi Service 8250092165
Lucknow Housewife Escorts by Sexy Bhabhi Service 8250092165
 

Aranca views - Shale Gas - the Next Cradle of Energy?

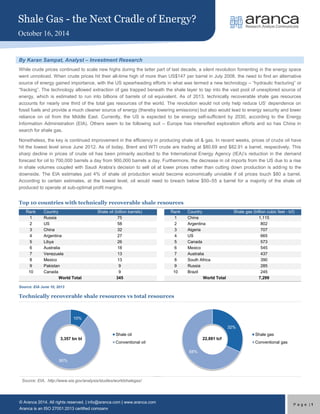
  • 1. s Shale Gas - the Next Cradle of Energy? October 16, 2014 © Aranca 2014. All rights reserved. | info@aranca.com | www.aranca.com Aranca is an ISO 27001:2013 certified company Page | 1 By Karan Sampat, Analyst – Investment Research While crude prices continued to scale new highs during the latter part of last decade, a silent revolution fomenting in the energy space went unnoticed. When crude prices hit their all-time high of more than US$147 per barrel in July 2008, the need to find an alternative source of energy gained importance, with the US spearheading efforts in what was termed a new technology – “hydraulic fracturing” or “fracking”. The technology allowed extraction of gas trapped beneath the shale layer to tap into the vast pool of unexplored source of energy, which is estimated to run into billions of barrels of oil equivalent. As of 2013, technically recoverable shale gas resources accounts for nearly one third of the total gas resources of the world. The revolution would not only help reduce US’ dependence on fossil fuels and provide a much cleaner source of energy (thereby lowering emissions) but also would lead to energy security and lower reliance on oil from the Middle East. Currently, the US is expected to be energy self-sufficient by 2030, according to the Energy Information Administration (EIA). Others seem to be following suit – Europe has intensified exploration efforts and so has China in search for shale gas. Nonetheless, the key is continued improvement in the efficiency in producing shale oil & gas. In recent weeks, prices of crude oil have hit the lowest level since June 2012. As of today, Brent and WTI crude are trading at $80.69 and $82.91 a barrel, respectively. This sharp decline in prices of crude oil has been primarily ascribed to the International Energy Agency (IEA)’s reduction in the demand forecast for oil to 700,000 barrels a day from 900,000 barrels a day. Furthermore, the decrease in oil imports from the US due to a rise in shale volumes coupled with Saudi Arabia’s decision to sell oil at lower prices rather than cutting down production is adding to the downside. The EIA estimates just 4% of shale oil production would become economically unviable if oil prices touch $80 a barrel. According to certain estimates, at the lowest level, oil would need to breach below $50–55 a barrel for a majority of the shale oil produced to operate at sub-optimal profit margins. Top 10 countries with technically recoverable shale resources Rank Country Shale oil (billion barrels) 1 Russia 75 2 US 58 3 China 32 4 Argentina 27 5 Libya 26 6 Australia 18 7 Venezuela 13 8 Mexico 13 9 Pakistan 9 10 Canada 9 World Total 345 Rank Country Shale gas (trillion cubic feet - tcf) 1 China 1,115 2 Argentina 802 3 Algeria 707 4 US 665 5 Canada 573 6 Mexico 545 7 Australia 437 8 South Africa 390 9 Russia 285 10 Brazil 245 World Total 7,299 Source: EIA June 10, 2013 Technically recoverable shale resources vs total resources Source: EIA, http://www.eia.gov/analysis/studies/worldshalegas/ 10% 90% 3,357 bn bl Shale oil Conventional oil 32% 68% 22,881 tcf Shale gas Conventional gas
  • 2. s Shale Gas - the Next Cradle of Energy? October 16, 2014 © Aranca 2014. All rights reserved. | info@aranca.com | www.aranca.com Aranca is an ISO 27001:2013 certified company Page | 2 US Shale Gas: Energy Self Sufficiency in 15 Years! Shale gas to play a significant role in meeting US energy demand The US has witnessed the most successful shale gas developments to date. The International Energy Agency (IEA) reported the US is forecast to surpass Russia and Saudi Arabia as the world’s leading oil producer by 2015 due to the shale gas boom. Natural gas accounts for approximately 30% of US energy consumption. The contribution of shale gas to US domestic gas production increased from a meager 2% in 2000 to 23% by 2010. The Energy Information Administration (EIA) projects shale gas to account for 48% of total US gas supply by 2030. Due to its high British thermal unit (BTU) content and the well-developed storage and transfer infrastructure, natural gas is widely used in the country’s industrial, commercial, and residential sectors. The US unconventional energy boom has reversed the decline of domestic production and suppressed gas prices. Thus, shale gas is likely to play a substantial role in meeting US energy demands. Contribution of shale gas to domestic gas production Source: Annual Energy Outlook 2014 Early Release US likely to be net exporter of LNG by 2016 The US is speculated to be the net exporter of natural gas by the end of 2016. Due to the shale revolution, production of gas is expected to far exceed the expected consumption. This is evident from a drastic fall in the import of natural gas in the US and also, conditional approval by Department of Energy (DOE) in past one year, to build six LNG export facilities further strengthens the claim. The excess gas is likely to be exported largely to Asia, where the prices of natural gas are the most attractive. Forecasted production and consumption of natural gas in US (quadrillion Btu) Source: Annual Energy Outlook 2014 Early Release Economic impact of shale gas The US was expected to have imported 10 billion cubic feet of natural gas, if not shale gas, per day by now. However, the country could potentially export 10 billion cubic feet of gas per day by 2020 instead. Shale gas can have a multiplier effect on the US economy far beyond just the supply chain from exploration sites to exports. According to data from the EIA, the US currently produces 14% more of its own energy than in 2005. Natural gas production is projected to increase 3% per year until 2020 vis-à-vis 2011, whereas consumption is estimated to increase by just 1% annually over the same period. Moreover, petroleum contributed $13.82 billion to US exports in July, according to data released by the US Department of Commerce on September 4, 2014. This represents a $1.72 billion increase over July 2013. This helped reduce the overall US trade deficit to $40.5 billion in July, from $40.8 billion in June. In addition to 98% 2% 2000 77% 23% 2010 58% 42% 2020 52% 48% 2030 Total gas production Shale gas 51% 49% 2011 55% 45% 2020 57% 43% 2030 57% 43% 2040 Production Consumption
  • 3. s Shale Gas - the Next Cradle of Energy? October 16, 2014 © Aranca 2014. All rights reserved. | info@aranca.com | www.aranca.com Aranca is an ISO 27001:2013 certified company Page | 3 oil & gas export and reducing the trade deficit, shale gas has the potential to revive the transportation, petrochemical, power generation, and manufacturing sectors as well as increase disposable income per household by reducing electricity bills. By enhancing the global supply of natural gas, the US can establish much-required energy security for itself as well as its trade partners. The price of natural gas rose from $2.42 million btu (mmbtu) in 2000 to $12.69 mmbtu in June 2008. In most recent years, natural gas prices stabilized around $4.00 mmbtu, largely due to the advent of shale gas developments. The EIA reports natural gas prices would remain below $5 mmbtu until 2023. The manufacturing sector in the US could recover, supported by such sustainable lower energy costs compared with those incurred by its global peers.. Consumption of various energy sources in the US (quadrillion Btu) Source: Annual Energy Outlook 2014 Early Release Effect of shale gas on sectors Looking at the energy demand pattern, oil is the primary source of fuel in the transportation sector, whereas natural gas is mainly used in the residential, commercial, industrial and power generation sectors. However, low gas prices and high oil price may encourage more future investments based on natural gas in this sector. Transportation sector: Low gas prices and high oil prices may result in substitution of oil with natural gas in this sector. Natural gas can be used in two ways in the transportation sector: 1) Compressed Natural Gas (CNG) and 2) Liquefied natural gas (LNG). The major advantage of LNG over CNG is that it can hold three times more fuel than the latter and thereby cover more mileage. A key drawback of LNG’s commercial viability is that it requires a low temperature tank, which needs high cost and is difficult to downsize. Therefore, LNG will take more time to be extensively commercialized. Currently, CNG is mainly used in public transportation such as buses and carrier services, which have short and medium range operation. The future of LNG in transportation will depend upon how fast auto manufacturers are able to introduce vehicles that run on LNG. Pricing and fuel efficiency of such vehicles would be the keys to success of LNG in the transportation sector. Thus, natural gas has the potential to transform the transportation sector. Petrochemical sector: Naphtha and ethane are the two most widely used feedstocks in the US chemical industry. Naphtha is derived from oil and ethane from natural gas liquids (NGL). Energy prices in the US have decreased due to the shale gas revolution, thereby significantly reducing the US petrochemical industry’s raw material costs. PwC, in its report dated 2012, reported that by 2025, shale gas could enable US manufacturers to reduce their raw material and energy costs by $11.6 billion annually. Ethane, the raw material for producing ethylene, is separated from the NGL contained in shale gas. Ethane prices have fallen by more than 50% in five years. This has led to increased new investments toward ethane-based plants. According to a study by Booz & Co., NGLs from conventional gas would constitute 60% of US ethylene feedstock source by 2015, followed by NGLs from shale gas at 28% and the remaining 12% would include naphtha and heavier feedstock. The abundant supply of NGL due to the shale gas revolution decreased the price of ethane, thereby making it cheaper to produce ethylene. The cost involved in setting up a naphtha based plant (355 killiotonnes per Natural gas Oil Coal Others 0 20 40 60 80 100 120
  • 4. s Shale Gas - the Next Cradle of Energy? October 16, 2014 © Aranca 2014. All rights reserved. | info@aranca.com | www.aranca.com Aranca is an ISO 27001:2013 certified company Page | 4 annum - ktpa) and a gas based plant (500 ktpa) can be approximately $715 million and $718 million respectively. Assuming the abundance in supply of natural gas continues, US chemical companies would benefit from the low cost of ethylene production. PwC reported the US chemicals industry invested $15 billion in ethylene production, increasing capacity by 33%. However, this might pose a threat to naphtha crackers. Although ethane crackers have benefitted from the low price of natural gas in the US, naphtha crackers would have to focus on developing high-value products to survive the competition. Power generation sector: The EIA estimates the average power plant capital and operating costs based on natural gas to be at $1,157/kW vis-à-vis $3,640/kW for coal-based plants in 2012. Lower capital and operating costs, coupled with lower natural gas prices, would drive more power plant operators toward natural gas and increase its share in the power generation fuel mix. Cheaper gas would reduce the cost of producing electricity and overall electricity prices. Lower electricity prices would imply more annual household income. In the near term, power generation companies could switch from other fuels to natural gas by varying the capacity factors of different generating units to take advantage of the cheaper fuel. US to be energy self-sufficient by 2030 As reported by the EIA in its Annual Energy Outlook 2014 Early Release, crude oil production is forecast to increase 5.9% each year from 2011 until 2020 and natural gas by 3% during the same period. Energy consumption is projected to remain flat at 100.73 quadrillion Btu in 2020 vis-à-vis 97.11 quadrillion Btu in 2011. Thus, the US is estimated to become energy self-sufficient by 2030 owing to increased production of oil and gas and slowing domestic demand. The IEA forecasts the US to overtake Saudi Arabia to become the world’s top oil producer over the next two decades due to increasing shale oil and gas output. Current and expected investments in shale gas transport infrastructure from 2011 through 2035 Shale play would require investments of about $56 billion ($2.6 billion/year) over the next 22 years. Natural gas infrastructure  New gas transmission capability – Approximately 43 Bcfd  New gas transmission mainline – 850 miles/year  New laterals to/from power plants, processing facilities, and storage fields – 800 miles/year  New gas gathering lines – almost 14,000 miles/year  New gas processing capability – Approximately 35 Bcfd  New working gas storage capacity – Approximately 37 Bcf/year  Pipeline and gathering compression – More than 580,000 horsepower/year Natural Gas Liquid (NGL) infrastructure  NGL transmission capacity – 3.6 mmbpd  New NGL transmission line – 700 miles/year  Pumping requirement for pipeline – 30,000 horsepower/year  NGL fractionation capacity – Approximately 151 MBOE/d to be added each year  NGL export capacity – 64 MBOE/d to be added each year Source: http://www.ingaa.org/File.aspx?id=21498
  • 5. s Shale Gas - the Next Cradle of Energy? October 16, 2014 © Aranca 2014. All rights reserved. | info@aranca.com | www.aranca.com Aranca is an ISO 27001:2013 certified company Page | 5 Canada: It’s time to look beyond North America All eggs hatched in the same basket Canada is the world’s third largest producer of natural gas. Western Canada is blessed with vast unconventional gas reserves. The country currently exports 50% of the natural gas it produces to North America. However, demand for Canadian natural gas has decreased in the US, as the country is all set to be self-sufficient in natural gas due to shale gas developments. Canada does not have export terminals that can transport LNG beyond North America. It also lacks processing facilities to liquefy and ship LNG beyond North America. Going forward, will it be Europe or Asia? Canada will have to turn to Europe, or Japan, China and other developing Asian countries to sell the excess natural gas it produces. The Asian energy market is significantly closer to the west coast of Canada than the European markets; thus, producers could examine market opportunities in Asia and particularly those in South East Asia. With just eight sailing days to Japan and 11 sailing days to China, the west coast ports of Kitimat and Prince Rupert are closer to these markets than any other North American port. Proposed projects Northern Gateway, Trans Mountain Expansion (TMX) and Keystone XL are the proposed pipeline projects that would help Canadian energy producers to access new markets.  Enbridge’s Northern Gateway project (capacity of 193 thousand barrels per day) and Kinder Morgan’s TMX project (capacity of 890 thousand barrels per day) will help reach the growing energy markets of Asia.  TransCanada’s Keystone XL would provide access to the refining capacity on the US Gulf Coast.
  • 6. s Shale Gas - the Next Cradle of Energy? October 16, 2014 © Aranca 2014. All rights reserved. | info@aranca.com | www.aranca.com Aranca is an ISO 27001:2013 certified company Page | 6 Europe – Uncertainty prevails over shale gas exploration Europe to benefit from US Shale gas revolution Russia is the largest exporter of oil and gas to the EU. Gazprom, Russia’s state-owned company, transports gas to Europe via Ukraine. The frequent tensions between Russia and Ukraine have often impacted gas supplies to Europe. The US shale gas revolution could prove to be a boon for Europe if US companies decide to produce adequate quantity to be supplied to Europe, thereby reducing their dependence on Russia. It brings the opportunity to diversify energy supply. A decrease in the prices of natural gas due to higher supply could also help the recession hit Europe limit costs. Current scenario of shale gas in Europe Although sizeable quantity of shale gas has been reported in Europe, none of the Western European countries currently feature in the top 10 technically recoverable shale oil and gas resources. Large-scale shale gas production remains a big question due to the wide range of environmental, regulatory and economic obstacles. Significant regulatory risks persist due to lack of regulatory framework. Also, the EU member countries are unable to reach a consensus of opinion. France and Bulgaria have legally prohibited shale gas production, while public discussion on shale gas is going on in Germany and the Netherlands. EU members also differ on the potential environmental risks of the fracking activity. On the economic front, shale gas deposits in Europe are located much deeper than that in the US and would require higher gas prices to be exploited in a commercial attractive way. Moreover, European companies lack the technical know-how on fracking techniques and skilled resources. Unconventional producers of gas to compete with conventional producers Countries like Russia, Algeria, and Norway are the major suppliers of conventional gas to Europe. These countries can set the marginal gas price at any time if desired for geopolitical or economic reasons. Therefore, any shale gas developments have to compete with the abundant conventional supply of gas in this region. Help in achieving carbon emissions target Europe has the toughest carbon emissions target in the world. It aims to cut gas emissions by 40% by 2030 compared with the 1990 level. Shale gas offers a cheap and carbon friendly way to meet energy needs and might prove to be vital in achieving carbon emission targets. Thus, improving energy efficiency and promoting low-carbon technologies will be just as important as before, especially for the EU, given its more limited known reserves of unconventional oil and gas.
  • 7. s Shale Gas - the Next Cradle of Energy? October 16, 2014 © Aranca 2014. All rights reserved. | info@aranca.com | www.aranca.com Aranca is an ISO 27001:2013 certified company Page | 7 China has potential, currently prefers playing the waiting game Coal expected to dominate; natural gas consumption projected to increase threefold by 2025 Coal forms the major source of energy consumption in China and is expected to dominate for the considerable future. Demand for natural gas is expected to increase approximately 2.7 times from 3.768 tcf in 2010 to 10.27 tcf in 2025, as reported by EIA. China energy consumption (quadrillion Btu) Source: Annual Energy Outlook 2014 Early Release Issues that need to be mitigated to produce shale gas China has the largest (1,115 tcf) technically recoverable shale gas reserves in the world. It also has a regulatory framework that supports the development of shale gas technology. The key issues it might face for exploration of shale gas are shortage of water, depth of gas deposits, and lack of infrastructure to process and transport natural gas from the exploration site. China needs to develop strategic partnership with foreign companies to adopt the skills and technologies needed to develop and explore gas reserves. Use of natural gas needs to be encouraged Being a manufacturing economy, China is plagued with environmental issues, particularly air pollution. Use of natural gas in manufacturing can help the country mitigate this problem. Greater adoption of natural gas in manufacturing could lead to less dependence on coal and increase shale gas development activity in China. Commencement of shale gas development in China could significantly reduce shale gas prices. The cost of drilling is believed to be high in China when compared to the US due to location- specific conditions. State-owned oil and gas company Sinopec stated that the cost of drilling one shale gas well, including the cost for drilling, fracturing and procurement of services from technical service companies, is currently around $14.7 million vis-à-vis $6.7 million on average in the US. Russia-China Natural Gas Deal China recently made a 30-year deal with Russia at a price range of $10.50–11 per mmbtu to buy 3.8 million cubic feet per day of natural gas from 2018 via a pipeline from Eastern Serbia. This deal could possibly set a benchmark price for further natural gas deals for Asian peers. The key inference from this deal is that the cost of regasification, liquefaction, and transport to Asia can be approximated at $7 per mmbtu (assuming the LNG cost in the US is $4 per mmbtu). Another possible inference is that China would only explore shale developments in sizable quantities at a cost less than $11 per mmbtu. (assuming the LNG cost in the US is stable at $4 per mmbtu for next few years) NG Liquids Coal Others 0 50 100 150 200 250
  • 8. s Shale Gas - the Next Cradle of Energy? October 16, 2014 © Aranca 2014. All rights reserved. | info@aranca.com | www.aranca.com Aranca is an ISO 27001:2013 certified company Page | 8 Impact on GCC Need to realign the core market from US to Asia The shale gas revolution has had limited impact on GCC so far, as the US is yet to reduce oil imports in significant quantities from the region. GCC countries are major oil producing economies. Currently, the US is one of the major importers of crude oil from GCC. This trend is about to change due to the shale gas revolution. With the global energy demand for oil expected to increase, GCC countries would need to realign their core market to Asia from US. This could represent both an opportunity as well as threat to GCC countries. World energy consumption by fuel type, 1990–2040 (quadrillion Btu) Source: International Energy Outlook 2013, EIA Qatar needs to find an alternative to oil price indexed contracts Qatar leads among GCC countries in terms of producing huge quantities of natural gas. Qatar is the world’s largest exporter of LNG and enjoys long-term gas contracts linked to the price of oil. Asia accounts for almost half of Qatar’s LNG export. Due to emergence of natural gas supplies from North America and the option of indexing the contract price of natural gas to Henry Hub Natural Gas Spot Price (which is less volatile than crude oil price), Qatar’s Asian partners are likely to ink deals with the US. Also, countries are not willing to pen down long-term gas contracts due to the prevailing uncertainty in future gas prices; this could impact Qatar’s profitability. Favorable raw material conditions in Qatar Qatar expects demand from Asia to increase fast enough to more than compensate for the reduction in demand from the US. The country can increase export volumes to Asia, mainly China and Japan, where demand for LNG is expected to increase considerably enough to absorb the excess LNG supplies from shale gas developments. The recent shale gas developments provide Qatar with new opportunities. In the foreseeable future, Qatar would still have favorable raw material conditions. The country can benefit from it by altering end markets around shale gas induced market changes. GCC countries with current account surplus need to venture in US shale play Another option for GCC companies would be to participate in the US shale boom by venturing in companies engaged in the exploration and production of shale developments. Increasing advancement in the fracking methodology in the US, which will lower the cost of exploration, coupled with compressed natural gas prices, are bound to impact the profit margins of GCC countries. 0 50 100 150 200 250 1990 1991 1992 1993 1994 1995 1996 1997 1998 1999 2000 2001 2002 2003 2004 2005 2006 2007 2008 2009 2010 2011 2012 2013 2014 2015 2016 2017 2018 2019 2020 2021 2022 2023 2024 2025 2026 2027 2028 2029 2030 2031 2032 2033 2034 2035 2036 2037 2038 2039 2040 Liquids Coal Natural gas Renewables Nuclear Projections History 2010
  • 9. s Shale Gas - the Next Cradle of Energy? October 16, 2014 © Aranca 2014. All rights reserved. | info@aranca.com | www.aranca.com Aranca is an ISO 27001:2013 certified company Page | 9 Critical factors to shale gas production Cost of producing natural gas: The cost of producing natural gas varies from site to site and country to country. Ken Medlock, Senior Director of Rice University’s Baker Institute Center reported that in the US, some wells have a profitable cost of $2.65 per thousand cubic feet (tcf), whereas others cost $8.1 per tcf. The median cost is $4.85 per tcf. It is difficult to translate shale development costs in the US to those in other areas globally. For example, Medlock revealed a 10,500 vertical foot well with a 4,000 foot lateral in the Haynesville Shale costs about $8 million; however, the same well in Poland would cost $14–16 million. This is due to the higher costs associated with importing equipment, fracking crews, and deeper shale reserves vis-à-vis the US, among others. The most important observation here is that the median cost price of $4.85 per tcf is less than the $11 per mmbtu benchmark set by the Russia-China deal. Market price: The prevailing market price of natural gas will be the key to determine the viability of producing the discovered natural gas. Recovery of investment: Shale gas production must be sufficient enough to recover the investment in time. Logistics should be efficient enough to facilitate distribution to end markets. Infrastructure: Exploration and production sites must be adequately serviced by roads and pipelines to process and transport natural gas. Regulatory framework: Regulatory support in the form of transparency in allocation of permits and licenses, stable regulatory regime, subsidies for exploration and production would aid the private companies engaged in shale gas production. Environmental concerns: Fracking is a water-intensive process and might pose risks in areas where availability of water is a problem. Waste water, which is kept in storage ponds, could overflow during heavy rains. Fracking may also contaminate groundwater and lead to air quality degradation. Spills and blow outs: Spills and blow outs could cause severe health and environment hazards if the gas gets mixed with ground water and contaminates it or might spread into the surrounding soil. If gas gets mixed with groundwater, it may lead to tremors or explosion due to pressure build up by gastification.
  • 10. s Shale Gas - the Next Cradle of Energy? October 16, 2014 © Aranca 2014. All rights reserved. | info@aranca.com | www.aranca.com Aranca is an ISO 27001:2013 certified company Page | 10 ARANCA DISCLAIMER This report is published by Aranca, Inc. Aranca is a customized research and analytics services provider to global clients. The information contained in this document is confidential and is solely for use of those persons to whom it is addressed and may not be reproduced, further distributed to any other person or published, in whole or in part, for any purpose. This document is based on data sources that are publicly available and are thought to be reliable. Aranca may not have verified all of this information with third parties. Neither Aranca nor its advisors, directors or employees can guarantee the accuracy, reasonableness or completeness of the information received from any sources consulted for this publication, and neither Aranca nor its advisors, directors or employees accepts any liability whatsoever (in negligence or otherwise) for any loss howsoever arising from any use of this document or its contents or otherwise arising in connection with this document. Further, this document is not an offer to buy or sell any security, commodity or currency. This document does not provide individually tailored investment advice. It has been prepared without regard to the individual financial circumstances and objectives of persons who receive it. The appropriateness of a particular investment or currency will depend on an investor’s individual circumstances and objectives. The investments referred to in this document may not be suitable for all investors. This document is not to be relied upon and should not be used in substitution for the exercise of independent judgment. This document may contain certain statements, estimates, and projections with respect to the anticipated future performance of securities, commodities or currencies suggested. Such statements, estimates, and projections are based on information that we consider reliable and may reflect various assumptions made concerning anticipated economic developments, which have not been independently verified and may or may not prove correct. No representation or warranty is made as to the accuracy of such statements, estimates, and projections or as to its fitness for the purpose intended and it should not be relied upon as such. Opinions expressed are our current opinions as of the date appearing on this material only and may change without notice. © 2014, Aranca. All rights reserved.